Quantcast
Channel: Sameh Attia
Viewing all 1413 articles
Browse latest View live

How to Benchmark Your Linux System

$
0
0
https://linuxconfig.org/how-to-benchmark-your-linux-system

Objective

Use GeekBench, Sysbench, Hardinfo, and Phoronix Test Suite to benchmark your Linux system.

Distributions

This will work on most modern distributions.

Requirements

A working Linux install with root privileges.

Difficulty

Easy

Conventions

  • # - requires given linux command to be executed with root privileges either directly as a root user or by use of sudo command
  • $ - given linux command to be executed as a regular non-privileged user

Introduction

There are a bunch of reasons that you'd want to benchmark your Linux system. Most people benchmark out of pure curiosity or to measure the system's performance for games. Benchmarking can also help you identify problems with your system, though, and improve weak points for a smoother and more efficient experience. Benchmarking also helps you identify possible software issues and problematic upgrades with regressions.

There are a number of great ways to benchmark your Linux system. This guide will cover a few of the most common ones. Using any number of these will give you a good perspective of what your system can do, and where its possible weak points are.

Sysbench

Sysbench is a mutli-purpose benchmark that features tests for CPU, memory, I/O, and even database performance testing. It's a basic command line utility that offers a direct and uncomplicated way to test your system.

Install Sysbench

Start by installing Sysbench on your system. It's available from most distribution repositories.

Ubuntu/Debian
$ sudo apt install sysbench
Fedora
# dnf install sysbench
OpenSUSE
# zypper in sysbench
Arch Linux

Sysbench is available from the AUR. Go to its page, and follow your preferred procedure to install it.


CPU

Sysbench CPU Benchmark
All the tests are fairly straightforward. You can run the test with --test=X run. Change the run to help to get the options specific to that test. Why not start out by running the CPU test. It's probably the most common one that you'll want to check, especially if you're an overclocker.
$ sysbench --test=cpu run
The test will take a bit of time to run, and afterward, you'll see your results printed out in the terminal.

Memory

Sysbench Memory Benchmark
The memory test follows the exact same rules as the CPU one. Run it too.
$ sysbench --test=memory run
Once again, you'll see your results in the terminal.

I/O

Sysbench I/O Benchmark
The file I/O test is a little different. You also need to tell it which type of I/O test to run. You can see the available tests by running the help command for the test. A basic sequential write looks like this:
$ sysbench --test=fileio --file-test-mode=seqwr run
Just like the others, you'll see a report when it's done.


GeekBench

GeekBench is another complete test suite that's available for Linux. GeekBench automatically puts your system through a battery of tests and produces a complete set of results as well as an overall score.

You can head over to the GeekBench website, and download the latest release for Linux. GeekBench is proprietary software and comes as a set of binaries in a tarball. When it's finished downloading, unpack the tarball wherever is convenient.

GeekBench Benchmark Running
Open a terminal in the GeekBench directory that you just unpacked, and run the binary to start your test.
$ ./geekbench4
GeekBench Benchmark Finished
After the test, Geekbench will give you a URL to view your complete test results.

GeekBench Benchmark Results
The results are organized in a table, with your complete score on top. As you scroll through the table, you'll see your results on specific tests that GeekBench ran.


Hardinfo

Hardinfo is a great utility that provides both detailed system information and a series of basic benchmarks. It's open source, and it's available in most distribution's repositories.

Install Hardinfo

Ubuntu/Debian
$ sudo apt install hardinfo
Fedora

For some reason, the Fedora developers decided to stop packaging Hardinfo, so you'll need to build it yourself.

# dnf install glib-devel gtk+-devel zlib-devel libsoup-devel
$ cd Downloads
$ git clone https://github.com/lpereira/hardinfo.git
$ cd hardinfo
$ mkdir build
$ cd build
$ cmake ..
$ make
# make install
OpenSUSE
# zypper in hardinfo
Arch Linux
# pacman -S hardinfo

Using Hardinfo

Open up Hardinfo on your computer. It's a graphical utility, and it should be categorized under System by your distribution's launcher.

Hardinfo
Hardinfo
Once it's open, you'll see a listing of tabs to the left organized by category and the information contained in those tabs on the right. Feel free to click through the tabs, and check out the info about your system. There's a lot of detailed readouts that can provide some insight without the need to run a test.

The final category at the bottom of the list is "Benchmarks." There are only a handful there, but they all can be pretty useful. Click on the tab you want, and Hardinfo will run the benchmark. When it's finished, it'll display your results in the right pane.


Phoronix Test Suite

Phoronix Test Suite is a complete benchmark suite that curates loads of Linux benchmark tools under one umbrella with PHP scripts.

Installation and Graphics Tests

For information on how to install Phoronix Test Suite on your distribution and run graphics tests, check out our guide on graphics benchmarking with PTS. When you have the suite installed and working, you can move on to the rest of the tests here. The rest of these tests are just a sampling of what Phoronix Test Suite has. They're more general purpose and practical tests.

John The Ripper

John The Ripper Benchmark
John The Ripper is a classic password cracking program used by security testers, but the stress that it places on your CPU makes it an ideal program to test with. Start by installing the test.
$ phoronix-test-suite install john-the-ripper
When that finishes, run the test.
$ phoronix-test-suite run john-the-ripper
The test will run three times, and you'll see your results displayed in the terminal.

LuxMark

LuxMark is another performance test that measures both OpenCL performance of both the CPU and GPU. They're both obviously important parts of your computer as a whole, and this test is also great if you plan on using your computer for any compute tasks.
$ phoronx-test-suite install luxmark
Then run it.
$ phoronix-test-suite run luxmark


Compile Firefox

Firefox is a beast of a program. It's absolutely massive, and it takes a lot of time and system resources to compile. If you really want to test your system, especially your CPU to the max, try compiling Firefox.

$ phoronix-test-suite install compile-firefox
$ phoronix-test-suite run compile-firefox

Compress Gzip

Gzip compression is another great example of a practical test that you can conduct on your Linux system. Chances are, you use gzip on a regular basis, so measuring its performance gives you a real world way to see how your system stacks up.

$ phoronix-test-suite install compress-gzip
$ phoronix-test-suite run compress-gzip

Closing Thoughts

You now have a full set of tools to benchmark your Linux system. With these, you can accurately asses the strength of your system and its performance compared to other computers. You also have a way of rooting out the weakest links and upgrading them.


Browsh – A Modern Text Browser That Supports Graphics And Video

$
0
0
https://www.ostechnix.com/browsh-a-modern-text-browser-that-supports-graphics-and-video


Browsh - A Modern Text Browser That Supports Graphics And Video
Browsh is a modern, text-based browser that supports graphics including video. Yes, you read that right! It supports HTML5, CSS3, JavaScript, photos, WebGL content and of course video as well. Technically speaking, it is not much of a browser, but some kind of terminal front-end of browser. It uses headless Firefox to render the web page and then converts it to ASCII art. According to the developer, Browsh significantly reduces the bandwidth and increases the browsing speed. Another cool feature of browsh is you can ssh from, for example an old laptop, to a regular computer where you have Browsh installed, and browse HTML5 webpages without much lag. Browsh is free, open source and cross-platform.

Install Browsh

Browsh uses headless Firefox, so you must have Firefox version 57 or later in your system.
Browsh is available in AUR, so you can install it using any AUR helpers.
Using Yay:
$ yay -S browsh-bin
For other Linux distributions, download the binaries from releases page and manually install it.
A Docker image is also available. Install Docker as described in the following links.
Once Docker installed, you can run Browsh using command:
$ docker run --rm -it browsh/browsh

Usage

To launch Browsh, run the following command:
$ browsh
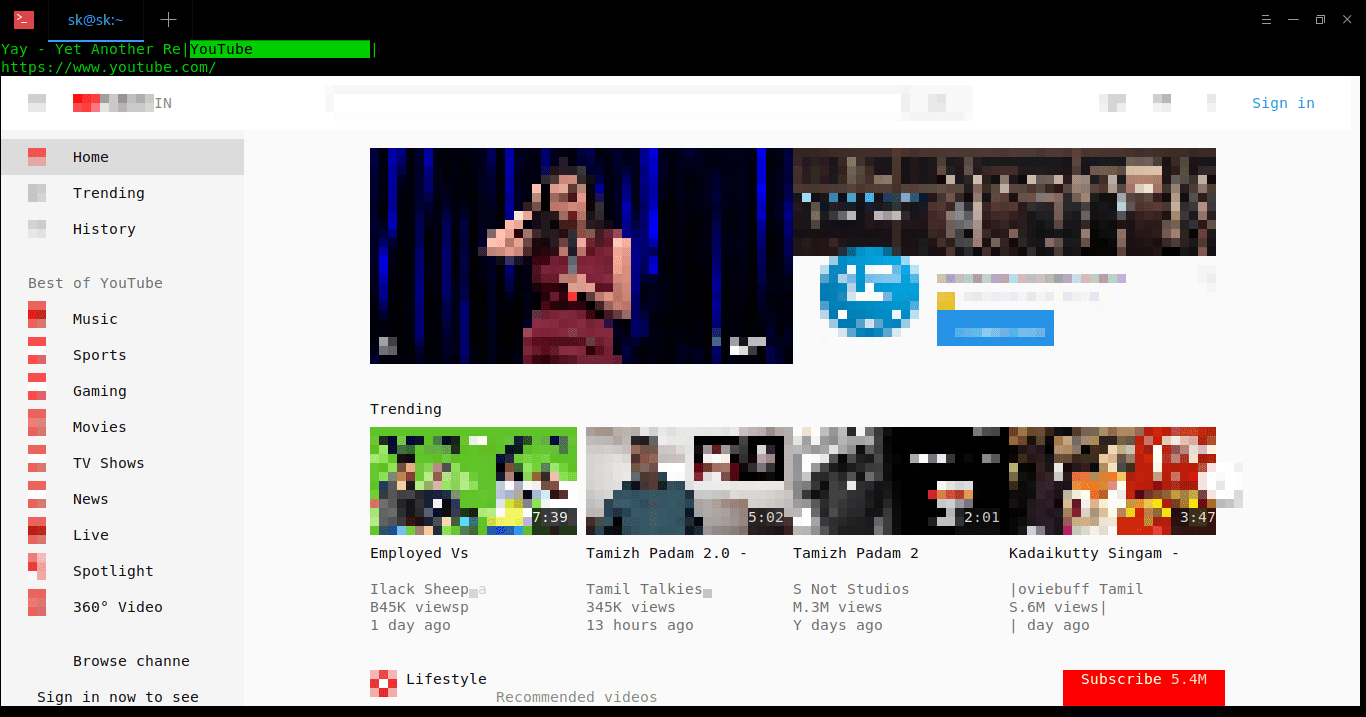
Here is how Browsh looks like in action.

Cool, yeah?
Browsh can render anything that Firefox can. So, you can browse through any websites.
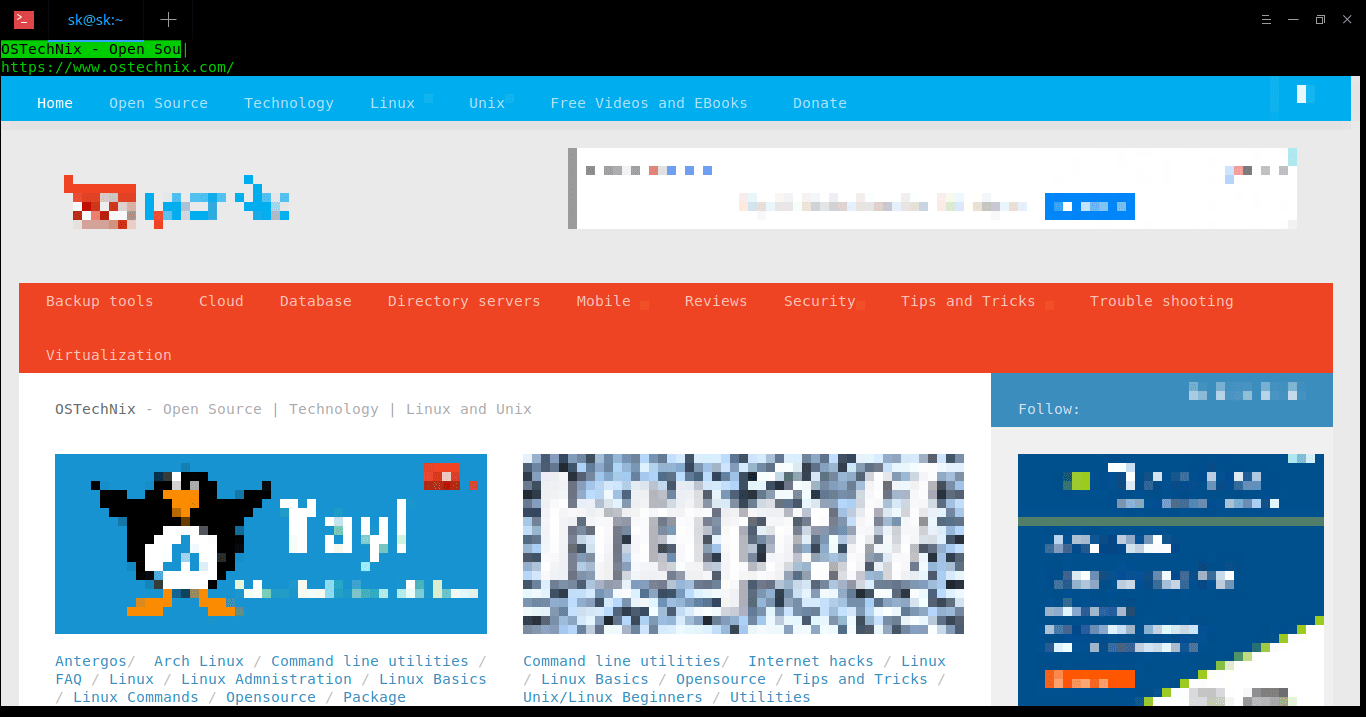
Here is how OSTechNix blog looks in Browsh.

Just click left mouse button to follow any links.

To reload the current page, press CTRL+r.
Want to open a new tab? Simply press CTRL+t.

If you have multiple tabs opened, you can switch to next tab using CTRL+TAB. To close the currently active tab, press CTRL+w.
Want to take a screenshot of a page? Browsh has that option too. Press ALT+SHIFT+p. The status bar will display the saved path.
Like I already mentioned, you can watch videos as well.

Keybindings
Here is the list of keybindings to use Browsh text-based browser.
  • F1– Opens the documentation;
  • ARROW KEYS, PGUP, PGDN– Scrolling;
  • CTRL+q– Exit Browsh;
  • CTRL+l– Focus the URL bar;
  • BACKSPACE– Go back in history;
  • CTRL+r– Reload page;
  • CTRL+t– Open a new tab;
  • CTRL+w– Close tab;
  • CTRL+TAB– Switch to next tab;
  • ALT+SHIFT+p– Takes a screenshot.
  • ALT+m– Toggles monochrome mode. It is useful for overcoming rendering problems on older terminals;
  • ALT+u– Toggles the user agent between a desktop and a mobile device. Useful for smaller terminals that want to use a more suitable layout.

Live SSH Demo

If you don’t want to install it, you can view the demo to know how Browsh works by running the following command from your Terminal.
$ ssh brow.sh

The demo automatically closes after 5 minutes, so you better be hurry to test everything you wanted to know within 5 minutes.
For more detailed instructions, watch the following video.
I find it very cool and fascinating way to browse the Internet, without leaving the Terminal. Browsh solves the problem for those who can’t afford fast and cheap Internet. Browsh can be run on a remote VM and its lightweight output can be accessed either via SSH/Mosh or its HTML service. So now even if you only have a 3kb/s connection you can still access all the sites that the rest of the world can. Give it a try, you won’t be disappointed.
More good stuffs to come. Stay tuned!
Cheers!
Resources:

Linux apropos Command Tutorial for Beginners (5 Examples)

$
0
0
https://www.howtoforge.com/linux-apropos-command

In Linux, if you ever need help regarding a command, all you need to do is to open its man page. But what if a situation arises wherein the requirement is to quickly search the names and descriptions of all available man pages? Well, Linux has got your covered, as there exists a command dubbed apropos that does exactly this for you.
In this tutorial, we will discuss the basics of apropos using some easy to understand examples. But before we do that, it's worth mentioning that all examples here have been tested on an Ubuntu 16.04 LTS machine.

Linux apropos command

The apropos command searches manual page names and descriptions for a user-supplied keyword. Following is its syntax:
apropos [OPTIONS] keyword ...
And here's what the tool's man page says about it:
       Each manual page has a short description available within it.   apropos
       searches the descriptions for instances of keyword.

       keyword  is  usually  a regular expression, as if (-r) was used, or may
       contain wildcards (-w), or match the exact keyword (-e).   Using  these
       options,  it  may  be  necessary to quote the keyword or escape (\) the
       special characters to stop the shell from interpreting them.

       The standard matching rules allow matches to be made against  the  page
       name and word boundaries in the description.

       The  database  searched  by  apropos  is  updated by the mandb program.
       Depending on your installation, this may be run by a periodic cron job,
       or  may  need  to  be  run  manually  after  new manual pages have been
       installed.
Following are some Q&A-styled examples that should give you a good idea on how the apropos command works.

Q1. How to use apropos?

Basic usage is simple. Just pass the keyword you want to search as input to the apropos command.
For example:
apropos dmesg
produced the following result:
dmesg (1)            - print or control the kernel ring buffer
Of course, you can pass multiple keywords as well.
For example:
apropos dmesg whereis
Following is the output in this case:
dmesg (1)            - print or control the kernel ring buffer
whereis (1)          - locate the binary, source, and manual page files for a...

Q2. How to make apropos search for exact keywords?

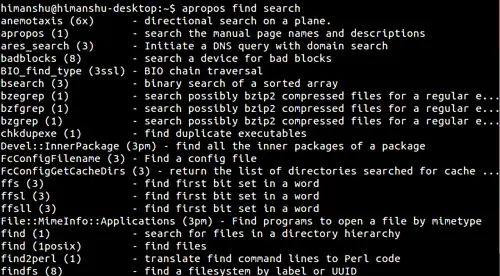
By default, the input you pass to the apropos command isn't searched exactly. For example, if you pass 'who' as an input, you'll also see the tool producing results containing words like 'whoami'.
How to make apropos search for exact keywords
So this isn't an exact search. However, you can force apropos to search for exact keywords by using the -e or --exact command line options.
apropos exact search
So now you see that only those entries that exactly match 'who' were displayed in the output.

Q3. How to make apropos display entries matching all keywords?

If you pass multiple keywords as input to the apropos command, the tool will output entries that match/contain at least one of the keywords. However, if you want apropos to produce only those entries that match/contain all keywords, then use the -a command line option.
For example, here's the output of an apropos command without the -a option:
How to make apropos display entries matching all keywords
And here's the output with -a option enabled:
apropos -a

Q4. How to force apropos to not trim output?

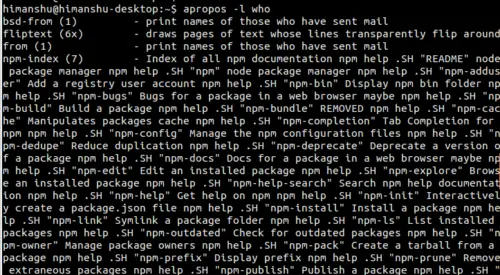
As you'd have seen in output in previous Q&As, the tool trims entries if they are too long. For example, see the highlighted line in the following output:
How to force apropos to not trim output
However, if you want, you can force apropos to produce complete lines in output, something which you can do using the -l command line option.
force apropos to produce complete lines in output

Q5. How to interpret apropos exit status?

The apropos command produces four different exit status: 0, 1, 2, and 16. Here's what each of these represents:
       0      Successful program execution.

       1      Usage, syntax or configuration file error.

       2      Operational error.

       16     Nothing was found that matched the criteria specified

Conclusion

Depending on your work profile, you might not require the apropos command on daily basis, but as you'd have understood by now, it could be a lifesaver in certain situations. We've discussed some use command line options here. To know more about the tool, head to its man page.
Share this page:

Suggested articles

0 Comment(s)

Add comment

Load balancing with HAProxy, Nginx and Keepalived in Linux

$
0
0
https://linuxhandbook.com/load-balancing-setup


Having a proper set up of load balancer allows your web server to handle high traffic smoothly instead of crashing down. In this tutorial, we’ll see how to setup a load balancer with high availability.

What is load balancing?

Load balancing is the process of distributing workloads to multiple servers. It is like distributing workloads between day shift and night shift workers in a company. Load balancing improves the server’s reliability as it overcomes single point failure. An example of How a server without load balancing looks like is shown below.
A single server handling traffic
In this example, if the web server goes down, the user’s web request cannot be accessed in real time. Also if numbers of users request the same web page simultaneously, then serving the user’s web request by a single web server can be a slow process. Hence load balancers are used to enhance the server’s performance, provide backup and prevent failures.
In this tutorial, we are going to set up a load balancer for web server using Nginx, HAProxy and Keepalived. An example of how servers with load balancers look like is shown below.
Using load balance to effectively handle high traffic
Using load balancing to effectively handle high traffic
So, what are Nginx, Haproxy and Keepalived?

Nginx

Nginx, pronounced as Engine-x is an open-source Web server. More than just a Web server, it can operate as a reverse proxy server, mail proxy server, load balancer, lightweight file server and HTTP cache. Nginx has been used in many popular sites like BitBucket, WordPress, Pinterest, Quora and GoDaddy.

HAProxy

HAProxy stands for High Availability Proxy. It is an open source load balancer that provides load balancing, high availability and proxy solutions for TCP and HTTP based applications. It is best suited for distributing the workload across multiple servers for performance improvement and reliability of servers.
The function of Haproxy is to forwards the web request from end-user to one of the available web servers. It can use various load balancing algorithms like Round Robin, Least Connections etc.

Keepalived

What if HAProxy load balancer goes down?
Keepalived is an open-source program that supports both load balancing and high availability. It is basically a routing software and provides two types of load balancing:
  • Layer 4 ( transport layer)
  • Layer 7 ( application layer)
Keepalived can perform the following functions:
Keepalived uses VIP (Virtual IP Address) as a floating IP that floats between a Master load balancer and Backup load balancer and is used to switch between them. If Master load balancer goes down, then backup load balancer is used to forward web request.
Let’s move towards simulation of how high availability and load-balancing is maintained for web servers.

Setting up a load balancer in Linux with Nginx, HAProxy and Keepalived

Setting up load balancer in Linux
This is a test lab experiment meaning it’s just a test setup to get you started. You may have to do some tweaking if you are implementing it on real servers. Use this tutorial as a learning material instead of blindly following it for your own setup.
I have used CentOS Linux distribution in this tutorial. You can use other Linux distributions but I cannot guarantee if all the commands (especially the installation ones) will work in other distributions.

Requirements for load balancer setup

4 CentOS installed systems (minimal installation is enough for this tutorial)
  • 2 CentOS to be set up with nginx
  • 2 CentOS to be set up with HAProxy and Keepalived
In this tutorial, we have worked on the following IP addresses as an example. These can be changed as per your system. Don’t think these are the static IPs.
Web servers:
  • 10.13.211.169
  • 10.13.211.158
LoadBalancer:
  • 10.13.211.194
  • 10.13.211.120
Virtual IP:
  • 10.13.211.10

Step 1: Setup the web servers with Nginx

In this part, we’ll use two CentOS systems as the web server. We need to install Nginx on them first.
For that, add a repository containing nginx and then install it from there:
yum install epel-release
yum install nginx
After installing nginx, start the Nginx service:
systemctl start nginx
Make nginx service to be enabled even after every boot:
systemctl enable nginx
Check the status of nginx service:
systemctl status nginx
Allow the web traffics in nginx that is by default block by CentOS firewall.
firewall-cmd --zone=public --permanent --add-service=http
firewall-cmd --zone=public --permanent --add-service=https
firewall-cmd –reload
Repeat the above steps on the second CentOS web server as well.
Now pay attention to the next steps.
The web files for nginx is located in /usr/share/nginx/html Change the content of index.html file just to identify the webservers.
For the first web server:
echo “this is first webserver” > /usr/share/nginx/html/index.html
For the second web server:
echo “this is second webserver” > /usr/share/nginx/html/index.html
NOTE: If you are on a virtual machine, it is better to install and configure Nginx on one system and then clone the system. Afterward, you can reconfigure on the second system. Saves time and errors.
Now confirm the web server status by going to the following URL in your browser: http://SERVER_DOMAIN_NAME or Local_IP_Address. Example here:
http://10.13.211.169
or in the terminal, curl Local_IP_Address. Example here:
curl 10.13.211.169
You will get the output like:
Nginx web server in CentOS

Step 2: Setup load balancers with HAProxy

On the other two systems, use the following commands to install HAProxy:
yum -y update
yum -y install haproxy
HAProxy configuration file is located at /etc/haproxy. Go to the directory and backup the file before edit.
cd /etc/haproxy/
mv haproxy.cfg haproxy.cfg_bac
Create a new haproxy.cfg file and open the file with any editor you like.
touch haproxy.cfg
vim haproxy.cfg
Now, paste the following lines into the file:
global
log /dev/log local0
log /dev/log local1 notice
chroot /var/lib/haproxy
stats timeout 30s
user haproxy
group haproxy
daemon
defaults
log global
mode http
option httplog
option dontlognull
timeout connect 5000
timeout client 50000
timeout server 50000

#frontend
#---------------------------------
frontend http_front
bind *:80
stats uri /haproxy?stats
default_backend http_back

#round robin balancing backend http
#-----------------------------------
backend http_back
balance roundrobin
#balance leastconn
mode http
server webserver1 10.13.211.169:80 check    # ip_address_of_1st_centos_webserver
server webserver2 10.13.211.158:80 check    # ip_address_of_2nd_centos_webserver
Now, enable and start HAProxy service.
systemctl enable haproxy
systemctl start haproxy
Check the status of HAProxy:
systemctl status haproxy
Go to url in your browser to confirm the service of haproxy: http://load balancer’s IP Address/haproxy?stats. Example used here:
http://10.13.211.194/haproxy?stats
or in the terminal, use command $ curl  LoadBalancer_IP_Address
curl 10.13.211.194
curl 10.13.211.194
curl two times and you will see different outputs for the curl command. It is because of the response is coming from different web servers (one at a time), for your request at the load balancer.
The Output would look like this:
HAProxy in CentOS

Step 3: Set up high availability with Keepalived

Keepalived must be installed to both HAProxy load balancer CentOS systems (which we have just configured above). One acts a master (main load-balancer) and another acts as the backup load-balancer.
On both system, run the following command:
yum install -y keepalived
The configuration file of Keepalived is located at /etc/keepalived/keepalived.conf. Backup the original keepalived.conf file and use the following configuration at new keepalived .conf file.
mv /etc/keepalived/keepalived.conf /etc/keepalived/keepalived.conf_bac
touch /etc/keepalived/keepalived.conf
vim /etc/keepalived/keepalived.conf
Paste the following lines to the configuration file (don’t forget to change the email addresses):
global_defs {
notification_email {
linuxhandbook.com
linuxhandbook@gmail.com
}
notification_email_from thunderdfrost@gmail.com
smtp_server 10.13.211.1
smtp_connect_timeout 30
router_id LVS_DEVEL
}

vrrp_instance VI_1 {
state MASTER
interface eth0 #put your interface name here. [to see interface name: $ ip a ]
virtual_router_id 51
priority 101 # 101 for master. 100 for backup. [priority of master> priority of backup]
advert_int 1
authentication {
auth_type PASS
auth_pass 1111 #password
}
virtual_ipaddress {
10.13.211.10 # use the virtual ip address.
}
}
Note: Virtual IPs can be any live IP inside your network. Near about the range of Loadbalancer’s IP Address. Here, the load balancer’s IP are: 10.13.211.194 & 10.13.211.120, and VIP is 10.13.211.10
Edit the configuration file as per the system assumption. Take care on master and backup configuration. Save the file and start and enable the Keepalived process:
systemctl start keepalived
systemctl enable keepalived
To view the status of Keepalived:
systemctl status keepalived
Note: If you are on a virtual machine, it is better to install and configure Haproxy and Keepalived on one system and then clone the system. Afterward, you can reconfigure on the second system. Saves time and errors.
Now to check the status of your high-availability load-balancer, go to terminal and hit:
$ while true; do ; curl 10.13.211.10 ; sleep 1; done;
Hitctrl+c to stop the terminal run.
The output will look like this:
Keepalived in CentOS Linux
If you feel uncomfortable in installing and configuring the files, download the scripts form my GitHub repository and simply run them.
I hope this tutorial helped you to set up a load balancer in Linux with high availability. Of course, it was a simple setup but it definitely gives an idea about load balancing and handling high availability.
If you have questions or suggestions please leave a comment below.

How to use Ansible to patch systems and install applications

$
0
0
https://opensource.com/article/18/3/ansible-patch-systems

Save time doing updates with the Ansible IT automation engine.

tools_osyearbook2016_sysadmin_cc.png
Image by : 
Opensource.com
x

Get the newsletter

Join the 85,000 open source advocates who receive our giveaway alerts and article roundups.
Have you ever wondered how to patch your systems, reboot, and continue working?
If so, you'll be interested in Ansible, a simple configuration management tool that can make some of the hardest work easy. For example, system administration tasks that can be complicated, take hours to complete, or have complex requirements for security. In my experience, one of the hardest parts of being a sysadmin is patching systems. Every time you get a Common Vulnerabilities and Exposure (CVE) notification or Information Assurance Vulnerability Alert (IAVA) mandated by security, you have to kick into high gear to close the security gaps. (And, believe me, your security officer will hunt you down unless the vulnerabilities are patched.)
Ansible can reduce the time it takes to patch systems by running packaging modules. To demonstrate, let's use the yum module to update the system. Ansible can install, update, remove, or install from another location (e.g., rpmbuild from continuous integration/continuous development). Here is the task for updating the system:


  - name: update the system

    yum:

      name: "*"

      state: latest


In the first line, we give the task a meaningful name so we know what Ansible is doing. In the next line, the yum module updates the CentOS virtual machine (VM), then name: "*" tells yum to update everything, and, finally, state: latest updates to the latest RPM.
After updating the system, we need to restart and reconnect:


  - name: restart system to reboot to newest kernel

    shell: "sleep 5 && reboot"

    async: 1

    poll: 0


  - name: wait for 10 seconds

    pause:

      seconds: 10


  - name: wait for the system to reboot

    wait_for_connection:

      connect_timeout: 20

      sleep: 5

      delay: 5

      timeout: 60


  - name: install epel-release

    yum:

      name: epel-release

      state: latest


The shell module puts the system to sleep for 5 seconds then reboots. We use sleep to prevent the connection from breaking, async to avoid timeout, and poll to fire & forget. We pause for 10 seconds to wait for the VM to come back and use wait_for_connection to connect back to the VM as soon as it can make a connection. Then we install epel-release to test the RPM installation. You can run this playbook multiple times to show the idempotent, and the only task that will show as changed is the reboot since we are using the shell module. You can use changed_when: False to ignore the change when using the shell module if you expect no actual changes.
So far we've learned how to update a system, restart the VM, reconnect, and install a RPM. Next we will install NGINX using the role in Ansible Lightbulb.


  - name: Ensure nginx packages are present

    yum:

      name: nginx, python-pip, python-devel, devel

      state: present

    notify: restart-nginx-service


  - name: Ensure uwsgi package is present

    pip:

      name: uwsgi

      state: present

    notify: restart-nginx-service


  - name: Ensure latest default.conf is present

    template:

      src: templates/nginx.conf.j2

      dest: /etc/nginx/nginx.conf

      backup: yes

    notify: restart-nginx-service


  - name: Ensure latest index.html is present

    template:

      src: templates/index.html.j2

      dest: /usr/share/nginx/html/index.html


  - name: Ensure nginx service is started and enabled

    service:

      name: nginx

      state: started

      enabled: yes


  - name: Ensure proper response from localhost can be received

    uri:

      url: "http://localhost:80/"

      return_content: yes

    register: response

    until: 'nginx_test_message in response.content'

    retries: 10

    delay: 1


And the handler that restarts the nginx service:


# handlers file for nginx-example

  - name: restart-nginx-service

    service:

      name: nginx

      state: restarted


In this role, we install the RPMs nginx, python-pip, python-devel, and devel and install uwsgi with PIP. Next, we use the template module to copy over the nginx.conf and index.html for the page to display. After that, we make sure the service is enabled on boot and started. Then we use the uri module to check the connection to the page.
Here is a playbook showing an example of updating, restarting, and installing an RPM. Then continue installing nginx. This can be done with any other roles/applications you want.


  - hosts: all

    roles:

      - centos-update

      - nginx-simple


Watch this demo video for more insight on the process.
This was just a simple example of how to update, reboot, and continue. For simplicity, I added the packages without variables. Once you start working with a large number of hosts, you will need to change a few settings:
This is because on your production environment you might want to update one system at a time (not fire & forget) and actually wait a longer time for your system to reboot and continue.
For more ways to automate your work with this tool, take a look at the other Ansible articles on Opensource.com.

A sysadmin's guide to Ansible: How to simplify tasks

$
0
0
https://opensource.com/article/18/7/sysadmin-tasks-ansible

There are many ways to automate common sysadmin tasks with Ansible. Here are several of them.

a checklist for a team
Image by : 
opensource.com
x

Get the newsletter

Join the 85,000 open source advocates who receive our giveaway alerts and article roundups.
In my previous article, I discussed how to use Ansible to patch systems and install applications. In this article, I'll show you how to do other things with Ansible that will make your life as a sysadmin easier. First, though, I want to share why I came to Ansible.
I started using Ansible because it made patching systems easier. I could run some ad-hoc commands here and there and some playbooks someone else wrote. I didn't get very in depth, though, because the playbook I was running used a lot of lineinfile modules, and, to be honest, my regex techniques were nonexistent. I was also limited in my capacity due to my management's direction and instructions: "You can run this playbook only and that's all you can do." After leaving that job, I started working on a team where most of the infrastructure was in the cloud. After getting used to the team and learning how everything works, I started trying to find ways to automate more things. We were spending two to three months deploying virtual machines in large numbers—doing all the work manually, including the lifecycle of each virtual machine, from provision to decommission. Our work often got behind schedule, as we spent a lot of time doing maintenance. When folks went on vacation, others had to take over with little knowledge of the tasks they were doing.

Diving deeper into Ansible

Sharing ideas about how to resolve issues is one of the best things we can do in the IT and open source world, so I went looking for help by submitting issues in Ansible and asking questions in roles others created.
Reading the documentation (including the following topics) is the best way to get started learning Ansible.
If you are trying to figure out what you can do with Ansible, take a moment and think about the daily activities you do, the ones that take a lot of time that would be better spent on other things. Here are some examples:
  • Managing accounts in systems: Creating users, adding them to the correct groups, and adding the SSH keys… these are things that used to take me days when we had a large number of systems to build. Even using a shell script, this process was very time-consuming.
  • Maintaining lists of required packages: This could be part of your security posture and include the packages required for your applications.
  • Installing applications: You can use your current documentation and convert application installs into tasks by finding the correct module for the job.
  • Configuring systems and applications: You might want to change /etc/ssh/sshd_config for different environments (e.g., production vs. development) by adding a line or two, or maybe you want a file to look a specific way in every system you're managing.
  • Provisioning a VM in the cloud: This is great when you need to launch a few virtual machines that are similar for your applications and you are tired of using the UI.
Now let's look at how to use Ansible to automate some of these repetitive tasks.

Managing users

If you need to create a large list of users and groups with the users spread among the different groups, you can use loops. Let's start by creating the groups:


- name: create user groups

  group:

    name: "{{ item }}"

  loop:

    - postgresql

    - nginx-test

    - admin

    - dbadmin

    - hadoop


You can create users with specific parameters like this:


- name: all users in the department

  user:

    name:  "{{ item.name }}"

    group: "{{ item.group }}"

    groups: "{{ item.groups }}"

    uid: "{{ item.uid }}"

    state: "{{ item.state }}"

  loop:

    - { name: 'admin1', group: 'admin', groups: 'nginx', uid: '1234', state: 'present' }

    - { name: 'dbadmin1', group: 'dbadmin', groups: 'postgres', uid: '4321', state: 'present' }

    - { name: 'user1', group: 'hadoop', groups: 'wheel', uid: '1067', state: 'present' }

    - { name: 'jose', group: 'admin', groups: 'wheel', uid: '9000', state: 'absent' }


Looking at the user jose, you may recognize that state: 'absent' deletes this user account, and you may be wondering why you need to include all the other parameters when you're just removing him. It's because this is a good place to keep documentation of important changes for audits or security compliance. By storing the roles in Git as your source of truth, you can go back and look at the old versions in Git if you later need to answer questions about why changes were made.
To deploy SSH keys for some of the users, you can use the same type of looping as in the last example.


- name: copy admin1 and dbadmin ssh keys

  authorized_key:

    user: "{{ item.user }}"

    key: "{{ item.key }}"

    state: "{{ item.state }}"

    comment: "{{ item.comment }}"

  loop:

    - { user: 'admin1', key: "{{ lookup('file', '/data/test_temp_key.pub'), state: 'present', comment: 'admin1 key' }

    - { user: 'dbadmin', key: "{{ lookup('file', '/data/vm_temp_key.pub'), state: 'absent', comment: 'dbadmin key' }


Here, we specify the user, how to find the key by using lookup, the state, and a comment describing the purpose of the key.

Installing packages

Package installation can vary depending on the packaging system you are using. You can use Ansible facts to determine which module to use. Ansible does offer a generic module called package that uses ansible_pkg_mgr and calls the proper package manager for the system. For example, if you're using Fedora, the package module will call the DNF package manager.
The package module will work if you're doing a simple installation of packages. If you're doing more complex work, you will have to use the correct module for your system. For example, if you want to ignore GPG keys and install all the security packages on a RHEL-based system, you need to use the yum module. You will have different options depending on your packaging module, but they usually offer more parameters than Ansible's generic package module.
Here is an example using the package module:


  - name: install a package

    package:

      name: nginx

      state: installed


The following uses the yum module to install NGINX, disable gpg_check from the repo, ignore the repository's certificates, and skip any broken packages that might show up.


  - name: install a package

    yum:

      name: nginx

      state: installed

      disable_gpg_check: yes

      validate_certs: no

      skip_broken: yes


Here is an example using Apt. The Apt module tells Ansible to uninstall NGINX and not update the cache:


  - name: install a package

    apt:

      name: nginx

      state: absent

      update_cache: no


You can use loop when installing packages, but they are processed individually if you pass a list:


  - name:

      - nginx

      - postgresql-server

      - ansible

      - httpd


NOTE: Make sure you know the correct name of the package you want in the package manager you're using. Some names change depending on the package manager.

Starting services

Much like packages, Ansible has different modules to start services. Like in our previous example, where we used the package module to do a general installation of packages, the service module does similar work with services, including with systemd and Upstart. (Check the module's documentation for a complete list.) Here is an example:


  - name: start nginx

    service:

      name: nginx

      state: started


You can use Ansible's service module if you are just starting and stopping applications and don't need anything more sophisticated. But, like with the yum module, if you need more options, you will need to use the systemd module. For example, if you modify systemd files, then you need to do a daemon-reload, the service module won't work for that; you will have to use the systemd module.


  - name: reload postgresql for new configuration and reload daemon

    systemd:

      name: postgresql

      state: reload

      daemon-reload: yes


This is a great starting point, but it can become cumbersome because the service will always reload/restart. This a good place to use a handler.
If you used best practices and created your role using ansible-galaxy init "role name", then you should have the full directory structure. You can include the code above inside the handlers/main.yml and call it when you make a change with the application. For example:


handlers/main.yml


  - name: reload postgresql for new configuration and reload daemon

    systemd:

      name: postgresql

      state: reload

      daemon-reload: yes


This is the task that calls the handler:


  - name: configure postgresql

    template:

      src: postgresql.service.j2

      dest: /usr/lib/systemd/system/postgresql.service

    notify: reload postgresql for new configuration and reload daemon


It configures PostgreSQL by changing the systemd file, but instead of defining the restart in the tasks (like before), it calls the handler to do the restart at the end of the run. This is a good way to configure your application and keep it idempotent since the handler only runs when a task changes—not in the middle of your configuration.
The previous example uses the template module and a Jinja2 file. One of the most wonderful things about configuring applications with Ansible is using templates. You can configure a whole file like postgresql.service with the full configuration you require. But, instead of changing every line, you can use variables and define the options somewhere else. This will let you change any variable at any time and be more versatile. For example:


[database]

DB_TYPE  = "{{ gitea_db }}"

HOST     = "{{ ansible_fqdn}}:3306"

NAME     = gitea

USER     = gitea

PASSWD   = "{{ gitea_db_passwd }}"

SSL_MODE = disable

PATH     = "{{ gitea_db_dir }}/gitea.db


This configures the database options on the file app.ini for Gitea. This is similar to writing Ansible tasks, even though it is a configuration file, and makes it easy to define variables and make changes. This can be expanded further if you are using group_vars, which allows you to define variables for all systems and specific groups (e.g., production vs. development). This makes it easier to manage variables, and you don't have to specify the same ones in every role.

Provisioning a system

We've gone over several things you can do with Ansible on your system, but we haven't yet discussed how to provision a system. Here's an example of provisioning a virtual machine (VM) with the OpenStack cloud solution.


  - name: create a VM in openstack

    osp_server:

      name: cloudera-namenode

      state: present

      cloud: openstack

      region_name: andromeda

      image: 923569a-c777-4g52-t3y9-cxvhl86zx345

      flavor_ram: 20146

      flavor: big

      auto_ip: yes

      volumes: cloudera-namenode


All OpenStack modules start with os, which makes it easier to find them. The above configuration uses the osp-server module, which lets you add or remove an instance. It includes the name of the VM, its state, its cloud options, and how it authenticates to the API. More information about cloud.yml is available in the OpenStack docs, but if you don't want to use cloud.yml, you can use a dictionary that lists your credentials using the auth option. If you want to delete the VM, just change state: to absent.
Say you have a list of servers you shut down because you couldn't figure out how to get the applications working, and you want to start them again. You can use os_server_action to restart them (or rebuild them if you want to start from scratch).
Here is an example that starts the server and tells the modules the name of the instance:


  - name: restart some servers

    os_server_action:

      action: start

      cloud: openstack

      region_name: andromeda

      server: cloudera-namenode


Most OpenStack modules use similar options. Therefore, to rebuild the server, we can use the same options but change the action to rebuild and add the image we want it to use:


  os_server_action:

    action: rebuild

    image: 923569a-c777-4g52-t3y9-cxvhl86zx345


Doing other things

There are modules for a lot of system admin tasks, but what should you do if there isn't one for what you are trying to do? Use the shell and command modules, which allow you to run any command just like you do on the command line. Here's an example using the OpenStack CLI:


  - name: run an opencli command

    command: "openstack hypervisor list"


They are so many ways you can do daily sysadmin tasks with Ansible. Using this automation tool can transform your hardest task into a simple solution, save you time, and make your work days shorter and more relaxed.

Textricator: Data extraction made simple

$
0
0
https://opensource.com/article/18/7/textricator

New open source tool extracts complex data from PDF docs, no programming skills required.

cutting through lock-in
Image by : 
opensource.com
x

Get the newsletter

Join the 85,000 open source advocates who receive our giveaway alerts and article roundups.
You probably know the feeling: You ask for data and get a positive response, only to open the email and find a whole bunch of PDFs attached. Data, interrupted.
We understand your frustration, and we’ve done something about it: Introducing Textricator, our first open source product.
We’re Measures for Justice, a criminal justice research and transparency organization. Our mission is to provide data transparency for the entire justice system, from arrest to post-conviction. We do this by producing a series of up to 32 performance measures covering the entire criminal justice system, county by county. We get our data in many ways—all legal, of course—and while many state and county agencies are data-savvy, giving us quality, formatted data in CSVs, the data is often bundled inside software with no simple way to get it out. PDF reports are the best they can offer.
Developers Joe Hale and Stephen Byrne have spent the past two years developing Textricator to extract tens of thousands of pages of data for our internal use. Textricator can process just about any text-based PDF format—not just tables, but complex reports with wrapping text and detail sections generated from tools like Crystal Reports. Simply tell Textricator the attributes of the fields you want to collect, and it chomps through the document, collecting and writing out your records.
Not a software engineer? Textricator doesn’t require programming skills; rather, the user describes the structure of the PDF and Textricator handles the rest. Most users run it via the command line; however, a browser-based GUI is available.
We evaluated other great open source solutions like Tabula, but they just couldn’t handle the structure of some of the PDFs we needed to scrape. “Textricator is both flexible and powerful and has cut the time we spend to process large datasets from days to hours,” says Andrew Branch, director of technology.
At MFJ, we’re committed to transparency and knowledge-sharing, which includes making our software available to anyone, especially those trying to free and share data publicly. Textricator is available on GitHub and released under GNU Affero General Public License Version 3.
You can see the results of our work, including data processed via Textricator, on our free online data portal. Textricator is an essential part of our process and we hope civic tech and government organizations alike can unlock more data with this new tool.
If you use Textricator, let us know how it helped solve your data problem. Want to improve it? Submit a pull request.

Building a network attached storage device with a Raspberry Pi

$
0
0
https://opensource.com/article/18/7/network-attached-storage-Raspberry-Pi

Follow these step-by-step instructions to build your own Raspberry Pi-based network attached storage system.

storage facility
Image by : 
Scott Meyers. Modified by Opensource.com. CC BY-SA 2.0.
x

Get the newsletter

Join the 85,000 open source advocates who receive our giveaway alerts and article roundups.
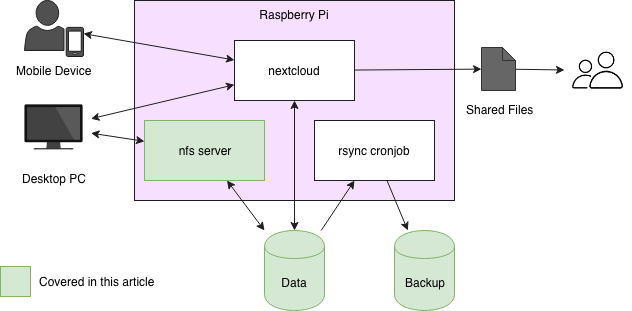
In this three-part series, I'll explain how to set up a simple, useful NAS (network attached storage) system. I use this kind of setup to store my files on a central system, creating incremental backups automatically every night. To mount the disk on devices that are located in the same network, NFS is installed. To access files offline and share them with friends, I use Nextcloud.
This article will cover the basic setup of software and hardware to mount the data disk on a remote device. In the second article, I will discuss a backup strategy and set up a cron job to create daily backups. In the third and last article, we will install Nextcloud, a tool for easy file access to devices synced offline as well as online using a web interface. It supports multiple users and public file-sharing so you can share pictures with friends, for example, by sending a password-protected link.
The target architecture of our system looks like this:

Hardware

Let's get started with the hardware you need. You might come up with a different shopping list, so consider this one an example.
The computing power is delivered by a Raspberry Pi 3, which comes with a quad-core CPU, a gigabyte of RAM, and (somewhat) fast ethernet. Data will be stored on two USB hard drives (I use 1-TB disks); one is used for the everyday traffic, the other is used to store backups. Be sure to use either active USB hard drives or a USB hub with an additional power supply, as the Raspberry Pi will not be able to power two USB drives.

Software

The operating system with the highest visibility in the community is Raspbian, which is excellent for custom projects. There are plenty of guides that explain how to install Raspbian on a Raspberry Pi, so I won't go into details here. The latest official supported version at the time of this writing is Raspbian Stretch, which worked fine for me. At this point, I will assume you have configured your basic Raspbian and are able to connect to the Raspberry Pi by ssh.

Prepare the USB drives

To achieve good performance reading from and writing to the USB hard drives, I recommend formatting them with ext4. To do so, you must first find out which disks are attached to the Raspberry Pi. You can find the disk devices in /dev/sd/. Using the command fdisk -l, you can find out which two USB drives you just attached. Please note that all data on the USB drives will be lost as soon as you follow these steps.


pi@raspberrypi:~ $ sudofdisk-l


<...>


Disk /dev/sda: 931.5 GiB, 1000204886016 bytes, 1953525168 sectors

Units: sectors of 1*512 = 512 bytes

Sector size(logical/physical): 512 bytes /512 bytes

I/O size(minimum/optimal): 512 bytes /512 bytes

Disklabel type: dos

Disk identifier: 0xe8900690


Device     Boot Start        End    Sectors   Size Id Type

/dev/sda1        204819535251671953523120 931.5G 83 Linux


Disk /dev/sdb: 931.5 GiB, 1000204886016 bytes, 1953525168 sectors

Units: sectors of 1*512 = 512 bytes

Sector size(logical/physical): 512 bytes /512 bytes

I/O size(minimum/optimal): 512 bytes /512 bytes

Disklabel type: dos

Disk identifier: 0x6aa4f598


Device     Boot Start        End    Sectors   Size Id Type

/dev/sdb1  *    204819535216631953519616 931.5G  83 Linux


As those devices are the only 1TB disks attached to the Raspberry Pi, we can easily see that /dev/sda and /dev/sdb are the two USB drives. The partition table at the end of each disk shows how it should look after the following steps, which create the partition table and format the disks. To do this, repeat the following steps for each of the two devices by replacing sda with sdb the second time (assuming your devices are also listed as /dev/sda and /dev/sdb in fdisk).
First, delete the partition table of the disk and create a new one containing only one partition. In fdisk, you can use interactive one-letter commands to tell the program what to do. Simply insert them after the prompt Command (m for help): as follows (you can also use the m command anytime to get more information):


pi@raspberrypi:~ $ sudofdisk/dev/sda


Welcome to fdisk(util-linux 2.29.2).

Changes will remain in memory only, until you decide to write them.

Be careful before using the write command.


Command (m forhelp): o

Created a new DOS disklabel with disk identifier 0x9c310964.


Command (m forhelp): n

Partition type

   p   primary (0 primary, 0 extended, 4free)

   e   extended (container for logical partitions)

Select (default p): p

Partition number (1-4, default 1):

First sector (2048-1953525167, default 2048):

Last sector, +sectors or +size{K,M,G,T,P}(2048-1953525167, default 1953525167):


Created a new partition 1 of type'Linux' and of size931.5 GiB.


Command (m forhelp): p


Disk /dev/sda: 931.5 GiB, 1000204886016 bytes, 1953525168 sectors

Units: sectors of 1*512 = 512 bytes

Sector size(logical/physical): 512 bytes /512 bytes

I/O size(minimum/optimal): 512 bytes /512 bytes

Disklabel type: dos

Disk identifier: 0x9c310964


Device     Boot Start        End    Sectors   Size Id Type

/dev/sda1        204819535251671953523120 931.5G 83 Linux


Command (m forhelp): w

The partition table has been altered.

Syncing disks.


Now we will format the newly created partition /dev/sda1 using the ext4 filesystem:


pi@raspberrypi:~ $ sudo mkfs.ext4 /dev/sda1

mke2fs 1.43.4 (31-Jan-2017)

Discarding device blocks: done


<...>


Allocating group tables: done

Writing inode tables: done

Creating journal (1024 blocks): done

Writing superblocks and filesystem accounting information: done


After repeating the above steps, let's label the new partitions according to their usage in your system:


pi@raspberrypi:~ $ sudo e2label /dev/sda1 data

pi@raspberrypi:~ $ sudo e2label /dev/sdb1 backup


Now let's get those disks mounted to store some data. My experience, based on running this setup for over a year now, is that USB drives are not always available to get mounted when the Raspberry Pi boots up (for example, after a power outage), so I recommend using autofs to mount them when needed.
First install autofs and create the mount point for the storage:


pi@raspberrypi:~ $ sudo apt install autofs

pi@raspberrypi:~ $ sudomkdir/nas


Then mount the devices by adding the following line to /etc/auto.master:
/nas    /etc/auto.usb
Create the file /etc/auto.usb if not existing with the following content, and restart the autofs service:


data -fstype=ext4,rw :/dev/disk/by-label/data

backup -fstype=ext4,rw :/dev/disk/by-label/backup


pi@raspberrypi3:~ $ sudo service autofs restart
Now you should be able to access the disks at /nas/data and /nas/backup, respectively. Clearly, the content will not be too thrilling, as you just erased all the data from the disks. Nevertheless, you should be able to verify the devices are mounted by executing the following commands:


pi@raspberrypi3:~ $ cd/nas/data

pi@raspberrypi3:/nas/data $ cd/nas/backup

pi@raspberrypi3:/nas/backup $ mount

<...>

/etc/auto.usb on /nas type autofs (rw,relatime,fd=6,pgrp=463,timeout=300,minproto=5,maxproto=5,indirect)

<...>

/dev/sda1 on /nas/data type ext4 (rw,relatime,data=ordered)

/dev/sdb1 on /nas/backup type ext4 (rw,relatime,data=ordered)


First move into the directories to make sure autofs mounts the devices. Autofs tracks access to the filesystems and mounts the needed devices on the go. Then the mount command shows that the two devices are actually mounted where we wanted them.
Setting up autofs is a bit fault-prone, so do not get frustrated if mounting doesn't work on the first try. Give it another chance, search for more detailed resources (there is plenty of documentation online), or leave a comment.

Mount network storage

Now that you have set up the basic network storage, we want it to be mounted on a remote Linux machine. We will use the network file system (NFS) for this. First, install the NFS server on the Raspberry Pi:
pi@raspberrypi:~ $ sudo apt install nfs-kernel-server
Next we need to tell the NFS server to expose the /nas/data directory, which will be the only device accessible from outside the Raspberry Pi (the other one will be used for backups only). To export the directory, edit the file /etc/exports and add the following line to allow all devices with access to the NAS to mount your storage:
/nas/data *(rw,sync,no_subtree_check)
For more information about restricting the mount to single devices and so on, refer to man exports. In the configuration above, anyone will be able to mount your data as long as they have access to the ports needed by NFS: 111 and 2049. I use the configuration above and allow access to my home network only for ports 22 and 443 using the routers firewall. That way, only devices in the home network can reach the NFS server.
To mount the storage on a Linux computer, run the commands:


you@desktop:~ $ sudomkdir/nas/data

you@desktop:~ $ sudomount-t nfs <raspberry-pi-hostname-or-ip>:/nas/data /nas/data


Again, I recommend using autofs to mount this network device. For extra help, check out How to use autofs to mount NFS shares.
Now you are able to access files stored on your own RaspberryPi-powered NAS from remote devices using the NFS mount. In the next part of this series, I will cover how to automatically back up your data to the second hard drive using rsync. To save space on the device while still doing daily backups, you will learn how to create incremental backups with rsync.

How To Mount Google Drive Locally As Virtual File System In Linux

$
0
0
https://www.ostechnix.com/how-to-mount-google-drive-locally-as-virtual-file-system-in-linux

Mount Google Drive Locally As Virtual File System In Linux
Google Drive is the one of the popular cloud storage provider on the planet. As of 2017, over 800 million users are actively using this service worldwide. Even though the number of users have dramatically increased, Google haven’t released a Google drive client for Linux yet. But it didn’t stop the Linux community. Every now and then, some developers had brought few google drive clients for Linux operating system. In this guide, we will see three unofficial google drive clients for Linux. Using these clients, you can mount Google drive locally as a virtual file system and access your drive files in your Linux box. Read on.

1. Google-drive-ocamlfuse

The google-drive-ocamlfuse is a FUSE filesystem for Google Drive, written in OCaml. For those wondering, FUSE, stands for Filesystem in Userspace, is a project that allows the users to create virtual file systems in user level. google-drive-ocamlfuse allows you to mount your Google Drive on Linux system. It features read/write access to ordinary files and folders, read-only access to Google docks, sheets, and slides, support for multiple google drive accounts, duplicate file handling, access to your drive trash directory, and more.

Installing google-drive-ocamlfuse

google-drive-ocamlfuse is available in the AUR, so you can install it using any AUR helper programs, for example Yay.
$ yay -S google-drive-ocamlfuse
On Ubuntu:
$ sudo add-apt-repository ppa:alessandro-strada/ppa
$ sudo apt-get update
$ sudo apt-get install google-drive-ocamlfuse
To install latest beta version, do:
$ sudo add-apt-repository ppa:alessandro-strada/google-drive-ocamlfuse-beta
$ sudo apt-get update
$ sudo apt-get install google-drive-ocamlfuse

Usage

Once installed, run the following command to launch google-drive-ocamlfuse utility from your Terminal:
$ google-drive-ocamlfuse
When you run this first time, the utility will open your web browser and ask your permission to authorize your google drive files. Once you gave authorization, all necessary config files and folders it needs to mount your google drive will be automatically created.

After successful authentication, you will see the following message in your Terminal.
Access token retrieved correctly.
You’re good to go now. Close the web browser and then create a mount point to mount your google drive files.
$ mkdir ~/mygoogledrive
Finally, mount your google drive using command:
$ google-drive-ocamlfuse ~/mygoogledrive
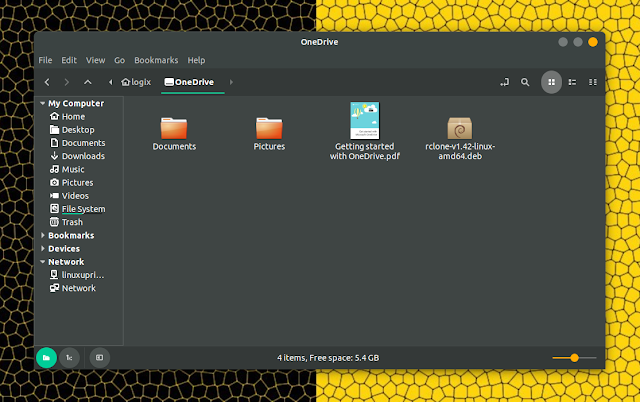
Congratulations! You can access access your files either from Terminal or file manager.
From Terminal:
$ ls ~/mygoogledrive
From File manager:

If you have more than one account, use label option to distinguish different accounts like below.
$ google-drive-ocamlfuse -label label [mountpoint]
Once you’re done, unmount the FUSE flesystem using command:
$ fusermount -u ~/mygoogledrive
For more details, refer man pages.
$ google-drive-ocamlfuse --help
Also, do check the official wiki and the project GitHub repository for more details.

2. GCSF

GCSF is a FUSE filesystem based on Google Drive, written using Rust programming language. The name GCSF has come from the Romanian word “Google Conduce Sistem de Fișiere”, which means “Google Drive Filesystem” in English. Using GCSF, you can mount your Google drive as a local virtual file system and access the contents from the Terminal or file manager. You might wonder how it differ from other Google Drive FUSE projects, for example google-drive-ocamlfuse. The developer of GCSF replied to a similar comment on RedditGCSF tends to be faster in several cases (listing files recursively, reading large files from Drive). The caching strategy it uses also leads to very fast reads (x4-7 improvement compared to google-drive-ocamlfuse) for files that have been cached, at the cost of using more RAM“.

Installing GCSF

GCSF is available in the AUR, so the Arch Linux users can install it using any AUR helper, for example Yay.
$ yay -S gcsf-git
For other distributions, do the following.
Make sure you have installed Rust on your system.
Make sure pkg-config and the fuse packages are installed. They are available in the default repositories of most Linux distributions. For example, on Ubuntu and derivatives, you can install them using command:
$ sudo apt-get install -y libfuse-dev pkg-config
Once all dependencies installed, run the following command to install GCSF:
$ cargo install gcsf

Usage

First, we need to authorize our google drive. To do so, simply run:
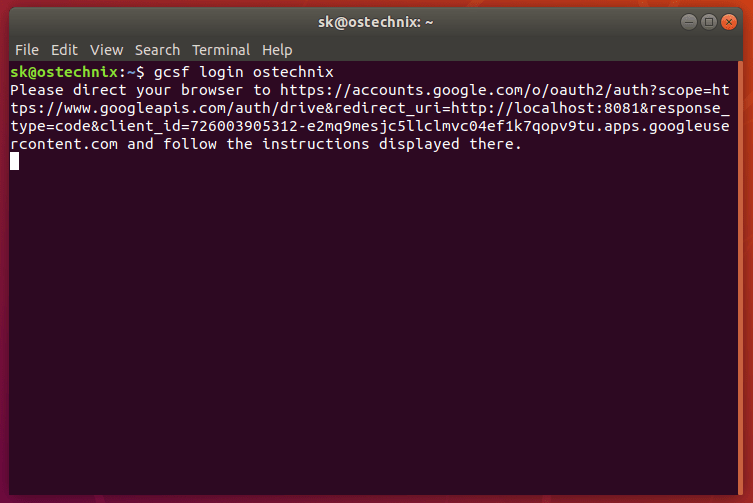
$ gcsf login ostechnix
You must specify a session name. Replace ostechnix with your own session name. You will see an output something like below with an URL to authorize your google drive account.

Just copy and navigate to the above URL from your browser and click allow to give permission to access your google drive contents. Once you gave the authentication you will see an output like below.
Successfully logged in. Credentials saved to "/home/sk/.config/gcsf/ostechnix".
GCSF will create a configuration file in $XDG_CONFIG_HOME/gcsf/gcsf.toml, which is usually defined as $HOME/.config/gcsf/gcsf.toml. Credentials are stored in the same directory.
Next, create a directory to mount your google drive contents.
$ mkdir ~/mygoogledrive
Then, edit /etc/fuse.conf file:
$ sudo vi /etc/fuse.conf
Uncomment the following line to allow non-root users to specify the allow_other or allow_root mount options.
user_allow_other
Save and close the file.
Finally, mount your google drive using command:
$ gcsf mount ~/mygoogledrive -s ostechnix
Sample output:
INFO gcsf > Creating and populating file system...
INFO gcsf > File sytem created.
INFO gcsf > Mounting to /home/sk/mygoogledrive
INFO gcsf > Mounted to /home/sk/mygoogledrive
INFO gcsf::gcsf::file_manager > Checking for changes and possibly applying them.
Again, replace ostechnix with your session name. You can view the existing sessions using command:
$ gcsf list
Sessions:
- ostechnix
You can now access your google drive contents either from the Terminal or from File manager.
From Terminal:
$ ls ~/mygoogledrive
From File manager:

If you don’t know where your Google drive is mounted, use df or mount command as shown below.
$ df -h
Filesystem Size Used Avail Use% Mounted on
udev 968M 0 968M 0% /dev
tmpfs 200M 1.6M 198M 1% /run
/dev/sda1 20G 7.5G 12G 41% /
tmpfs 997M 0 997M 0% /dev/shm
tmpfs 5.0M 4.0K 5.0M 1% /run/lock
tmpfs 997M 0 997M 0% /sys/fs/cgroup
tmpfs 200M 40K 200M 1% /run/user/1000
GCSF 15G 857M 15G 6% /home/sk/mygoogledrive
$ mount | grep GCSF
GCSF on /home/sk/mygoogledrive type fuse (rw,nosuid,nodev,relatime,user_id=1000,group_id=1000,allow_other)
Once done, unmount the google drive using command:
$ fusermount -u ~/mygoogledrive
Check the GCSF GitHub repository for more details.

3. Tuxdrive

Tuxdrive is yet another unofficial google drive client for Linux. We have written a detailed guide about Tuxdrive a while ago. Please check the following link.
Of course, there were few other unofficial google drive clients available in the past, such as Grive2, Syncdrive. But it seems that they are discontinued now. I will keep updating this list when I come across any active google drive clients.
And, that’s all for now, folks. Hope this was useful. More good stuffs to come. Stay tuned!
Cheers!

Examining Linux system performance with dstat

$
0
0
https://www.networkworld.com/article/3291616/linux/examining-linux-system-performance-with-dstat.html

Dstat provides valuable insights into Linux system performance, pretty much replacing older tools, such as vmstat, netstat, iostat, and ifstat.

Examining Linux system performance with dstat
Sandra Henry-Stocker
Want to do a quick performance check on your Linux system? You might want to take a look at the dstat command. Dstat provides valuable insights into Linux system performance, pretty much replacing a collection of older tools such as vmstat, netstat, iostat, and ifstat with a flexible and powerful command that combines their features.
With this one command, you can look at virtual memory, network connections and interfaces, CPU activity, input/output devices and more. In today's post, we'll examine some dstat commands and see what they can show you about your systems.

Dstat options and defaults

First, let's start with a fairly simple command. With the dstat -c (CPU) option, dstat displays CPU stats. In the example below, we're asking for two-second intervals and six reports.
$ dstat -c 2 6
--total-cpu-usage--
usr sys idl wai stl
1 3 96 0 0
33 67 0 0 0
34 66 0 0 0
35 66 0 0 0
37 63 0 0 0
36 64 0 0 0
Note that the first line of data in this report, which looks very different than the others, gives you the averages since the system was last booted and is returned immediately regardless of the specified interval. In this example, we see that the system on average has been largely idle (96%), but is now quite busy working between user and system processing tasks.
If you don't supply any options with dstat, the command will use a default set (-cdngy) set of options. These include:
  • c -- cpu
  • d -- disk
  • n -- network
  • g -- paging stats
  • y -- system stats
The output of this command will look something like what you see below.
$ dstat 2 10
You did not select any stats, using -cdngy by default.
--total-cpu-usage-- -dsk/total- -net/total- ---paging-- ---system--
usr sys idl wai stl| read writ| recv send| in out | int csw
1 2 96 0 0|5568B 4040B| 0 0 | 0 0 | 58 63
34 66 0 0 0| 0 0 | 174B 700B| 0 0 | 679 371
34 66 0 0 0| 0 0 | 174B 407B| 0 0 | 680 377
36 64 0 0 0| 0 0 | 64B 407B| 0 0 | 678 430
35 65 0 0 0| 0 0 | 283B 407B| 0 0 | 680 374
32 68 0 0 0| 0 0 | 238B 407B| 0 0 | 679 376
33 67 0 0 0| 0 0 | 128B 407B| 0 0 | 680 374
32 68 0 0 0| 0 0 | 251B 407B| 0 0 | 679 374
33 67 0 0 0| 0 0 | 238B 407B| 0 0 | 676 376
34 66 0 0 0| 0 0 | 173B 407B| 0 0 | 680 372
You probably noticed the "You did not select any stats" message near the top of the output displayed above. To overcome this with little effort, simply add the -a option. It will select the default options and omit the warning message.
$ dstat -a 2 5
--total-cpu-usage-- -dsk/total- -net/total- ---paging-- ---system--
usr sys idl wai stl| read writ| recv send| in out | int csw
4 10 86 0 0|5921B 12k| 0 0 | 0 0 | 127 99
15 35 50 0 0| 0 0 | 302B 838B| 0 0 | 369 220
15 35 50 0 0| 0 14k| 96B 407B| 0 0 | 365 216
15 35 50 0 0| 0 0 | 246B 407B| 0 0 | 372 229
18 32 50 0 0| 0 0 | 286B 407B| 0 0 | 359 208
In this "no options" approach, you can still set the timing for each interval in seconds and the number of intervals you want to see reported. If you don't specify the number of intervals, the command will continue running until you stop it with a ^c.

What does this tell you?

In the output shown above, we saw evidence that the system being queried was fairly busy. No idle time was being reported; the CPU was spending all of its time between user and system tasks. Compare this with report, which shows the system is idle half the time.
$ dstat -a 2
--total-cpu-usage-- -dsk/total- -net/total- ---paging-- ---system--
usr sys idl wai stl| read writ| recv send| in out | int csw
2 4 94 0 0|7024B 5297B| 0 0 | 0 0 | 72 70
14 36 50 0 0| 0 0 | 160B 809B| 0 0 | 381 229
15 35 50 0 0| 0 0 | 238B 407B| 0 0 | 375 215
16 34 50 0 0| 0 0 | 128B 346B| 0 0 | 369 204
The disks, on the other hand, are not busy at all with zero reads and writes.
One key to becoming adept at evaluating system performance is to run commands like these periodically — even when you don't see the need to question how well a system is running. If  you come to know what normal performance looks like for a server, you will have a much easier time spotting problems.
Here's another example, this one with some disk activity:
$ dstat -a 2 5
--total-cpu-usage-- -dsk/total- -net/total- ---paging-- ---system--
usr sys idl wai stl| read writ| recv send| in out | int csw
3 6 92 0 0|6631B 5133B| 0 0 | 0 0 | 89 79
16 34 50 0 0| 0 16k| 270B 809B| 0 0 | 384 256
16 34 50 0 0| 0 0 | 141B 407B| 0 0 | 358 207
16 34 50 0 0| 0 0 | 238B 407B| 0 0 | 364 222
15 35 50 0 0|2048B 18k| 350B 415B| 0 0 | 379 253
In all these samples, we're not seeing any paging (loading executable images into a process's virtual memory) activity. There is a fairly constant amount of interrupts and context switching going on, but the numbers are all quite modest.
In the command below, we're looking at a memory usage report. Notice the amount of free memory compared to the memory in use. This system is not being challenged.
$ dstat -m 2 3
------memory-usage-----
used free buff cach
372M 4659M 145M 681M
373M 4659M 145M 681M
In the next command, we're looking at an advanced memory usage report. Some additional memory statistics are provided.
$ dstat --mem-adv
-------------advanced-memory-usage-------------
total used free buff cach dirty shmem recl
5960M 372M 4660M 144M 681M 0 1616k 104M
5960M 372M 4660M 144M 681M 0 1616k 104M^C
In this next command, we're looking at open files and inodes in use.
$ dstat --fs
--filesystem-
files inodes
4704 73925
4704 73925
4704 73925
4704 73925 ^C
In this last example, we're generating the standard report, but adding one thing. We're also writing the report to a .csv file so that it can be used in other tools such as Excel.
$ dstat --output /tmp/stats.csv -a 2 5
--total-cpu-usage-- -dsk/total- -net/total- ---paging-- ---system--
usr sys idl wai stl| read writ| recv send| in out | int csw
4 10 86 0 0|5918B 12k| 0 0 | 0 0 | 128 99
18 32 50 0 0| 0 0 | 504B 923B| 0 0 | 377 237
19 31 50 0 0| 0 0 | 355B 407B| 0 0 | 368 224
15 36 50 0 0| 0 14k| 160B 407B| 0 0 | 372 227
18 32 50 0 0| 0 0 | 270B 407B| 0 0 | 366 221
Here's what the csv file looks like:
$ cat /tmp/stats.csv
"Dstat 0.7.3 CSV output"
"Author:","Dag Wieers >dag@wieers.com<",,,,"URL:","http://dag.wieers.com/home-made/dstat/"
"Host:","butterfly",,,,"User:","shs"
"Cmdline:","dstat --output /tmp/stats.csv -a 2 5",,,,"Date:","19 Jul 2018 20:28:25 EDT"
"total cpu usage",,,,,"dsk/total",,"net/total",,"paging",,"system",
"usr","sys","idl","wai","stl","read","writ","recv","send","in","out","int","csw"
4.131,9.601,86.212,0.055,0,5918.044,12484.484,0,0,0,0,127.596,98.667
18.250,32,49.750,0,0,0,0,503.500,923,0,0,377,236.500
18.703,31.172,49.875,0.249,0,0,0,355,407,0,0,368,223.500
14.750,35.500,49.750,0,0,0,14336,160,407,0,0,371.500,227
18.454,31.671,49.875,0,0,0,0,269.500,407,0,0,365.500,220.500

What is dstat?

As mentioned, dstat is a great tool for looking at just about all aspects of system performance. But another answer to this question is that it's a Python script and one you're free to peruse if you'd like to see how it works.
$ which dstat
/usr/bin/dstat
$ file /usr/bin/dstat
/usr/bin/dstat: Python script, ASCII text executable
$ more /usr/bin/dstat | head -6
#!/usr/bin/env python2

### This program is free software; you can redistribute it and/or
### modify it under the terms of the GNU General Public License
### as published by the Free Software Foundation; either version 2
### of the License, or (at your option) any later version.
Join the Network World communities on Facebook and LinkedIn to comment on topics that are top of mind.

How to Set Up a Firewall with FirewallD on CentOS 7

$
0
0
https://linuxize.com/post/how-to-setup-a-firewall-with-firewalld-on-centos-7
How to Set Up a Firewall with FirewallD on CentOS 7
FirewallD is a complete firewall solution that manages the system’s iptables rules and provides a D-Bus interface for operating on them. Starting with CentOS 7, FirewallD replaces iptables as the default firewall management tool.
In this tutorial, we show you how to set up a firewall with FirewallD on your CentOS 7 system and explain you the basic FirewallD concepts.

Prerequisites

Before you start with this tutorial, make sure you are logged into your server with a user account with sudo privileges or with the root user. The best practice is to run administrative commands as a sudo user instead of root, if you don’t have a sudo user on your CentOS system you can create one by following these instructions.

Basic Firewalld Concepts

FirewallD uses the concepts of zones and services, instead of iptables chain and rules. Based on the zones and services you’ll configure, you can control what traffic is allowed or disallowed to and from the system.
FirewallD can be configured and managed using the firewall-cmd command line utility.

Firewalld Zones

Zones are predefined sets of rules specifying what traffic should be allowed based on the level of trust on the networks your computer is connected to. You can assign network interfaces and sources to a zone.
Bellow are the zones provided by FirewallD ordered according to the trust level of the zone from untrusted to trusted:
  • drop: All incoming connections are dropped without any notification. Only outgoing connections are allowed.
  • block: All incoming connections are rejected with an icmp-host-prohibited message for IPv4 and icmp6-adm-prohibited for IPv6n. Only outgoing connections are allowed.
  • public: For use in untrusted public areas. You do not trust other computers on the network but you can allow selected incoming connections.
  • external: For use on external networks with NAT masquerading enabled when your system acts as a gateway or router. Only selected incoming connections are allowed.
  • internal: For use on internal networks when your system acts as a gateway or router. Other systems on the network are generally trusted. Only selected incoming connections are allowed.
  • dmz: Used for computers located in your demilitarized zone that will have limited access to the rest of your network. Only selected incoming connections are allowed.
  • work: Used for work machines. Other computers on the network are generally trusted. Only selected incoming connections are allowed.
  • home: Used for home machines. Other computers on the network are generally trusted. Only selected incoming connections are allowed.
  • trusted: All network connections are accepted. Trust all of the computers in the network.

Firewall services

Firewalld services are predefined rules that apply within a zone and define the necessary settings to allow incoming traffic for a specific service.

Firewalld Runtime and Permanent Settings

Firewalld uses two separated configuration sets, runtime and the permanent configuration.
The runtime configuration is the actual running configuration and it is not persistent on reboots. When the Firewalld service starts it loads the permanent configuration which becomes the runtime configuration.
By default, when making changes to the Firewalld configuration using the firewall-cmd utility the changes are applied to the runtime configuration, to make the changes permanent you need to use the --permanent flag.

Installing and Enabling FirewallD

  1. Installing FirewallD
    Firewalld is installed by default on CentOS 7, but if it is not installed on your system, you can install the package by typing:
    sudo yum install firewalld
    Copy
  2. Check the firewall status.
    Firewalld service is disabled by default. You can check the firewall status with:
    sudo firewall-cmd --state
    Copy
    If you just installed or never activated before, the command will print not running otherwise you will see running.
  3. Enabling FirewallD
    To start the FirewallD service and enable it on boot type:
    sudo systemctl start firewalld
    sudo systemctl enable firewalld
    Copy

Working with Firewalld Zones

After enabling the FirewallD service for the first time, the public zone is set as a default zone. You can view the default zone by typing:
sudo firewall-cmd --get-default-zone
Copy
public
Copy
To get a list of all available zones, type:
sudo firewall-cmd --get-zones
Copy
block dmz drop external home internal public trusted work
Copy
By default, all network interfaces are assigned the default zone. To check what zones are used by your network interface(s) type:
sudo firewall-cmd --get-active-zones
Copy
public
interfaces: eth0 eth1
Copy
The output above tell us that the both interfaces eth0 and eth1 are assigned to the public zone.
You can print the zone configuration settings with:
sudo firewall-cmd --zone=public --list-all
Copy
public (active)
target: default
icmp-block-inversion: no
interfaces: eth0 eth1
sources:
services: ssh dhcpv6-client
ports:
protocols:
masquerade: no
forward-ports:
source-ports:
icmp-blocks:
rich rules:
Copy
From the output above, we can see that the public zone is active and set as default, used by both eth0 and eth1 interfaces Also the connections related to the DHCP client and SSH are allowed.
If you want to check the configurations of all available zones type:
sudo firewall-cmd --list-all-zones
Copy
The command will print a huge list will the settings of all available zone.

Changing the Zone of an Interface

You can easily change the Interface Zone by using the using --zone flag in combination with the --change-interface flag. The following command will assign the eth1 interface to the work zone :
sudo firewall-cmd --zone=work --change-interface=eth1
Copy
Verify the changes by typing:
sudo firewall-cmd --get-active-zones
Copy
work
interfaces: eth1
public
interfaces: eth0
Copy

Changing the Default Zone

To change the default zone use the --set-default-zone flag followed by the name of the zone you want to make default. For example to change the default zone to home you should run the following command:
sudo firewall-cmd --set-default-zone=home
Copy
Verify the changes with:
sudo firewall-cmd --get-default-zone
Copy
home
Copy
Advertisement

Opening a Port or Service

With FirewallD you can allow traffic for specific ports based on predefined rules called services.
To get a list of all default available services type:
sudo firewall-cmd --get-services
Copy
You can find more information about each service by opening the associated .xml file within the /usr/lib/firewalld/services directory. For example, the HTTP service is defined like this:
/usr/lib/firewalld/services/http.xml


WWW (HTTP)
HTTP is the protocol used to serve Web pages. If you plan to make your Web server publicly available, enable this option. This option is not required for viewing pages locally or developing Web pages.protocol="tcp"port="80"/>CopyTo allow incoming HTTP traffic (port 80) for interfaces in the public zone, only for the current session (runtime configuration) type:
sudo firewall-cmd --zone=public --add-service=http
Copy
If you are modifying the default zone you can leave out the --zone flag.
To verify that the service was added successfully use the --list-services flag:
sudo firewall-cmd --zone=public --list-services
Copy
ssh dhcpv6-client http
Copy
If you want to keep the port 80 open after a reboot you’ll need to type the same command once again but this time with the --permanent flag:
sudo firewall-cmd --permanent --zone=public --add-service=http
Copy
Use the --list-services along with the --permanent flag to verify your changes:
sudo firewall-cmd --permanent --zone=public --list-services
Copy
ssh dhcpv6-client http
Copy
The syntax for removing a service is same as when adding a service. Just use --remove-service instead of the --add-service flag:
sudo firewall-cmd --zone=public --remove-service=http --permanent
Copy
The command above will remove the http service from the public zone permanent configuration.
What if you are running an application such as Plex Media Server for which there is no appropriate service available?
In cases like these you have two options. You can either open up the appropriate ports or define a new FirewallD service.
For example, the Plex Server listens on port 32400 and uses TCP, to open the port in the public zone for the current session use the --add-port= flag:
sudo firewall-cmd --zone=public --add-port=32400/tcp
Copy
Protocols can be either tcp or udp.
To verify that the port was added successfully use the --list-ports flag:
sudo firewall-cmd --zone=public --list-ports
Copy
32400/tcp
Copy
To keep the port 32400 open after a reboot add the rule to the permanent settings by running the same command using the --permanent flag.
The syntax for removing a port is same as when adding a port. Just use --remove-port instead of the --add-port flag.
sudo firewall-cmd --zone=public --remove-port=32400/tcp
Copy

Creating a new FirewallD Service

As we have already mentioned, the default services are stored in the /usr/lib/firewalld/services directory. The easiest way to create a new service is to copy an existing service file to the /etc/firewalld/services directory which is the location for user created services and modify the file settings.
For example, to create a service definition for the Plex Media Server we can use the HTTP service file:
sudo cp /usr/lib/firewalld/services/ssh.xml /etc/firewalld/services/plexmediaserver.xml
Copy
Open the newly created plexmediaserver.xml file and change the short name and description for the service within the and tags. The most important tag you need to change is the port tag which define the port number and protocol you want to open. In the following example we are opening 1900 UDP and 32400 TCP ports.
/etc/firewalld/services/plexmediaserver.xml

version="1.0">
plexmediaserver
Plex is a streaming media server that brings all your video, music and photo collections together and stream them to your devices at anytime and from anywhere.protocol="udp"port="1900"/>protocol="tcp"port="32400"/>CopySave the file and reload the FirewallD service:
sudo firewall-cmd --reload
Copy
You can now use the plexmediaserver service in your zones same as any other service..

Forwarding Port with Firewalld

To forward traffic from one port to another port or address, first enable masquerading for the desired zone using the --add-masquerade switch. For example to enable masquerading for external zone type:
sudo firewall-cmd --zone=external --add-masquerade
Copy
  • Forward traffic from one port to another on the same server
In the following example we are forwarding the traffic from port 80 to port 8080 on the same server:
sudo firewall-cmd --zone=external --add-forward-port=port=80:proto=tcp:toport=8080
Copy
  • Forward traffic to another server
In the following example we are forwarding the traffic from port 80 to port 80 on a server with IP 10.10.10.2:
sudo firewall-cmd --zone=external --add-forward-port=port=80:proto=tcp:toaddr=10.10.10.2
Copy
  • Forward traffic to another server on a different port
In the following example we are forwarding the traffic from port 80 to port 8080 on a server with IP 10.10.10.2:
sudo firewall-cmd --zone=external --add-forward-port=port=80:proto=tcp:toport=8080:toaddr=10.10.10.2
Copy
If you want to make the forward permanent just append the --permanent flag.

Creating a Ruleset with FirewallD

In the following example we will show you how to configure your firewall if you were running a web server. We are assuming that your server has only one interface eth0, and you want to allow incoming traffic only on SSH, HTTP and HTTPS ports.
  1. Change the default zone to dmz
    We will use the dmz (demilitarized) zone because by default it only allows SSH traffic. To change the default zone to dmz and to assign it to the eth0 interface run the following commands:
    sudo firewall-cmd --set-default-zone=dmz
    sudo firewall-cmd --zone=dmz --add-interface=eth0
    Copy
  2. Open HTTP and HTTPS ports:
    To open HTTP and HTTPS ports add permanent service rules to the dmz zone:
    sudo firewall-cmd --permanent --zone=dmz --add-service=http
    sudo firewall-cmd --permanent --zone=dmz --add-service=https
    Copy
    Make the changes effective immediately by reloading the firewall:
    sudo firewall-cmd --reload
    Copy
  3. Verify the changes
    To check the dmz zone configuration settings type:
    sudo firewall-cmd --zone=dmz --list-all
    dmz (active)
    target: default
    icmp-block-inversion: no
    interfaces: eth0
    sources:
    services: ssh http https
    ports:
    protocols:
    masquerade: no
    forward-ports:
    source-ports:
    icmp-blocks:
    rich rules:
    Copy
    The output above tells us that the dmz is the default zone, is applied to the eth0 interface and ssh (22) http (80) and https (443) ports are open.

Conclusion

You have learned how to configure and manage the FirewallD service on your CentOS system.
Be sure to allow all incoming connections that are necessary for proper functioning of you system, while limiting all unnecessary connections.
If you have questions feel free to leave a comment below.

How to change timezone on Ubuntu 18.04 Bionic Beaver Linux

$
0
0
https://linuxconfig.org/how-to-change-timezone-on-ubuntu-18-04-bionic-beaver-linux

Objective

The objective is to show how to change timezone on Ubuntu 18.04 Bionic Beaver Linux

Operating System and Software Versions

  • Operating System: - Ubuntu 18.04 Bionic Beaver Linux

Requirements

Privileged access to your Ubuntu System as root or via sudo command is required.

Difficulty

EASY

Conventions

  • # - requires given linux commands to be executed with root privileges either directly as a root user or by use of sudo command
  • $ - requires given linux commands to be executed as a regular non-privileged user

Instructions

Change timezone from command line

Check Current Timezone Settings

Let's start by checking the current timezone settings. Use the timedatectl command to show the current timezone and time:
$ timedatectl
Local time: Tue 2018-06-06 10:27:34 PST
Universal time: Tue 2018-06-06 18:27:34 UTC
RTC time: Tue 2018-06-06 18:27:35
Time zone: Canada/Yukon (PST, -0800)
System clock synchronized: yes
systemd-timesyncd.service active: yes
RTC in local TZ: no
Another alternative to check current timezone on Ubuntu 18.04 system, if the above command from some reason fails, is to check for /etc/localtime symbolic link:
$ ls -l /etc/localtime
lrwxrwxrwx 1 root root 32 Jun 6 10:27 /etc/localtime -> /usr/share/zoneinfo/Canada/Yukon


Show all Available Timezones

In order to change timezone on Ubuntu 18.04, we first need to obtain a timezone name of the timezone we wish to change to. This is usually a CONTINENT/CITY pair.

The timedatectl command comes again handy:
$ timedatectl list-timezone
The timezone list is quite extensive. Scroll page down and up with PgDn and PgUp key respectively.

Alternatively, use grep command to narrow down your search. For example the bellow command will list all Europe cities:
$ timedatectl list-timezones | grep -i europe
Europe/Amsterdam
Europe/Andorra
Europe/Astrakhan
Europe/Athens
Europe/Belgrade
Europe/Berlin
Europe/Bratislava
Europe/Brussels
Europe/Bucharest
Europe/Budapest
Europe/Busingen
...
Europe/Zurich
NOTE:

The timedatectl command is using /usr/share/zoneinfo/ directory to generate the timezone list.

Change Timezone

Now that we know the timezone name we wish to change our timezone settings to, use timedatectl command to set a new timezone.

For example let's change timezone to Europe/Bratislava:
$ sudo timedatectl set-timezone Europe/Bratislava
Using the timedatectl command is a preferred way on how to set a timezone on Ubuntu 18.04. However, note that you can also change timezone settings manually:

NOTE:Changing the timezone using the manual method involving ln command may take minute or so to take an effect.
$ sudo unlink /etc/localtime
$ sudo ln -s /usr/share/zoneinfo/Europe/Bratislava /etc/localtime


Confirm Timezone Change

Lastly, confirm your new timezone settings:
$ timedatectl 
Local time: Tue 2018-06-06 19:57:17 CET
Universal time: Tue 2018-06-06 18:57:17 UTC
RTC time: Tue 2018-06-06 18:57:18
Time zone: Europe/Bratislava (CET, +0100)
System clock synchronized: yes
systemd-timesyncd.service active: yes
RTC in local TZ: no
Alternatively, confirm a new timezone settings using ls command:
$ ls -l /etc/localtime
lrwxrwxrwx 1 root root 37 Jun 6 20:00 /etc/localtime -> /usr/share/zoneinfo/Europe/Bratislava

Change timezone from GUI

To change timezone from a default GNOME graphical user interface. Navigate to Settings-->Details-->Date & Time:
Current timezone
Current timezone.
Select timezone - Ubuntu 18:04
Use search box to search for a city or find your timezone manually by mouse click.
New timezone is set
New timezone is set.

Linux curl Command Tutorial for Beginners (5 Examples)

$
0
0
https://www.howtoforge.com/linux-curl-command

While Web browsers are the primary medium through which users download stuff from the Internet, there are some Linux commands that also let you do this. These tools come in handy on headless systems where there's no GUI.
In this tutorial, we will discuss one such command - curl - that among other things lets you download stuff from the Web. Please note that examples discussed in this article are tested on Ubuntu 16.04 LTS.

Linux curl command

The curl command allows you to download as well as upload data through the command line in Linux. Following is its syntax:
curl [options] [URL...]
And here's what the man page says about this command:
 curl is a tool to transfer data from or to a server, using one of the
supported protocols (DICT, FILE, FTP, FTPS, GOPHER, HTTP, HTTPS, IMAP,
IMAPS, LDAP, LDAPS, POP3, POP3S, RTMP, RTSP, SCP, SFTP, SMTP, SMTPS,
TELNET and TFTP). The command is designed to work without user inter?
action.

curl offers a busload of useful tricks like proxy support, user authen?
tication, FTP upload, HTTP post, SSL connections, cookies, file trans?
fer resume, Metalink, and more. As you will see below, the number of
features will make your head spin!

curl is powered by libcurl for all transfer-related features. See
libcurl(3) for details.
Following are some Q&A-styled examples that should give you a better idea on how curl works.

Q1. How curl command works?

Basic usage is fairly simple - just pass the URL as input to the curl command, and redirect the output to a file.
For example:
curl http://releases.ubuntu.com/18.04/ubuntu-18.04-desktop-amd64.iso.torrent > test.torrent
Note that you can also use the -o option here.
-o, --output
Write output to instead of stdout.
Coming back to our example, while the data got downloaded in the 'test.torrent' file on my system, the following output was produced on the command line:
How curl command works
Here's what the man page says about this progress meter that gets displayed in the output:
 curl normally displays a progress meter during operations, indicating
the amount of transferred data, transfer speeds and estimated time
left, etc.

curl displays this data to the terminal by default, so if you invoke
curl to do an operation and it is about to write data to the terminal,
it disables the progress meter as otherwise it would mess up the output
mixing progress meter and response data.

If you want a progress meter for HTTP POST or PUT requests, you need to
redirect the response output to a file, using shell redirect (>), -o
[file] or similar.

It is not the same case for FTP upload as that operation does not spit
out any response data to the terminal.

If you prefer a progress "bar" instead of the regular meter, -# is your
friend.

Q2. How to make curl use same download file name?

In the previous example, you see we had to explicitly specify the downloaded file name. However, if you want, you can force curl to use the name of the file being downloaded as the local file name. This can be done using the -O command line option.
curl -O http://releases.ubuntu.com/18.04/ubuntu-18.04-desktop-amd64.iso.torrent
So in this case, a file named 'ubuntu-18.04-desktop-amd64.iso.torrent' was produced in the output on my system.

Q3. How to download multiple files using curl?

This isn't complicated as well - just pass the URLs in the following way:
curl -O [URL1] -O [URL2] -O [URL3] ...
 For example:
curl -O http://releases.ubuntu.com/18.04/ubuntu-18.04-desktop-amd64.iso.torrent -O http://releases.ubuntu.com/18.04/ubuntu-18.04-live-server-amd64.iso.torrent
Here's the above command in action:
How to download multiple files using curl
So you can see the download progress for both URLs was shown in the output.

Q4. How to resolve the 'moved' issue?

Sometimes, when you pass a URL to the curl command, you get errors like "Moved" or "Moved Permanently". This usually happens when the input URL redirects to some other URL. For example, you open a website say oneplus.com, and it redirects to a URL for your home country (like oneplus.in), so you get  an error like the following:
How to resolve the 'moved' issue
If you want curl to follow the redirect, use the -L command line option instead.
curl -L http://www.oneplus.com

Q5. How to resume a download from point of interruption?

Sometimes, a download gets interrupted in between. So naturally, to save time and data, when you try again,. you may want it to begin from the point at which it got interrupted. Curl allows you to do this using the -C command line option.
For example:
 curl -C - -O http://releases.ubuntu.com/18.04/ubuntu-18.04-desktop-amd64.iso
The following screenshot shows the curl command resuming the download after it was interrupted.
How to resume a download from point of interruption

Conclusion

So you can see, the curl command is a useful utility if you are into downloading stuff through the command line. We've just scratched the surface here, as the tool offers a lot more features. Once you are done practicing the command line options discussed in this tutorial, you can head to curl's manual page to know more about it.

The evolution of package managers

$
0
0
https://opensource.com/article/18/7/evolution-package-managers

Package managers play an important role in Linux software management. Here's how some of the leading players compare.

The evolution of package managers
Image by : 
opensource.com
x

Get the newsletter

Join the 85,000 open source advocates who receive our giveaway alerts and article roundups.
Every computerized device uses some form of software to perform its intended tasks. In the early days of software, products were stringently tested for bugs and other defects. For the last decade or so, software has been released via the internet with the intent that any bugs would be fixed by applying new versions of the software. In some cases, each individual application has its own updater. In others, it is left up to the user to figure out how to obtain and upgrade software.
Linux adopted early the practice of maintaining a centralized location where users could find and install software. In this article, I'll discuss the history of software installation on Linux and how modern operating systems are kept up to date against the never-ending torrent of CVEs.

How was software on Linux installed before package managers?

Historically, software was provided either via FTP or mailing lists (eventually this distribution would grow to include basic websites). Only a few small files contained the instructions to create a binary (normally in a tarfile). You would untar the files, read the readme, and as long as you had GCC or some other form of C compiler, you would then typically run a ./configure script with some list of attributes, such as pathing to library files, location to create new binaries, etc. In addition, the configure process would check your system for application dependencies. If any major requirements were missing, the configure script would exit and you could not proceed with the installation until all the dependencies were met. If the configure script completed successfully, a Makefile would be created.
Once a Makefile existed, you would then proceed to run the make command (this command is provided by whichever compiler you were using). The make command has a number of options called make flags, which help optimize the resulting binaries for your system. In the earlier days of computing, this was very important because hardware struggled to keep up with modern software demands. Today, compilation options can be much more generic as most hardware is more than adequate for modern software.
Finally, after the make process had been completed, you would need to run make install (or sudo make install) in order to actually install the software. As you can imagine, doing this for every single piece of software was time-consuming and tedious—not to mention the fact that updating software was a complicated and potentially very involved process.

What is a package?

Packages were invented to combat this complexity. Packages collect multiple data files together into a single archive file for easier portability and storage, or simply compress files to reduce storage space. The binaries included in a package are precompiled with according to the sane defaults the developer chosen. Packages also contain metadata, such as the software's name, a description of its purpose, a version number, and a list of dependencies necessary for the software to run properly.
Several flavors of Linux have created their own package formats. Some of the most commonly used package formats include:
  • .deb: This package format is used by Debian, Ubuntu, Linux Mint, and several other derivatives. It was the first package type to be created.
  • .rpm: This package format was originally called Red Hat Package Manager. It is used by Red Hat, Fedora, SUSE, and several other smaller distributions.
  • .tar.xz: While it is just a compressed tarball, this is the format that Arch Linux uses.
While packages themselves don't manage dependencies directly, they represented a huge step forward in Linux software management.

What is a software repository?

A few years ago, before the proliferation of smartphones, the idea of a software repository was difficult for many users to grasp if they were not involved in the Linux ecosystem. To this day, most Windows users still seem to be hardwired to open a web browser to search for and install new software. However, those with smartphones have gotten used to the idea of a software "store." The way smartphone users obtain software and the way package managers work are not dissimilar. While there have been several attempts at making an attractive UI for software repositories, the vast majority of Linux users still use the command line to install packages. Software repositories are a centralized listing of all of the available software for any repository the system has been configured to use. Below are some examples of searching a repository for a specifc package (note that these have been truncated for brevity):
Arch Linux with aurman


user@arch ~ $  aurman -Ss kate


extra/kate 18.04.2-2 (kde-applications kdebase)

    Advanced Text Editor

aur/kate-root 18.04.0-1 (11, 1.139399)

    Advanced Text Editor, patched to be able to run as root

aur/kate-git r15288.15d26a7-1 (1, 1e-06)

    An advanced editor component which is used in numerous KDE applications requiring a text editing component


CentOS 7 using YUM


[user@centos ~]$ yum search kate


kate-devel.x86_64 : Development files for kate

kate-libs.x86_64 : Runtime files for kate

kate-part.x86_64 : Kate kpart plugin


Ubuntu using APT


user@ubuntu ~ $ apt search kate

Sorting... Done

Full Text Search... Done


kate/xenial 4:15.12.3-0ubuntu2 amd64

  powerful text editor


kate-data/xenial,xenial 4:4.14.3-0ubuntu4 all

  shared data files for Kate text editor


kate-dbg/xenial 4:15.12.3-0ubuntu2 amd64

  debugging symbols for Kate


kate5-data/xenial,xenial 4:15.12.3-0ubuntu2 all

  shared data files for Kate text editor


What are the most prominent package managers?

As suggested in the above output, package managers are used to interact with software repositories. The following is a brief overview of some of the most prominent package managers.

RPM-based package managers

Updating RPM-based systems, particularly those based on Red Hat technologies, has a very interesting and detailed history. In fact, the current versions of yum (for enterprise distributions) and DNF (for community) combine several open source projects to provide their current functionality.
Initially, Red Hat used a package manager called RPM (Red Hat Package Manager), which is still in use today. However, its primary use is to install RPMs, which you have locally, not to search software repositories. The package manager named up2date was created to inform users of updates to packages and enable them to search remote repositories and easily install dependencies. While it served its purpose, some community members felt that up2date had some significant shortcomings.
The current incantation of yum came from several different community efforts. Yellowdog Updater (YUP) was developed in 1999-2001 by folks at Terra Soft Solutions as a back-end engine for a graphical installer of Yellow Dog Linux. Duke University liked the idea of YUP and decided to improve upon it. They created Yellowdog Updater, Modified (yum) which was eventually adapted to help manage the university's Red Hat Linux systems. Yum grew in popularity, and by 2005 it was estimated to be used by more than half of the Linux market. Today, almost every distribution of Linux that uses RPMs uses yum for package management (with a few notable exceptions).

Working with yum

In order for yum to download and install packages out of an internet repository, files must be located in /etc/yum.repos.d/ and they must have the extension .repo. Here is an example repo file:


[local_base]

name=Base CentOS  (local)

baseurl=http://7-repo.apps.home.local/yum-repo/7/

enabled=1

gpgcheck=0


This is for one of my local repositories, which explains why the GPG check is off. If this check was on, each package would need to be signed with a cryptographic key and a corresponding key would need to be imported into the system receiving the updates. Because I maintain this repository myself, I trust the packages and do not bother signing them.
Once a repository file is in place, you can start installing packages from the remote repository. The most basic command is yum update, which will update every package currently installed. This does not require a specific step to refresh the information about repositories; this is done automatically. A sample of the command is shown below:


[user@centos ~]$ sudo yum update

Loaded plugins: fastestmirror, product-id, search-disabled-repos, subscription-manager

local_base                             | 3.6 kB  00:00:00    

local_epel                             | 2.9 kB  00:00:00    

local_rpm_forge                        | 1.9 kB  00:00:00    

local_updates                          | 3.4 kB  00:00:00    

spideroak-one-stable                   | 2.9 kB  00:00:00    

zfs                                    | 2.9 kB  00:00:00    

(1/6): local_base/group_gz             | 166 kB  00:00:00    

(2/6): local_updates/primary_db        | 2.7 MB  00:00:00    

(3/6): local_base/primary_db           | 5.9 MB  00:00:00    

(4/6): spideroak-one-stable/primary_db |  12 kB  00:00:00    

(5/6): local_epel/primary_db           | 6.3 MB  00:00:00    

(6/6): zfs/x86_64/primary_db           |  78 kB  00:00:00    

local_rpm_forge/primary_db             | 125 kB  00:00:00    

Determining fastest mirrors

Resolving Dependencies

--> Running transaction check


If you are sure you want yum to execute any command without stopping for input, you can put the -y flag in the command, such as yum update -y.
Installing a new package is just as easy. First, search for the name of the package with yum search:


[user@centos ~]$ yum search kate


artwiz-aleczapka-kates-fonts.noarch : Kates font in Artwiz family

ghc-highlighting-kate-devel.x86_64 : Haskell highlighting-kate library development files

kate-devel.i686 : Development files for kate

kate-devel.x86_64 : Development files for kate

kate-libs.i686 : Runtime files for kate

kate-libs.x86_64 : Runtime files for kate

kate-part.i686 : Kate kpart plugin


Once you have the name of the package, you can simply install the package with sudo yum install kate-devel -y. If you installed a package you no longer need, you can remove it with sudo yum remove kate-devel -y. By default, yum will remove the package plus its dependencies.
There may be times when you do not know the name of the package, but you know the name of the utility. For example, suppose you are looking for the utility updatedb, which creates/updates the database used by the locate command. Attempting to install updatedb returns the following results:


[user@centos ~]$ sudo yum install updatedb

Loaded plugins: fastestmirror, langpacks

Loading mirror speeds from cached hostfile

No package updatedb available.

Error: Nothing to do


You can find out what package the utility comes from by running:


[user@centos ~]$ yum whatprovides *updatedb

Loaded plugins: fastestmirror, langpacks

Loading mirror speeds from cached hostfile


bacula-director-5.2.13-23.1.el7.x86_64 : Bacula Director files

Repo        : local_base

Matched from:

Filename    : /usr/share/doc/bacula-director-5.2.13/updatedb


mlocate-0.26-8.el7.x86_64 : An utility for finding files by name

Repo        : local_base

Matched from:

Filename    : /usr/bin/updatedb


The reason I have used an asterisk * in front of the command is because yum whatprovides uses the path to the file in order to make a match. Since I was not sure where the file was located, I used an asterisk to indicate any path.
There are, of course, many more options available to yum. I encourage you to view the man page for yum for additional options.
Dandified Yum (DNF) is a newer iteration on yum. Introduced in Fedora 18, it has not yet been adopted in the enterprise distributions, and as such is predominantly used in Fedora (and derivatives). Its usage is almost exactly the same as that of yum, but it was built to address poor performance, undocumented APIs, slow/broken dependency resolution, and occasional high memory usage. DNF is meant as a drop-in replacement for yum, and therefore I won't repeat the commands—wherever you would use yum, simply substitute dnf.

Working with Zypper

Zypper is another package manager meant to help manage RPMs. This package manager is most commonly associated with SUSE (and openSUSE) but has also seen adoption by MeeGo, Sailfish OS, and Tizen. It was originally introduced in 2006 and has been iterated upon ever since. There is not a whole lot to say other than Zypper is used as the back end for the system administration tool YaST and some users find it to be faster than yum.
Zypper's usage is very similar to that of yum. To search for, update, install or remove a package, simply use the following:


zypper search kate

zypper update

zypper install kate

zypper remove kate


Some major differences come into play in how repositories are added to the system with zypper. Unlike the package managers discussed above, zypper adds repositories using the package manager itself. The most common way is via a URL, but zypper also supports importing from repo files.


suse:~ # zypper addrepo http://download.videolan.org/pub/vlc/SuSE/15.0 vlc

Adding repository 'vlc' [done]

Repository 'vlc' successfully added


Enabled     : Yes

Autorefresh : No

GPG Check   : Yes

URI         : http://download.videolan.org/pub/vlc/SuSE/15.0

Priority    : 99


You remove repositories in a similar manner:


suse:~ # zypper removerepo vlc

Removing repository 'vlc' ...................................[done]

Repository 'vlc' has been removed.


Use the zypper repos command to see what the status of repositories are on your system:


suse:~ # zypper repos

Repository priorities are without effect. All enabled repositories share the same priority.


#  | Alias                     | Name                                    | Enabled | GPG Check | Refresh

---+---------------------------+-----------------------------------------+---------+-----------+--------

 1 | repo-debug                | openSUSE-Leap-15.0-Debug                | No      | ----      | ----  

 2 | repo-debug-non-oss        | openSUSE-Leap-15.0-Debug-Non-Oss        | No      | ----      | ----  

 3 | repo-debug-update         | openSUSE-Leap-15.0-Update-Debug         | No      | ----      | ----  

 4 | repo-debug-update-non-oss | openSUSE-Leap-15.0-Update-Debug-Non-Oss | No      | ----      | ----  

 5 | repo-non-oss              | openSUSE-Leap-15.0-Non-Oss              | Yes     | ( p) Yes  | Yes    

 6 | repo-oss                  | openSUSE-Leap-15.0-Oss                  | Yes     | ( p) Yes  | Yes    


zypper even has a similar ability to determine what package name contains files or binaries. Unlike YUM, it uses a hyphen in the command (although this method of searching is deprecated):


localhost:~ # zypper what-provides kate

Command 'what-provides' is replaced by 'search --provides --match-exact'.

See 'help search' for all available options.

Loading repository data...

Reading installed packages...


S  | Name | Summary              | Type      

---+------+----------------------+------------

i+ | Kate | Advanced Text Editor | application

i  | kate | Advanced Text Editor | package  


As with YUM and DNF, Zypper has a much richer feature set than covered here. Please consult with the official documentation for more in-depth information.

Debian-based package managers

One of the oldest Linux distributions currently maintained, Debian's system is very similar to RPM-based systems. They use .deb packages, which can be managed by a tool called dpkg. dpkg is very similar to rpm in that it was designed to manage packages that are available locally. It does no dependency resolution (although it does dependency checking), and has no reliable way to interact with remote repositories. In order to improve the user experience and ease of use, the Debian project commissioned a project called Deity. This codename was eventually abandoned and changed to Advanced Package Tool (APT).
Released as test builds in 1998 (before making an appearance in Debian 2.1 in 1999), many users consider APT one of the defining features of Debian-based systems. It makes use of repositories in a similar fashion to RPM-based systems, but instead of individual .repo files that yum uses, apt has historically used /etc/apt/sources.list to manage repositories. More recently, it also ingests files from /etc/apt/sources.d/. Following the examples in the RPM-based package managers, to accomplish the same thing on Debian-based distributions you have a few options. You can edit/create the files manually in the aforementioned locations from the terminal, or in some cases, you can use a UI front end (such as Software & Updates provided by Ubuntu et al.). To provide the same treatment to all distributions, I will cover only the command-line options. To add a repository without directly editing a file, you can do something like this:
user@ubuntu:~$ sudo apt-add-repository "deb http://APT.spideroak.com/ubuntu-spideroak-hardy/ release restricted"
This will create a spideroakone.list file in /etc/apt/sources.list.d. Obviously, these lines change depending on the repository being added. If you are adding a Personal Package Archive (PPA), you can do this:
user@ubuntu:~$ sudo apt-add-repository ppa:gnome-desktop
NOTE: Debian does not support PPAs natively.
After a repository has been added, Debian-based systems need to be made aware that there is a new location to search for packages. This is done via the apt-get update command:


user@ubuntu:~$ sudo apt-get update

Get:1 http://security.ubuntu.com/ubuntu xenial-security InRelease [107 kB]

Hit:2 http://APT.spideroak.com/ubuntu-spideroak-hardy release InRelease

Hit:3 http://ca.archive.ubuntu.com/ubuntu xenial InRelease

Get:4 http://ca.archive.ubuntu.com/ubuntu xenial-updates InRelease [109 kB]              

Get:5 http://security.ubuntu.com/ubuntu xenial-security/main amd64 Packages [517 kB]

Get:6 http://security.ubuntu.com/ubuntu xenial-security/main i386 Packages [455 kB]      

Get:7 http://security.ubuntu.com/ubuntu xenial-security/main Translation-en [221 kB]    

...


Fetched 6,399 kB in 3s (2,017 kB/s)                                          

Reading package lists... Done


Now that the new repository is added and updated, you can search for a package using the apt-cache command:


user@ubuntu:~$ apt-cache search kate

aterm-ml - Afterstep XVT - a VT102 emulator for the X window system

frescobaldi - Qt4 LilyPond sheet music editor

gitit - Wiki engine backed by a git or darcs filestore

jedit - Plugin-based editor for programmers

kate - powerful text editor

kate-data - shared data files for Kate text editor

kate-dbg - debugging symbols for Kate

katepart - embeddable text editor component


To install kate, simply run the corresponding install command:
user@ubuntu:~$ sudo apt-get install kate
To remove a package, use apt-get remove:
user@ubuntu:~$ sudo apt-get remove kate
When it comes to package discovery, APT does not provide any functionality that is similar to yum whatprovides. There are a few ways to get this information if you are trying to find where a specific file on disk has come from.
Using dpkg


user@ubuntu:~$ dpkg -S /bin/ls

coreutils: /bin/ls


Using apt-file


user@ubuntu:~$ sudo apt-get install apt-file -y


user@ubuntu:~$ sudo apt-file update


user@ubuntu:~$ apt-file search kate


The problem with apt-file search is that it, unlike yum whatprovides, it is overly verbose unless you know the exact path, and it automatically adds a wildcard search so that you end up with results for anything with the word kate in it:


kate: /usr/bin/kate

kate: /usr/lib/x86_64-linux-gnu/qt5/plugins/ktexteditor/katebacktracebrowserplugin.so

kate: /usr/lib/x86_64-linux-gnu/qt5/plugins/ktexteditor/katebuildplugin.so

kate: /usr/lib/x86_64-linux-gnu/qt5/plugins/ktexteditor/katecloseexceptplugin.so

kate: /usr/lib/x86_64-linux-gnu/qt5/plugins/ktexteditor/katectagsplugin.so


Most of these examples have used apt-get. Note that most of the current tutorials for Ubuntu specifically have taken to simply using apt. The single apt command was designed to implement only the most commonly used commands in the APT arsenal. Since functionality is split between apt-get, apt-cache, and other commands, apt looks to unify these into a single command. It also adds some niceties such as colorization, progress bars, and other odds and ends. Most of the commands noted above can be replaced with apt,  but not all Debian-based distributions currently receiving security patches support using apt by default, so you may need to install additional packages.

Arch-based package managers

Arch Linux uses a package manager called pacman. Unlike .deb or .rpm files, pacman uses a more traditional tarball with the LZMA2 compression (.tar.xz). This enables Arch Linux packages to be much smaller than other forms of compressed archives (such as gzip). Initially released in 2002, pacman has been steadily iterated and improved. One of the major benefits of pacman is that it supports the Arch Build System, a system for building packages from source. The build system ingests a file called a PKGBUILD, which contains metadata (such as version numbers, revisions, dependencies, etc.) as well as a shell script with the required flags for compiling a package conforming to the Arch Linux requirements. The resulting binaries are then packaged into the aforementioned .tar.xz file for consumption by pacman.
This system led to the creation of the Arch User Repository (AUR) which is a community-driven repository containing PKGBUILD files and supporting patches or scripts. This allows for a virtually endless amount of software to be available in Arch. The obvious advantage of this system is that if a user (or maintainer) wishes to make software available to the public, they do not have to go through official channels to get it accepted in the main repositories. The downside is that it relies on community curation similar to Docker Hub, Canonical's Snap packages, or other similar mechanisms. There are numerous AUR-specific package managers that can be used to download, compile, and install from the PKGBUILD files in the AUR (we will look at this later).

Working with pacman and official repositories

Arch's main package manager, pacman, uses flags instead of command words like yum and apt. For example, to search for a package, you would use pacman -Ss. As with most commands on Linux, you can find both a manpage and inline help. Most of the commands for pacman use the sync (-S) flag. For example:


user@arch ~ $ pacman -Ss kate


extra/kate 18.04.2-2 (kde-applications kdebase)

    Advanced Text Editor

extra/libkate 0.4.1-6 [installed]

    A karaoke and text codec for embedding in ogg

extra/libtiger 0.3.4-5 [installed]

    A rendering library for Kate streams using Pango and Cairo

extra/ttf-cheapskate 2.0-12

    TTFonts collection from dustimo.com

community/haskell-cheapskate 0.1.1-100

    Experimental markdown processor.


Arch also uses repositories similar to other package managers. In the output above, search results are prefixed with the repository they are found in (extra/ and community/ in this case). Similar to both Red Hat and Debian-based systems, Arch relies on the user to add the repository information into a specific file. The location for these repositories is /etc/pacman.conf. The example below is fairly close to a stock system. I have enabled the [multilib] repository for Steam support:


[options]

Architecture = auto


Color

CheckSpace


SigLevel    = Required DatabaseOptional

LocalFileSigLevel = Optional


[core]

Include = /etc/pacman.d/mirrorlist


[extra]

Include = /etc/pacman.d/mirrorlist


[community]

Include = /etc/pacman.d/mirrorlist


[multilib]

Include = /etc/pacman.d/mirrorlist


It is possible to specify a specific URL in pacman.conf. This functionality can be used to make sure all packages come from a specific point in time. If, for example, a package has a bug that affects you severely and it has several dependencies, you can roll back to a specific point in time by adding a specific URL into your pacman.conf and then running the commands to downgrade the system:


[core]

Server=https://archive.archlinux.org/repos/2017/12/22/$repo/os/$arch


Like Debian-based systems, Arch does not update its local repository information until you tell it to do so. You can refresh the package database by issuing the following command:


user@arch ~ $ sudo pacman -Sy


:: Synchronizing package databases...

 core                                                                    
130.2 KiB   851K/s 00:00
[##########################################################] 100%

 extra                                                                  
1645.3 KiB  2.69M/s 00:01
[##########################################################] 100%

 community                                                              
   4.5 MiB  2.27M/s 00:02
[##########################################################] 100%

 multilib is up to date


As you can see in the above output, pacman thinks that the multilib package database is up to date. You can force a refresh if you think this is incorrect by running pacman -Syy. If you want to update your entire system (excluding packages installed from the AUR), you can run pacman -Syu:


user@arch ~ $ sudo pacman -Syu


:: Synchronizing package databases...

 core is up to date

 extra is up to date

 community is up to date

 multilib is up to date

:: Starting full system upgrade...

resolving dependencies...

looking for conflicting packages...


Packages (45) ceph-13.2.0-2  ceph-libs-13.2.0-2  debootstrap-1.0.105-1
 guile-2.2.4-1  harfbuzz-1.8.2-1  harfbuzz-icu-1.8.2-1
 haskell-aeson-1.3.1.1-20

              haskell-attoparsec-0.13.2.2-24  haskell-tagged-0.8.6-1
 imagemagick-7.0.8.4-1  lib32-harfbuzz-1.8.2-1  lib32-libgusb-0.3.0-1
 lib32-systemd-239.0-1

              libgit2-1:0.27.2-1  libinput-1.11.2-1  libmagick-7.0.8.4-1
 libmagick6-6.9.10.4-1  libopenshot-0.2.0-1  libopenshot-audio-0.1.6-1
 libosinfo-1.2.0-1

              libxfce4util-4.13.2-1  minetest-0.4.17.1-1
 minetest-common-0.4.17.1-1  mlt-6.10.0-1  mlt-python-bindings-6.10.0-1
 ndctl-61.1-1  netctl-1.17-1

              nodejs-10.6.0-1  


Total Download Size:      2.66 MiB

Total Installed Size:   879.15 MiB

Net Upgrade Size:      -365.27 MiB


:: Proceed with installation? [Y/n]


In the scenario mentioned earlier regarding downgrading a system, you can force a downgrade by issuing pacman -Syyuu. It is important to note that this should not be undertaken lightly. This should not cause a problem in most cases; however, there is a chance that downgrading of a package or several packages will cause a cascading failure and leave your system in an inconsistent state. USE WITH CAUTION!
To install a package, simply use pacman -S kate:


user@arch ~ $ sudo pacman -S kate


resolving dependencies...

looking for conflicting packages...


Packages (7) editorconfig-core-c-0.12.2-1  kactivities-5.47.0-1
 kparts-5.47.0-1  ktexteditor-5.47.0-2  syntax-highlighting-5.47.0-1
 threadweaver-5.47.0-1

             kate-18.04.2-2


Total Download Size:   10.94 MiB

Total Installed Size:  38.91 MiB


:: Proceed with installation? [Y/n]


To remove a package, you can run pacman -R kate. This removes only the package and not its dependencies:


user@arch ~ $ sudo pacman -S kate


checking dependencies...


Packages (1) kate-18.04.2-2


Total Removed Size:  20.30 MiB


:: Do you want to remove these packages? [Y/n]


If you want to remove the dependencies that are not required by other packages, you can run pacman -Rs:


user@arch ~ $ sudo pacman -Rs kate


checking dependencies...


Packages (7) editorconfig-core-c-0.12.2-1  kactivities-5.47.0-1
 kparts-5.47.0-1  ktexteditor-5.47.0-2  syntax-highlighting-5.47.0-1
 threadweaver-5.47.0-1

             kate-18.04.2-2


Total Removed Size:  38.91 MiB


:: Do you want to remove these packages? [Y/n]


Pacman, in my opinion, offers the most succinct way of searching for the name of a package for a given utility. As shown above, yum and apt both rely on pathing in order to find useful results. Pacman makes some intelligent guesses as to which package you are most likely looking for:


user@arch ~ $ sudo pacman -Fs updatedb

core/mlocate 0.26.git.20170220-1

    usr/bin/updatedb


user@arch ~ $ sudo pacman -Fs kate

extra/kate 18.04.2-2

    usr/bin/kate


Working with the AUR

There are several popular AUR package manager helpers. Of these, yaourt and pacaur are fairly prolific. However, both projects are listed as discontinued or problematic on the Arch Wiki. For that reason, I will discuss aurman. It works almost exactly like pacman, except it searches the AUR and includes some helpful, albeit potentially dangerous, options. Installing a package from the AUR will initiate use of the package maintainer's build scripts. You will be prompted several times for permission to continue (I have truncated the output for brevity):


aurman -S telegram-desktop-bin

~~ initializing aurman...

~~ the following packages are neither in known repos nor in the aur

...

~~ calculating solutions...


:: The following 1 package(s) are getting updated:

   aur/telegram-desktop-bin  1.3.0-1  ->  1.3.9-1


?? Do you want to continue? Y/n: Y


~~ looking for new pkgbuilds and fetching them...

Cloning into 'telegram-desktop-bin'...


remote: Counting objects: 301, done.

remote: Compressing objects: 100% (152/152), done.

remote: Total 301 (delta 161), reused 286 (delta 147)

Receiving objects: 100% (301/301), 76.17 KiB | 639.00 KiB/s, done.

Resolving deltas: 100% (161/161), done.

?? Do you want to see the changes of telegram-desktop-bin? N/y: N


[sudo] password for user:


...

==> Leaving fakeroot environment.

==> Finished making: telegram-desktop-bin 1.3.9-1 (Thu 05 Jul 2018 11:22:02 AM EDT)

==> Cleaning up...

loading packages...

resolving dependencies...

looking for conflicting packages...


Packages (1) telegram-desktop-bin-1.3.9-1


Total Installed Size:  88.81 MiB

Net Upgrade Size:       5.33 MiB


:: Proceed with installation? [Y/n]


Sometimes you will be prompted for more input, depending on the complexity of the package you are installing. To avoid this tedium, aurman allows you to pass both the --noconfirm and --noedit options. This is equivalent to saying "accept all of the defaults, and trust that the package maintainers scripts will not be malicious."USE THIS OPTION WITH EXTREME CAUTION! While these options are unlikely to break your system on their own, you should never blindly accept someone else's scripts.

Conclusion

This article, of course, only scratches the surface of what package managers can do. There are also many other package managers available that I could not cover in this space. Some distributions, such as Ubuntu or Elementary OS, have gone to great lengths to provide a graphical approach to package management.
If you are interested in some of the more advanced functions of package managers, please post your questions or comments below and I would be glad to write a follow-up article.

Appendix


# search for packages

yum search

dnf search

zypper search

apt-cache search

apt search

pacman -Ss


# install packages

yum install

dnf install

zypper install

apt-get install

apt install

pacman -Ss


# update package database, not required by yum, dnf and zypper

apt-get update

apt update

pacman -Sy


# update all system packages

yum update

dnf update

zypper update

apt-get upgrade

apt upgrade

pacman -Su


# remove an installed package

yum remove

dnf remove

apt-get remove

apt remove

pacman -R

pacman -Rs


# search for the package name containing specific file or folder

yum whatprovides *

dnf whatprovides *

zypper what-provides

zypper search --provides

apt-file search

pacman -Sf


How To Install and Use Docker on Debian 9

$
0
0
https://linuxize.com/post/how-to-install-and-use-docker-on-debian-9

How To Install and Use Docker on Debian 9

This tutorial is also available for:

Docker is de facto standard for container technology and it is an essential tool for DevOps engineers and their continuous integration and delivery pipeline.
In this tutorial we will guide you through the process of installing Docker on a Debian 9 machine and explore the basic Docker concepts and commands.

Prerequisites 

Before continuing with this tutorial, make sure you are logged in as a user with sudo privileges. All the commands in this tutorial should be run as a non-root user.

Install Docker

The following steps describe how to install the latest stable Docker version from the Docker’s repositories.
  1. Update your system and install necessary packages
    Update the apt package list and upgrade all installed packages:
    sudo apt update
    sudo apt upgrade
    Copy
    Install the dependencies necessary to add a new repository over HTTPS:
    sudo apt install apt-transport-https ca-certificates curl software-properties-common gnupg2
    Copy
  2. Add the Docker repository
    First add the Docker’s GPG key to your apt keyring by executing:
    curl -fsSL https://download.docker.com/linux/debian/gpg | sudo apt-key add -
    Copy
    To add the Docker stable repository run the following command:
    sudo add-apt-repository "deb [arch=amd64] https://download.docker.com/linux/debian $(lsb_release -cs) stable"
    Copy
    $(lsb_release -cs) will return the name of the Debian distibution, in this case it will return jessie.
  3. Install Docker
    Now that the Docker repository is enabled, update the apt package list and install the latest version of Docker CE (Community Edition) with:
    sudo apt update
    sudo apt install docker-ce
    Copy
  4. Verify the installation
    Once the installation is completed the Docker service will start automatically. You can verify it by typing:
    sudo systemctl status docker
    Copy
    ● docker.service - Docker Application Container Engine
    Loaded: loaded (/lib/systemd/system/docker.service; enabled; vendor preset: enabled)
    Active: active (running) since Fri 2018-07-27 17:02:07 UTC; 1min 14s ago
    Docs: https://docs.docker.com
    Main PID: 16929 (dockerd)
    CGroup: /system.slice/docker.service
    Copy
    At the time of the writing of this article, the current version of Docker available for Debian 9 is 18.06.0-ce. To check the Docker version run:
    docker -v
    Copy
    Docker version 18.06.0-ce, build 0ffa825
    Copy

Executing the Docker Command Without Sudo

By default, only a user with administrator privileges can execute Docker commands.
If you want to run Docker commands as a non-root user without prepending sudo you’ll need to add your user to the docker group which is created during the installation of the Docker CE package. You can do that by typing:
sudo usermod -aG docker $USER
Copy
Log out and log back in so that the group membership is refreshed.
To verify that you can run docker commands without prepending sudo run the following command which will download a test image, run it in a container, print a “Hello from Docker” message and exit:
docker container run hello-world
Copy
The output should look like the following:

Docker command line interface

Now that we have Docker installed, let’s go over the basic syntax of the docker CLI:
docker [option] [subcommand] [arguments]
To list all available commands run docker with no parameters:
docker
If you need more help on any [subcommand], you can use the --help switch as shown bellow:
docker [subcommand] --help

Docker Images

A Docker image is made up of a series of filesystem layers representing instructions in the image’s Dockerfile that make up an executable software application. An image is an immutable binary file including the application and all other dependencies such as libraries, binaries and instructions necessary for running the application.
You can think of a Docker image as a snapshot of a Docker container.
Most Docker images are available on Docker Hub.
The Docker Hub is cloud-based registry service which among other functionalities is used for keeping the Docker images either in a public or private repository.

Search Docker Image

To search for an image from Docker Hub registry, use the search subcommand.
For example, to search for a Debian image, you would type:
docker search debian
The output should look like this:
As you can see the search results prints a table with five columns, NAME, DESCRIPTION, STARS, OFFICIAL and AUTOMATED.
Official image is an image that Docker develops in conjunction with upstream partners.
Most Docker images on Docker Hub are tagged with version numbers. When no tag is specified Docker will pull the latest image.

Download Docker Image

If we want to download the official build of the Debian image we can do that by using the image pull subcommand:
docker image pull debian
Depending on your Internet speed, the download may take a few seconds or a few minutes.
Since we haven’t specified a tag, docker will pull the latest Debian image which is 9.5. If you want to pull some of the previous Debian versions, let’s say Debian 8 then you need to use docker image pull debian:8
Once the image is downloaded we can list the images by typing:
docker image ls
The output will look something like this:

Remove Docker Image

If for some reason you want to delete an image you can do that with the image rm [image_name] subcommand:
docker image rm debian

Docker Containers

An instance of an image is called a container. A container represents a runtime for a single application, process, or service.
It may not be the most appropriate comparison but if you are a programmer you can think of a Docker image as class and Docker container as an instance of a class.
We can start, stop, remove and manage a container with the docker container subcommand.

Start Docker Container

The following command will start a Docker container based on the Debian image. If you don’t have the image locally, it will be downloaded first:
docker container run debian
At first sight it may seem to you that nothing happened at all. Well, that is not true. The Debian container stops immediately after booting up because it does not have a long-running process and we didn’t provide any command, so the container booted up, ran an empty command and then exited.
The switch -it allows us to interact with the container via the command line. To start an interactive container type:
docker container run -it debian /bin/bash
root@ee86c8c81b3b:/#
As you can see from the output above once the container is started the command prompt is changed which means that you’re now working from inside the container:

List Docker Containers

To list active containers, type:
docker container ls
If you don’t have any running containers the output will be empty.
To view both active and inactive containers, pass it the -a switch:
docker container ls -a

Remove Docker Containers

To delete a container multiple containers just copy the container ID (or IDs) and paste them after the container rm subcommand:
docker container rm c55680af670c

Conclusion

You have learned how to install Docker on your Debian 9 machine and how to download Docker images and manage Docker containers. This tutorial barely scratches the surface of the Docker ecosystem. In some of our next articles, we will continue to dive into other aspects of Docker.
You should also check out the official Docker documentation.
If you have any question, please leave a comment below.

How to analyze your system with perf and Python

$
0
0
https://opensource.com/article/18/7/fun-perf-and-python

New Linux tool, curt, uses the perf command's Python scripting capabilities to analyze system utilization by process, by task, and by CPU.

metrics and data shown on a computer screen
Image by : 
opensource.com
x

Get the newsletter

Join the 85,000 open source advocates who receive our giveaway alerts and article roundups.
Modern computers are ever increasing in performance and capacity. This matters little if that increasing capacity is not well utilized. Following is a description of the motivation and work behind "curt," a new tool for Linux systems for measuring and breaking down system utilization by process, by task, and by CPU using the perf command's Python scripting capabilities.
I had the privilege of presenting this topic at Texas Linux Fest 2018, and here I've gone a bit deeper into the details, included links to further information, and expanded the scope of my talk.

System utilization

In discussing computation, let's begin with some assertions:
  1. Every computational system is equally fast at doing nothing.
  2. Computational systems were created to do things.
  3. A computational system is better at doing things when it is doing something than when it is doing nothing.
Modern computational systems have many streams of execution:
  • Often, very large systems are created by literally wiring together smaller systems. At IBM, these smaller systems are sometimes called CECs (short for Central Electronics Complexes and pronounced "keks").
  • There are multiple sockets for processor modules in each system.
  • There are sometimes multiple chips per socket (in the form of dual-chip modules—DCMs—or multi-chip modules—MCMs).
  • There are multiple cores per chip.
  • There are multiple threads per core.
In sum, there are potentially thousands of execution threads across a single computational system.
Ideally, all these execution streams are 100% busy doing useful work. One measure of utilization for an individual execution stream (CPU thread) is the percentage of time that thread has tasks scheduled and running. (Note that I didn't say "doing useful work." Creating a tool that measures useful work is left as an exercise for the reader.) By extension, system utilization is the overall percentage of time that all execution streams of a system have tasks scheduled and running. Similarly, utilization can be defined with respect to an individual task. Task utilization is the percentage of the lifetime of the task that was spent actively running on any CPU thread. By extension, process utilization is the collective utilization of its tasks.

Utilization measurement tools

There are tools that measure system utilization: uptime, vmstat, mpstat, nmon, etc. There are tools that measure individual process utilization: time. There are not many tools that measure system-wide per-process and per-task utilization. One such command is curt on AIX. According to IBM's Knowledge Center: "The curt command takes an AIX trace file as input and produces a number of statistics related to processor (CPU) utilization and process/thread/pthread activity."
The AIX curt command reports system-wide, per-processor, per-process, and per-task statistics for application processing (user time), system calls (system time), hypervisor calls, kernel threads, interrupts, and idle time.
This seems like a good model for a similar command for a Linux system.

Utilization data

Before starting to create any tools for utilization analysis, it is important to know what data is required. Since utilization is directly related to whether a task is actively running or not, related scheduling events are required: When is the task made to run, and when is it paused? Tracking on which CPU the task runs is important, so migration events are required for implicit migrations. There are also certain system calls that force explicit migrations. Creation and deletion of tasks are obviously important. Since we want to understand user time, system time, hypervisor time, and interrupt time, events that show the transitions between those task states are required.
The Linux kernel contains "tracepoints" for all those events. It is possible to enable tracing for those events directly in the kernel's debugfs filesystem, usually mounted at /sys/kernel/debug, in the tracing directory (/sys/kernel/debug/tracing).
An easier way to record tracing data is with the Linux perf command.

The perf command

perf is a very powerful userspace command for tracing or counting both hardware and software events.
Software events are predefined in the kernel, can be predefined in userspace code, and can be dynamically created (as "probes") in kernel or userspace code.
perf can do much more than just trace and count, though.

perf stat

The stat subcommand of perf will run a command, count some events commonly found interesting, and produce a simple report:


Performance counter stats for './load 100000':


      90537.006424      task-clock:u (msec)       #    1.000 CPUs utilized          

                 0      context-switches:u        #    0.000 K/sec                  

                 0      cpu-migrations:u          #    0.000 K/sec                  

               915      page-faults:u             #    0.010 K/sec                  

   386,836,206,133      cycles:u                  #    4.273 GHz                      (66.67%)

     3,488,523,420      stalled-cycles-frontend:u #    0.90% frontend cycles idle     (50.00%)

   287,222,191,827      stalled-cycles-backend:u  #   74.25% backend cycles idle      (50.00%)

   291,102,378,513      instructions:u            #    0.75  insn per cycle        

                                                  #    0.99  stalled cycles per insn  (66.67%)

    43,730,320,236      branches:u                #  483.010 M/sec                    (50.00%)

       822,030,340      branch-misses:u           #    1.88% of all branches          (50.00%)


      90.539972837 seconds time elapsed


perf record, perf report, and perf annotate

For much more interesting analysis, the perf command can also be used to record events and information associated with the task state at the time the event occurred:


$ perf record ./some-command

[ perf record: Woken up 55 times to write data ]

[ perf record: Captured and wrote 13.973 MB perf.data (366158 samples) ]

$ perf report --stdio --show-nr-samples --percent-limit 4

# Samples: 366K of event 'cycles:u'

# Event count (approx.): 388851358382

#

# Overhead       Samples  Command  Shared Object      Symbol                                          

# ........  ............  .......  .................  ................................................

#

    62.31%        228162  load     load               [.] main

    19.29%         70607  load     load               [.] sum_add

    18.33%         67117  load     load               [.] sum_sub


This example shows a program that spends about 60% of its running time in the function main and about 20% each in subfunctions sum_sub and sum_add. Note that the default event used by perf record is "cycles." Later examples will show how to use perf record with other events.
perf report can further report runtime statistics by source code line (if the compilation was performed with the -g flag to produce debug information):


$ perf report --stdio --show-nr-samples --percent-limit 4 --sort=srcline

# Samples: 366K of event 'cycles:u'

# Event count (approx.): 388851358382

#

# Overhead       Samples  Source:Line                        

# ........  ............  ...................................

#

    19.40%         71031  load.c:58

    16.16%         59168  load.c:18

    15.11%         55319  load.c:14

    13.30%         48690  load.c:66

    13.23%         48434  load.c:70

     4.58%         16767  load.c:62

     4.01%         14677  load.c:56


Further, perf annotate can show statistics for each instruction of the program:


$ perf annotate --stdio

Percent |      Source code & Disassembly of load for cycles:u (70607 samples)

------------------------------------------------------------------------------

         :      0000000010000774 :

         :      int sum_add(int sum, int value) {

   12.60 :        10000774:   std     r31,-8(r1)

    0.02 :        10000778:   stdu    r1,-64(r1)

    0.00 :        1000077c:   mr      r31,r1

   41.90 :        10000780:   mr      r10,r3

    0.00 :        10000784:   mr      r9,r4

    0.05 :        10000788:   stw     r10,32(r31)

   23.78 :        1000078c:   stw     r9,36(r31)

         :              return (sum + value);

    0.76 :        10000790:   lwz     r10,32(r31)

    0.00 :        10000794:   lwz     r9,36(r31)

   14.75 :        10000798:   add     r9,r10,r9

    0.00 :        1000079c:   extsw   r9,r9

         :      }

    6.09 :        100007a0:   mr      r3,r9

    0.02 :        100007a4:   addi    r1,r31,64

    0.03 :        100007a8:   ld      r31,-8(r1)

    0.00 :        100007ac:   blr


(Note: this code is not optimized.)

perf top

Similar to the top command, which displays (at a regular update interval) the processes using the most CPU time, perf top will display the functions using the most CPU time among all processes on the system, a nice leap in granularity.

perf list

The examples thus far have used the default event, run cycles. There are hundreds and perhaps thousands of events of different types. perf list will show them all. Following are just a few examples:


$ perf list

  instructions                                       [Hardware event]

  context-switches OR cs                             [Software event]

  L1-icache-loads                                    [Hardware cache event]

  mem_access OR cpu/mem_access/                      [Kernel PMU event]

cache:

  pm_data_from_l2                                  

       [The processor's data cache was reloaded from local core's L2 due to a demand load]

floating point:

  pm_fxu_busy                                      

       [fxu0 busy and fxu1 busy]

frontend:

  pm_br_mpred_cmpl                                  

       [Number of Branch Mispredicts]

memory:

  pm_data_from_dmem                                

       [The processor's data cache was reloaded from another chip's
memory on the same Node or Group (Distant) due to a demand load]

  pm_data_from_lmem                                

       [The processor's data cache was reloaded from the local chip's Memory due to a demand load]

  rNNN                                               [Raw hardware event descriptor]

  raw_syscalls:sys_enter                             [Tracepoint event]

  syscalls:sys_enter_chmod                           [Tracepoint event]

  sdt_libpthread:pthread_create                      [SDT event]


Events labeled as Hardware event, Hardware cache event, Kernel PMU event, and most (if not all) of the events under the categories like cache, floating point, frontend, and memory are hardware events counted by the hardware and triggered each time a certain count is reached. Once triggered, an entry is made into the kernel trace buffer with the current state of the associated task. Raw hardware event codes are alphanumeric encodings of the hardware events. These are mostly needed when the hardware is newer than the kernel and the user needs to enable events that are new for that hardware. Users will rarely, if ever, need to use raw event codes.
Events labeled Tracepoint event are embedded in the kernel. These are triggered when that section of code is executed by the kernel. There are "syscalls" events for every system call supported by the kernel. raw_syscalls events are triggered for every system call. Since there is a limit to the number of events being actively traced, the raw_syscalls events may be more practical when a large number of system calls need to be traced.
Events labeled SDT event are for software-defined tracepoints (SDTs). These can be embedded in application or library code and enabled as needed. When enabled, they behave just like other events: When that section of code is executed (by any task being traced on the system), an entry is made in the kernel trace buffer with the current state of the associated task. This is a very powerful capability that can prove very useful.

perf buildid-cache and perf probe

Enabling SDTs is easy. First, make the SDTs for a certain library known to perf:


$ perf buildid-cache -v --add /lib/powerpc64le-linux-gnu/libpthread.so.0

$ perf list | grep libpthread

[…]

  sdt_libpthread:pthread_create                      [SDT event]

[…]


Then, turn SDT definitions into available tracepoints:


$ /usr/bin/sudo perf probe sdt_libpthread:pthread_create

Added new event:

  sdt_libpthread:pthread_create (on %pthread_create in /lib/powerpc64le-linux-gnu/libpthread-2.27.so)

You can now use it in all perf tools, such as:

    perf record -e sdt_libpthread:pthread_create -aR sleep 1

$ perf record -a -e sdt_libpthread:pthread_create ./test

[ perf record: Woken up 1 times to write data ]

[ perf record: Captured and wrote 0.199 MB perf.data (9 samples) ]


Note that any location in an application or library can be made into a tracepoint. To find functions in an application that can be made into tracepoints, use perf probe with –funcs:


$ perf probe –x ./load --funcs

[…]

main

sum_add

sum_sub


To enable the function main of the ./load application as a tracepoint:


/usr/bin/sudo perf probe –x ./load main

Added new event:

  probe_load:main      (on main in /home/pc/projects/load-2.1pc/load)

You can now use it in all perf tools, such as:

    perf record –e probe_load:main –aR sleep 1

$ perf list | grep load:main

  probe_load:main                                     [Tracepoint event]

$ perf record –e probe_load:main ./load

[ perf record: Woken up 1 times to write data ]

[ perf record: Captured and wrote 0.024 MB perf.data (1 samples) ]


perf script

Continuing the previous example, perf script can be used to walk through the perf.data file and output the contents of each record:


$ perf script

            Load 16356 [004] 80526.760310: probe_load:main: (4006a2)


Processing perf trace data

The preceding discussion and examples show that perf can collect the data required for system utilization analysis. However, how can that data be processed to produce the desired results?

perf eBPF

A relatively new and emerging technology with perf is called eBPF. BPF is an acronym for Berkeley Packet Filter, and it is a C-like language originally for, not surprisingly, network packet filtering in the kernel. eBPF is an acronym for extended BPF, a similar, but more robust C-like language based on BPF.
Recent versions of perf can be used to incorporate compiled eBPF code into the kernel to securely and intelligently handle events for any number of purposes, with some limitations.
The capability is very powerful and quite useful for real-time, continuous updates of event-related data and statistics.
However, as this capability is emerging, support is mixed on current releases of Linux distributions. It's a bit complicated (or, put differently, I have not figured it out yet). It's also only for online use; there is no offline capability. For these reasons, I won't cover it further here.

perf data file

perf record produces a perf.data file. The file is a structured binary file, is not particularly well documented, has no programming interface for access, and is unclear on what compatibility guarantees exist. For these reasons, I chose not to directly use the perf.data file.

perf script

One of the last examples above showed how perf script is used for walking through the perf.data file and emitting basic information about each record there. This is an appropriate model for what would be needed to process the file and track the state changes and compute the statistics required for system utilization analysis.
perf script has several modes of operation, including several higher-level scripts that come with perf that produce statistics based on the trace data in a perf.data file.


$ perf script -l

List of available trace scripts:

  rw-by-pid                            system-wide r/w activity

  rwtop [interval]                     system-wide r/w top

  wakeup-latency                       system-wide min/max/avg wakeup latency

  failed-syscalls [comm]               system-wide failed syscalls

  rw-by-file                    r/w activity for a program, by file

  failed-syscalls-by-pid [comm]        system-wide failed syscalls, by pid

  intel-pt-events                      print Intel PT Power Events and PTWRITE

  syscall-counts-by-pid [comm]         system-wide syscall counts, by pid

  export-to-sqlite [database name] [columns] [calls] export perf data to a sqlite3 database

  futex-contention                     futext contention measurement

  sctop [comm] [interval]              syscall top

  event_analyzing_sample               analyze all perf samples

  net_dropmonitor                      display a table of dropped frames

  compaction-times [-h] [-u] [-p|-pv] [-t | [-m] [-fs] [-ms]] [pid|pid-range|comm-regex] display time taken by mm compaction

  export-to-postgresql [database name] [columns] [calls] export perf data to a postgresql database

  stackcollapse                        produce callgraphs in short form for scripting use

  netdev-times [tx] [rx] [dev=] [debug] display a process of packet and processing time

  syscall-counts [comm]                system-wide syscall counts

  sched-migration                      sched migration overview

$ perf script failed-syscalls-by-pid /bin/ls


syscall errors:


comm [pid]                           count

------------------------------  ----------


ls [18683]

  syscall: access          

    err = ENOENT                         1

  syscall: statfs          

    err = ENOENT                         1

  syscall: ioctl          

    err = ENOTTY                         3


What do these scripts look like? Let's find out.


$ locate failed-syscalls-by-pid

/usr/libexec/perf-core/scripts/python/failed-syscalls-by-pid.py

[…]

$ rpm –qf /usr/libexec/perf-core/scripts/python/failed-syscalls-by-pid.py

perf-4.14.0-46.el7a.x86_64

$ $ ls /usr/libexec/perf-core/scripts

perl  python

$ perf script -s lang


Scripting language extensions (used in perf script -s [spec:]script.[spec]):


  Perl                                       [Perl]

  pl                                         [Perl]

  Python                                     [Python]

  py                                         [Python]


So, these scripts come with perf, and both Python and Perl are supported languages.
Note that for the entirety of this content, I will refer exclusively to Python.

perf scripts

How do these scripts do what they do? Here are important extracts from /usr/libexec/perf-core/scripts/python/failed-syscalls-by-pid.py:


def raw_syscalls__sys_exit(event_name, context, common_cpu,

        common_secs, common_nsecs, common_pid, common_comm,

        common_callchain,id, ret):

[]

        if ret <0:

[]

                        syscalls[common_comm][common_pid][id][ret] +=1


The function raw_syscalls__sys_exit has parameters for all the data for the associated event. The rest of the function only increments a counter associated with the command, process ID, and system call. The rest of the code doesn't do that much. Most of the complexity is in the function signature for the event-handling routine.
Fortunately, perf makes it easy to figure out the proper signatures for various tracepoint event-handling functions.

perf script –gen-script

For the raw_syscalls events, we can generate a trace containing just those events:


$ perf list | grep raw_syscalls

  raw_syscalls:sys_enter                             [Tracepoint event]

  raw_syscalls:sys_exit                              [Tracepoint event]

$ perf record -e 'raw_syscalls:*' /bin/ls >/dev/null

[ perf record: Woken up 1 times to write data ]

[ perf record: Captured and wrote 0.025 MB perf.data (176 samples) ]


We can then have perf generate a script that contains sample implementations of event-handling functions for the events in the perf.data file:


$ perf script --gen-script python

generated Python script: perf-script.py


What do we find in the script?


def raw_syscalls__sys_exit(event_name, context, common_cpu,

        common_secs, common_nsecs, common_pid, common_comm,

        common_callchain,id, ret):

[]

def raw_syscalls__sys_enter(event_name, context, common_cpu,

        common_secs, common_nsecs, common_pid, common_comm,

        common_callchain,id, args):


Both event-handling functions are specified with their signatures. Nice!
Note that this script works with perf script –s:


$ perf script -s ./perf-script.py

in trace_begin

raw_syscalls__sys_exit     7 94571.445908134    21117 ls                    id=0, ret=0

raw_syscalls__sys_enter     7 94571.445942946    21117 ls                    id=45, args=���?bc���?�

[…]


Now we have a template on which to base writing a Python script to parse the events of interest for reporting system utilization.

perf scripting

The Python scripts generated by perf script –gen-script are not directly executable. They must be invoked by perf:
$ perf script –s ./perf-script.py
What's really going on here?
  1. First, perf starts. The script subcommand's -s option indicates that an external script will be used.
  2. perf establishes a Python runtime environment.
  3. perf loads the specified script.
  4. perf runs the script. The script can perform normal initialization and even handle command line arguments, although passing the arguments is slightly awkward, requiring a -- separator between the arguments for perf and for the script:
    $ perf script -s ./perf-script.py -- --script-arg1 [...]
  5. perf processes each record of the trace file, calling the appropriate event-handling function in the script. Those event-handling functions can do whatever they need to do.

Utilization

It appears that perf scripting has sufficient capabilities for a workable solution. What sort of information is required to generate the statistics for system utilization?
  • Task creation (fork, pthread_create)
  • Task termination (exit)
  • Task replacement (exec)
  • Task migration, explicit or implicit, and current CPU
  • Task scheduling
  • System calls
  • Hypervisor calls
  • Interrupts
It can be helpful to understand what portion of time a task spends in various system calls, handling interrupts, or making explicit calls out to the hypervisor. Each of these categories of time can be considered a "state" for the task, and the methods of transitioning from one state to another need to be tracked:
The most important point of the diagram is that there are events for each state transition.
  • Task creation: clone system call
  • Task termination: sched:sched_process_exit
  • Task replacement: sched:sched_process_exec
  • Task migration: sched_setaffinity system call (explicit), sched:sched_migrate_task (implicit)
  • Task scheduling: sched:sched_switch
  • System calls: raw_syscalls:sys_enter, raw_syscalls:sys_exit
  • Hypervisor calls: (POWER-specific) powerpc:hcall_entry, powerpc:hcall_exit
  • Interrupts: irq:irq_handler_entry, irq:irq_handler_exit

The curt command for Linux

perf provides a suitable infrastructure with which to capture the necessary data for system utilization. There are a sufficient set of events available for tracing in the Linux kernel. The Python scripting capabilities permit a powerful and flexible means of processing the trace data. It's time to write the tool.

High-level design

In processing each event, the relevant state of the affected tasks must be updated:
  • New task? Create and initialize data structures to track the task's state
    • Command
    • Process ID
    • Task ID
    • Migration count (0)
    • Current CPU
  • New CPU for this task? Create and initialize data structures for CPU-specific data
    • User time (0)
    • System time (0)
    • Hypervisor time (0)
    • Interrupt time (0)
    • Idle time (0)
  • New transaction for this task? Create and initialize data structures for transaction-specific data
    • Elapsed time (0)
    • Count (0)
    • Minimum (maxint), maximum (0)
  • Existing task?
    • Accumulate time for the previous state
    • Transaction ending? Accumulate time for the transaction, adjust minimum, maximum values
  • Set new state
  • Save current time (time current state entered)
  • Migration? Increment migration count

High-level example

For a raw_syscalls:sys_enter event:
  • If this task has not been seen before, allocate and initialize a new task data structure
  • If the CPU is new for this task, allocate and initialize a new CPU data structure
  • If this system call is new for this task, allocate and initialize a new call data structure
  • In the task data structure:
    • Accumulate the time since the last state change in a bucket for the current state ("user")
    • Set the new state ("system")
    • Save the current timestamp as the start of this time period for the new state

Edge cases

sys_exit as a task's first event

If the first event in the trace for a task is raw_syscalls:sys_exit:
  • There is no matching raw_syscalls:sys_enter with which to determine the start time of this system call.
  • The accumulated time since the start of the trace was all spent in the system call and needs to be added to the overall elapsed time spent in all calls to this system call.
  • The elapsed time of this system call is unknown.
  • It would be inaccurate to account for this elapsed time in the average, minimum, or maximum statistics for this system call.
In this case, the tool creates a separate bucket called "pending" for time spent in the system call that cannot be accounted for in the average, minimum, or maximum.
A "pending" bucket is required for all transactional events (system calls, hypervisor calls, and interrupts).

sys_enter as a task's last event

Similarly, If the last event in the trace for a task is raw_syscalls:sys_enter:
  • There is no matching raw_syscalls:sys_exit with which to determine the end time of this system call.
  • The accumulated time from the start of the system call to the end of the trace was all spent in the system call and needs to be added to the overall elapsed time spent in all calls to this system call.
  • The elapsed time of this system call is unknown.
  • It would be inaccurate to account for this elapsed time in the average, minimum, or maximum statistics for this system call.
This elapsed time is also accumulated in the "pending" bucket.
A "pending" bucket is required for all transactional events (system calls, hypervisor calls, and interrupts).
Since this condition can only be discovered at the end of the trace, a final "wrap-up" step is required in the tool where the statistics for all known tasks are completed based on their final states.

Indeterminable state

It is possible that a very busy task (or a short trace) will never see an event for a task from which the task's state can be determined. For example, if only sched:sched_switch or sched:sched_task_migrate events are seen for a task, it is impossible to determine that task's state. However, the task is known to exist and to be running.
Since the actual state cannot be determined, the runtime for the task is accumulated in a separate bucket, arbitrarily called "busy-unknown." For completeness, this time is also displayed in the final report.

Invisible tasks

For very, very busy tasks (or a short trace), it is possible that a task was actively running during the entire time the trace was being collected, but no events for that task appear in the trace. It was never migrated, paused, or forced to wait.
Such tasks cannot be known to exist by the tool and will not appear in the report.

curt.py Python classes

Task

  • One per task
  • Holds all task-specific data (command, process ID, state, CPU, list of CPU data structures [see below], migration count, lists of per-call data structures [see below])
  • Maintains task state

Call

  • One per unique transaction, per task (for example, one for the "open" system call, one for the "close" system call, one for IRQ 27, etc.)
  • Holds call-specific data (e.g., start timestamp, count, elapsed time, minimum, maximum)
  • Allocated as needed (lazy allocation)
  • Stored within a task in a Python dictionary indexed by the unique identifier of the call (e.g., system call code, IRQ number, etc.)

CPU

  • One per CPU on which this task has been observed to be running
  • Holds per-CPU task data (e.g., user time, system time, hypervisor call time, interrupt time)
  • Allocated as needed (lazy allocation)
  • Stored within a task in a Python dictionary indexed by the CPU number

curt.py event processing example

As previously discussed, perf script will iterate over all events in the trace and call the appropriate event-handling function for each event.
A first attempt at an event-handling function for sys_exit, given the high-level example above, might be:


tasks ={}


def raw_syscalls__sys_enter(event_name, context, common_cpu, common_secs, common_nsecs, common_pid, common_comm, common_callchain,id, args):


  # convert the multiple timestamp values into a single value

  timestamp = nsecs(common_secs, common_nsecs)


  # find this task's data structure

  try:

    task = tasks[common_pid]

  except:

    # new task!

    task = Task()

    # save the command string

    task.comm= common_comm

    # save the new task in the global list (dictionary) of tasks

    tasks[common_pid]= task


  if common_cpu notin task.cpus:

    # new CPU!

    task.cpu= common_cpu

    task.cpus[common_cpu]= CPU()


  # compute time spent in the previous state ('user')

  delta = timestamp – task.timestamp

  # accumulate 'user' time for this task/CPU

  task.cpus[task.cpu].user += delta

  ifidnotin task.syscalls:

    # new system call for this task!

    task.syscalls[id]= Call()


  # change task's state

  task.mode='sys'


  # save the timestamp for the last event (this one) for this task

  task.timestamp= timestamp


def raw_syscalls__sys_exit(event_name, context, common_cpu, common_secs, common_nsecs, common_pid, common_comm, common_callchain,id, ret):


  # convert the multiple timestamp values into a single value

  timestamp = nsecs(common_secs, common_nsecs)


  # get the task data structure

  task = tasks[common_pid]


  # compute elapsed time for this system call

  delta = task.timestamp - timestamp


  # accumulate time for this task/system call

  task.syscalls[id].elapsed += delta

  # increment the tally for this task/system call

  task.syscalls[id].count +=1

  # adjust statistics

  if delta < task.syscalls[id].min:

    task.syscalls[id].min= delta

  if delta > task.syscalls[id].max:

    task.syscalls[id].max= delta


  # accumulate time for this task's state on this CPU

  task.cpus[common_cpu].system += delta


  # change task's state

  task.mode='user'


  # save the timestamp for the last event (this one) for this task

  task.timestamp= timestamp


Handling the edge cases

Following are some of the edge cases that are possible and must be handled.

Sys_exit as first event

As a system-wide trace can be started at an arbitrary time, it is certainly possible that the first event for a task is raw_syscalls:sys_exit. This requires adding the same code for new task discovery from the event-handling function for raw_syscalls:sys_enter to the handler for raw_syscalls:sys_exit. This:


  # get the task data structure

  task = tasks[common_pid]


becomes this:


  # find this task's data structure

  try:

    task = tasks[common_pid]

  except:

    # new task!

    task = Task()

    # save the command string

    task.comm= common_comm

    # save the new task in the global list (dictionary) of tasks

    tasks[common_pid]= task


Another issue is that it is impossible to properly accumulate the data for this system call since there is no timestamp for the start of the system call. The time from the start of the trace until this event has been spent by this task in the system call. It would be inaccurate to ignore this time. It would also be inaccurate to incorporate this time such that it is used to compute the average, minimum, or maximum. The only reasonable option is to accumulate this separately, calling it "pending" system time. To accurately compute this time, the timestamp of the first event of the trace must be known. Since any event could be the first event in the trace, every event must conditionally save its timestamp if it is the first event. A global variable is required:
start_timestamp =0
And every event-handling function must conditionally save its timestamp:


  # convert the multiple timestamp values into a single value

  timestamp = nsecs(common_secs, common_nsecs)


  If start_timestamp =0:

    start_timestamp = timestamp


So, the event-handling function for raw_syscalls:sys_exit becomes:


def raw_syscalls__sys_exit(event_name, context, common_cpu, common_secs, common_nsecs, common_pid, common_comm, common_callchain,id, ret):


  # convert the multiple timestamp values into a single value

  timestamp = nsecs(common_secs, common_nsecs)


  If start_timestamp =0:

    start_timestamp = timestamp


  # find this task's data structure

  try:

    task = tasks[common_pid]


    # compute elapsed time for this system call

    delta = task.timestamp - timestamp


    # accumulate time for this task/system call

    task.syscalls[id].elapsed += delta

    # increment the tally for this task/system call

    task.syscalls[id].count +=1

    # adjust statistics

    if delta < task.syscalls[id].min:

      task.syscalls[id].min= delta

    if delta > task.syscalls[id].max:

      task.syscalls[id].max= delta


  except:

    # new task!

    task = Task()

    # save the command string

    task.comm= common_comm

    # save the new task in the global list (dictionary) of tasks

    tasks[common_pid]= task


    # compute elapsed time for this system call

    delta = start_timestamp - timestamp


    # accumulate time for this task/system call

    task.syscalls[id].pending += delta


  # accumulate time for this task's state on this CPU

  task.cpus[common_cpu].system += delta


  # change task's state

  task.mode='user'


  # save the timestamp for the last event (this one) for this task

  task.timestamp= timestamp


Sys_enter as last event

A similar issue to having sys_exit as the first event for a task is when sys_enter is the last event seen for a task. The time spent in the system call must be accumulated for completeness but can't accurately impact the average, minimum, nor maximum. This time will also be accumulated in for a separate "pending" state.
To accurately determine the elapsed time of the pending system call, from sys_entry to the end of the trace period, the timestamp of the final event in the trace file is required. Unfortunately, there is no way to know which event is the last event until that event has already been processed. So, all events must save their respective timestamps in a global variable.
It may be that many tasks are in the state where the last event seen for them was sys_enter. Thus, after the last event is processed, a final "wrap up" step is required to complete the statistics for those tasks. Fortunately, there is a trace_end function which is called by perf after the final event has been processed.
Last, we need to save the id of the system call in everysys_enter.


curr_timestamp =0


def raw_syscalls__sys_enter(event_name, context, common_cpu, common_secs, common_nsecs, common_pid, common_comm, common_callchain,id, args):


  # convert the multiple timestamp values into a single value

  curr_timestamp = nsecs(common_secs, common_nsecs)

[]

  task.syscall=id

[]


def trace_end():

        for tid in tasks.keys():

                task = tasks[tid]

                # if this task ended while executing a system call

                if task.mode=='sys':

                        # compute the time from the entry to the system call to the end of the trace period

                        delta = curr_timestamp - task.timestamp

                        # accumulate the elapsed time for this system call

                        task.syscalls[task.syscall].pending += delta

                        # accumulate the system time for this task/CPU

                        task.cpus[task.cpu].sys += delta


Migrations

A task migration is when a task running on one CPU is moved to another CPU. This can happen by either:
  1. Explicit request (e.g., a call to sched_setaffinity), or
  2. Implicitly by the kernel (e.g., load balancing or vacating a CPU being taken offline)
When detected:
  • The migration count for the task should be incremented
  • The statistics for the previous CPU should be updated
  • A new CPU data structure may need to be updated and initialized if the CPU is new for the task
  • The task's current CPU is set to the new CPU
For accurate statistics, task migrations must be detected as soon as possible. The first case, explicit request, happens within a system call and can be detected in the sys_exit event for that system call. The second case has its own event, sched:sched_migrate_task, so it will need a new event-handling function.


def raw_syscalls__sys_exit(event_name, context, common_cpu, common_secs, common_nsecs, common_pid, common_comm, common_callchain,id, ret):


  # convert the multiple timestamp values into a single value

  timestamp = nsecs(common_secs, common_nsecs)


  If start_timestamp =0:

    start_timestamp = timestamp


  # find this task's data structure

  try:

    task = tasks[common_pid]


    # compute elapsed time for this system call

    delta = task.timestamp - timestamp


    # accumulate time for this task/system call

    task.syscalls[id].elapsed += delta

    # increment the tally for this task/system call

    task.syscalls[id].count +=1

    # adjust statistics

    if delta < task.syscalls[id].min:

      task.syscalls[id].min= delta

    if delta > task.syscalls[id].max:

      task.syscalls[id].max= delta


  except:

    # new task!

    task = Task()

    # save the command string

    task.comm= common_comm

    # save the new task in the global list (dictionary) of tasks

    tasks[common_pid]= task


    task.cpu= common_cpu


    # compute elapsed time for this system call

    delta = start_timestamp - timestamp


    # accumulate time for this task/system call

    task.syscalls[id].pending += delta


  If common_cpu != task.cpu:

    task.migrations +=1

    # divide the time spent in this syscall in half...

    delta /=2

    # and give have to the previous CPU, below, and half to the new CPU, later

    task.cpus[task.cpu].system += delta


  # accumulate time for this task's state on this CPU

  task.cpus[common_cpu].system += delta


  # change task's state

  task.mode='user'


  # save the timestamp for the last event (this one) for this task

  task.timestamp= timestamp


def sched__sched_migrate_task(event_name, context, common_cpu,

        common_secs, common_nsecs, common_pid, common_comm,

        common_callchain, comm, pid, prio, orig_cpu,

        dest_cpu, perf_sample_dict):


  If start_timestamp =0:

    start_timestamp = timestamp


  # find this task's data structure

  try:

    task = tasks[common_pid]

  except:

    # new task!

    task = Task()

    # save the command string

    task.comm= common_comm

    # save the new task in the global list (dictionary) of tasks

    tasks[common_pid]= task


    task.cpu= common_cpu


    If common_cpu notin task.cpus:

      task.cpus[common_cpu]= CPU()


    task.migrations +=1


Task creation

To accurately collect statistics for a task, it is essential to know when the task is created. Tasks can be created with fork(), which creates a new process, or pthread_create(), which creates a new task within the same process. Fortunately, both are manifested by a clone system call and made evident by a sched:sched_process_fork event. The lifetime of the task starts at the sched_process_fork event. The edge case that arises is that the first likely events for the new task are:
  1. sched_switch when the new task starts running. The new task should be considered idle at creation until this event occurs
  2. sys_exit for the clone system call. The initial state of the new task needs to be based on the state of the task that creates it, including being within the clone system call.
One edge case that must be handled is if the creating task (parent) is not yet known, it must be created and initialized, and the presumption is that it has been actively running since the start of the trace.


def sched__sched_process_fork(event_name, context, common_cpu,

        common_secs, common_nsecs, common_pid, common_comm,

        common_callchain, parent_comm, parent_pid, child_comm, child_pid):

  global start_timestamp, curr_timestamp

  curr_timestamp =self.timestamp

  if(start_timestamp ==0):

    start_timestamp = curr_timestamp

  # find this task's data structure

  try:

    task = tasks[common_pid]

  except:

    # new task!

    task = Task()

    # save the command string

    task.comm= common_comm

    # save the new task in the global list (dictionary) of tasks

    tasks[common_pid]= task

  try:

    parent = tasks[self.parent_tid]

  except:

    # need to create parent task here!

    parent = Task(start_timestamp,self.command,'sys',self.pid)

    parent.sched_stat=True# ?

    parent.cpu=self.cpu

    parent.cpus[parent.cpu]= CPU()

    tasks[self.parent_tid]= parent


    task.resume_mode= parent.mode

    task.syscall= parent.syscall

    task.syscalls[task.syscall]= Call()

    task.syscalls[task.syscall].timestamp=self.timestamp


Task exit

Similarly, for complete and accurate task statistics, it is essential to know when a task has terminated. There's an event for that: sched:sched_process_exit. This one is pretty easy to handle, in that the effort is just to close out the statistics and set the mode appropriately, so any end-of-trace processing will not think the task is still active:


def sched__sched_process_exit_old(event_name, context, common_cpu,

        common_secs, common_nsecs, common_pid, common_comm,

        common_callchain, comm, pid, prio):

  global start_timestamp, curr_timestamp

  curr_timestamp =self.timestamp

  if(start_timestamp ==0):

    start_timestamp = curr_timestamp


  # find this task's data structure

  try:

    task = tasks[common_pid]

  except:

    # new task!

    task = Task()

    # save the command string

    task.comm= common_comm

    task.timestamp= curr_timestamp

    # save the new task in the global list (dictionary) of tasks

    tasks[common_pid]= task


  delta = timestamp – task.timestamp

  task.sys += delta

  task.mode='exit'


Output

What follows is an example of the report displayed by curt, slightly reformatted to fit on a narrower page width and with the idle-time classification data (which makes the output very wide) removed, and for brevity. Seen are two processes, 1497 and 2857. Process 1497 has two tasks, 1497 and 1523. Each task has a per-CPU summary and system-wide ("ALL" CPUs) summary. Each task's data is followed by the system call data for that task (if any), hypervisor call data (if any), and interrupt data (if any). After each process's respective tasks is a per-process summary.  Process 2857 has a task 2857-0 that is the previous task image before an exec() system call replaced the process image. After all processes is a system-wide summary.


1497:

-- [  task] command     cpu      user       sys       irq        hv      busy      idle |  util% moves

   [  1497] X             2  0.076354  0.019563  0.000000  0.000000  0.000000 15.818719 |   0.6%

   [  1497] X           ALL  0.076354  0.019563  0.000000  0.000000  0.000000 15.818719 |   0.6%     0


  -- ( ID)name             count   elapsed      pending      average      minimum      maximum

     (  0)read                 2  0.004699     0.000000     0.002350     0.002130     0.002569

     (232)epoll_wait           1  9.968375     5.865208     9.968375     9.968375     9.968375


-- [  task] command     cpu      user       sys       irq        hv      busy      idle |  util% moves

   [  1523] InputThread   1  0.052598  0.037073  0.000000  0.000000  0.000000 15.824965 |   0.6%

   [  1523] InputThread ALL  0.052598  0.037073  0.000000  0.000000  0.000000 15.824965 |   0.6%     0


  -- ( ID)name             count   elapsed      pending      average      minimum      maximum

     (  0)read                14  0.011773     0.000000     0.000841     0.000509     0.002185

     (  1)write                2  0.010763     0.000000     0.005381     0.004974     0.005789

     (232)epoll_wait           1  9.966649     5.872853     9.966649     9.966649     9.966649


-- [  task] command     cpu      user       sys       irq        hv      busy      idle |  util% moves

   [   ALL]             ALL  0.128952  0.056636  0.000000  0.000000  0.000000 31.643684 |   0.6%     0


2857:

-- [  task] command     cpu      user       sys       irq        hv      busy      idle |  util% moves

   [  2857] execs.sh      1  0.257617  0.249685  0.000000  0.000000  0.000000  0.266200 |  65.6%

   [  2857] execs.sh      2  0.000000  0.023951  0.000000  0.000000  0.000000  0.005728 |  80.7%

   [  2857] execs.sh      5  0.313509  0.062271  0.000000  0.000000  0.000000  0.344279 |  52.2%

   [  2857] execs.sh      6  0.136623  0.128883  0.000000  0.000000  0.000000  0.533263 |  33.2%

   [  2857] execs.sh      7  0.527347  0.194014  0.000000  0.000000  0.000000  0.990625 |  42.1%

   [  2857] execs.sh    ALL  1.235096  0.658804  0.000000  0.000000  0.000000  2.140095 |  46.9%     4


  -- ( ID)name             count   elapsed      pending      average      minimum      maximum

     (  9)mmap                15  0.059388     0.000000     0.003959     0.001704     0.017919

     ( 14)rt_sigprocmask      12  0.006391     0.000000     0.000533     0.000431     0.000711

     (  2)open                 9  2.253509     0.000000     0.250390     0.008589     0.511953

     (  3)close                9  0.017771     0.000000     0.001975     0.000681     0.005245

     (  5)fstat                9  0.007911     0.000000     0.000879     0.000683     0.001182

     ( 10)mprotect             8  0.052198     0.000000     0.006525     0.003913     0.018073

     ( 13)rt_sigaction         8  0.004281     0.000000     0.000535     0.000458     0.000751

     (  0)read                 7  0.197772     0.000000     0.028253     0.000790     0.191028

     ( 12)brk                  5  0.003766     0.000000     0.000753     0.000425     0.001618

     (  8)lseek                3  0.001766     0.000000     0.000589     0.000469     0.000818


-- [  task] command     cpu      user       sys       irq        hv      busy      idle |  util% moves

   [2857-0] perf          6  0.053925  0.191898  0.000000  0.000000  0.000000  0.827263 |  22.9%

   [2857-0] perf          7  0.000000  0.656423  0.000000  0.000000  0.000000  0.484107 |  57.6%

   [2857-0] perf        ALL  0.053925  0.848321  0.000000  0.000000  0.000000  1.311370 |  40.8%     1


  -- ( ID)name             count   elapsed      pending      average      minimum      maximum

     (  0)read                 0  0.000000     0.167845           --           --           --

     ( 59)execve               0  0.000000     0.000000           --           --           --


ALL:

-- [  task] command     cpu      user       sys       irq        hv      busy      idle |  util% moves

   [   ALL]             ALL 10.790803 29.633170  0.160165  0.000000  0.137747 54.449823 |   7.4%    50


  -- ( ID)name             count   elapsed      pending      average      minimum      maximum

     (  1)write             2896  1.623985     0.000000     0.004014     0.002364     0.041399

     (102)getuid            2081  3.523861     0.000000     0.001693     0.000488     0.025157

     (142)sched_setparam     691  7.222906    32.012841     0.024925     0.002024     0.662975

     ( 13)rt_sigaction       383  0.235087     0.000000     0.000614     0.000434     0.014402

     (  8)lseek              281  0.169157     0.000000     0.000602     0.000452     0.013404

     (  0)read               133  2.782795     0.167845     0.020923     0.000509     1.864439

     (  7)poll                96  8.583354   131.889895     0.193577     0.000626     4.596280

     (  4)stat                93  7.036355     1.058719     0.183187     0.000981     3.661659

     ( 47)recvmsg             85  0.146644     0.000000     0.001725     0.000646     0.019067

     (  3)close               79  0.171046     0.000000     0.002165     0.000428     0.020659

     (  9)mmap                78  0.311233     0.000000     0.003990     0.001613     0.017919

     (186)gettid              74  0.067315     0.000000     0.000910     0.000403     0.014075

     (  2)open                71  3.081589     0.213059     0.184248     0.001921     0.937946

     (202)futex               62  5.145112   164.286154     0.405566     0.000597    11.587437


  -- ( ID)name             count   elapsed      pending      average      minimum      maximum

     ( 12)i8042               10  0.160165     0.000000     0.016016     0.010920     0.032805


Total Trace Time: 15.914636 ms


Hurdles and issues

Following are some of the issues encountered in the development of curt.

Out-of-order events

One of the more challenging issues is the discovery that events in a perf.data file can be out of time order. For a program trying to monitor state transitions carefully, this is a serious issue. For example, a trace could include the following sequence of events, displayed as they appear in the trace file:


time 0000:  sys_enter syscall1

time 0007:  sys_enter syscall2

time 0006:  sys_exit syscall1

time 0009:  sys_exit syscall2


Just blindly processing these events in the order they are presented to their respective event-handling functions (in the wrong time order) will result in incorrect statistics (or worse).
The most user-friendly ways to handle out-of-order events include:
  • Prevent traces from having out-of-order events in the first place by changing the way perf record works
  • Providing a means to reorder events in a trace file, perhaps by enhancing perf inject
  • Modifying how perf script works to present the events to the event-handling functions in time order
But user-friendly is not the same as straightforward, nor easy. Also, none of the above are in the user's control.
I chose to implement a queue for incoming events that would be sufficiently deep to allow for proper reordering of all events. This required a significant redesign of the code, including implementation of classes for each event, and moving the event processing for each event type into a method in that event's class.
In the redesigned code, the actual event handlers' only job is to save the relevant data from the event into an instance of the event class, queue it, then process the top (oldest in time) event from the queue:


def raw_syscalls__sys_enter(event_name, context, common_cpu, common_secs, common_nsecs, common_pid, common_comm, common_callchain,id, args):

         event = Event_sys_enter(nsecs(common_secs,common_nsecs), common_cpu, common_pid, common_comm,id)

        process_event(event)


The simple reorderable queuing mechanism is in a common function:


events =[]

n_events =0

def process_event(event):

        global events,n_events,curr_timestamp

        i = n_events

        while i >0and events[i-1].timestamp> event.timestamp:

                i = i-1

        events.insert(i,event)

        if n_events < params.window:

                n_events = n_events+1

        else:

                event = events[0]

                # need to delete from events list now,

                # because event.process() could reenter here

                del events[0]

                if event.timestamp< curr_timestamp:

                        sys.stderr.write("Error: OUT OF ORDER events detected.\n Try increasing the size of the look-ahead window with --window=\n")

                event.process()


Note that the size of the queue is configurable, primarily for performance and to limit memory consumption. The function will report when that queue size is insufficient to eliminate out-of-order events. It is worth considering whether to consider this case a catastrophic failure and elect to terminate the program.
Implementing a class for each event type led to some consideration for refactoring, such that common code could coalesce into a base class:


class Event (object):


        def__init__(self):

                self.timestamp=0

                self.cpu=0

                self.tid=0

                self.command='unknown'

                self.mode='unknown'

                self.pid=0


        def process(self):

                global start_timestamp


                try:

                        task = tasks[self.tid]

                        if task.pid=='unknown':

                                tasks[self.tid].pid=self.pid

                except:

                        task = Task(start_timestamp,self.command,self.mode,self.pid)

                        tasks[self.tid]= task


                ifself.cpunotin task.cpus:

                        task.cpus[self.cpu]= CPU()

                        if task.cpu=='unknown':

                                task.cpu=self.cpu


                ifself.cpu!= task.cpu:

                        task.cpu=self.cpu

                        task.migrations +=1


                return task


Then a class for each event type would be similarly constructed:


class Event_sys_enter ( Event ):


        def__init__(self, timestamp, cpu, tid, comm,id, pid):

                self.timestamp= timestamp

                self.cpu= cpu

                self.tid= tid

                self.command= comm

                self.id=id

                self.pid= pid

                self.mode='busy-unknown'


        def process(self):

                global start_timestamp, curr_timestamp

                curr_timestamp =self.timestamp

                if(start_timestamp ==0):

                        start_timestamp = curr_timestamp


                task =super(Event_sys_enter,self).process()


                if task.mode=='busy-unknown':

                        task.mode='user'

                        for cpu in task.cpus:

                                task.cpus[cpu].user= task.cpus[cpu].busy_unknown

                                task.cpus[cpu].busy_unknown=0


                task.syscall=self.id

                ifself.idnotin task.syscalls:

                        task.syscalls[self.id]= Call()


                task.syscalls[self.id].timestamp= curr_timestamp

                task.change_mode(curr_timestamp,'sys')


Further refactoring is evident above, as well, moving the common code that updates relevant statistics based on a task's state change and the state change itself into a change_mode method of the Task class.

Start-of-trace timestamp

As mentioned above, for scripts that depend on elapsed time, there should be an easier way to get the first timestamp in the trace other than forcing every event-handling function to conditionally save its timestamp as the start-of-trace timestamp.

Awkward invocation

The syntax for invoking a perf Python script, including script parameters, is slightly awkward:
$ perf script –s ./curt.py -- --window=80
Also, it's awkward that perf Python scripts are not themselves executable.
The curt.py script was made directly executable and will invoke perf, which will in turn invoke the script. Implementation is a bit confusing but it's easy to use:
$ ./curt.py --window=80
This script must detect when it has been directly invoked. The Python environment established by perf is a virtual module from which the perf Python scripts import:


try:

        from perf_trace_context import *


If this import fails, the script was directly invoked. In this case, the script will exec perf, specifying itself as the script to run, and passing along any command line parameters:


except:

        iflen(params.file_or_command)==0:

                params.file_or_command=["perf.data"]

        sys.argv=['perf','script','-i'] + params.file_or_command + ['-s',sys.argv[0]]

        sys.argv.append('--')

        sys.argv +=['--window',str(params.window)]

        if params.debug:

                sys.argv.append('--debug')

        sys.argv +=['--api',str(params.api)]

        if params.debug:

                printsys.argv

        os.execvp("perf",sys.argv)

        sys.exit(1)


In this way, the script can not only be run directly, it can still be run by using the perf script command.

Simultaneous event registration required

An artifact of the way perf enables events can lead to unexpected trace data. For example, specifying:
$ perf record –a –e raw_syscalls:sys_enter –e raw_syscalls:sys_exit ./command
Will result in a trace file that begins with the following series of events for a single task (the perf command itself):


sys_enter

sys_enter

sys_enter


This happens because perf will register the sys_enter event for every CPU on the system (because of the -a argument), then it will register the sys_exit event for every CPU. In the latter case, since the sys_enter event has already been enabled for each CPU, that event shows up in the trace; but since the sys_exit has not been enabled on each CPU until after the call returns, the sys_exit call does not show up in the trace. The reverse issue happens at the end of the trace file, with a series of sys_exit events in the trace because the sys_enter event has already been disabled.
The solution to this issue is to group the events, which is not well documented:
$ perf record –e '{raw_syscalls:sys_enter,raw_syscalls:sys_exit}' ./command
With this syntax, the sys_enter and sys_exit events are enabled simultaneously.

Awkward recording step

There are a lot of different events required for computation of the full set of statistics for tasks. This leads to a very long, complicated command for recording:
$ 
perf record -e
'{raw_syscalls:*,sched:sched_switch,sched:sched_migrate_task,sched:sched_process_exec,sched:sched_process_fork,sched:sched_process_exit,sched:sched_stat_runtime,sched:sched_stat_wait,sched:sched_stat_sleep,sched:sched_stat_blocked,sched:sched_stat_iowait,powerpc:hcall_entry,powerpc:hcall_exit}'
-a *command --args*
The solution to this issue is to enable the script to perform the record step itself, by itself invoking perf. A further enhancement is to proceed after the recording is complete and report the statistics from that recording:


if params.record:

        # [ed. Omitting here the list of events for brevity]

        eventlist ='{' + eventlist + '}'# group the events

        command =['perf','record','--quiet','--all-cpus',

                '--event', eventlist ] + params.file_or_command

        if params.debug:

                print command

        subprocess.call(command)


The command syntax required to record and report becomes:
$ ./curt.py --record ./command

Process IDs and perf API change

Process IDs are treated a bit cavalierly by perf scripting. Note well above that one of the common parameters for the generated event-handling functions is named common_pid. This is not the process ID, but the task ID. In fact, on many current Linux-based distributions, there is no way to determine a task's process ID from within a perf Python script. This presents a serious problem for a script that wants to compute statistics for a process.
Fortunately, in Linux kernel v4.14, an additional parameter was provided to each of the event-handling functions—perf_sample_dict—a dictionary from which the process ID could be extracted: (perf_sample_dict['sample']['pid']).
Unfortunately, current Linux distributions may not have that version of the Linux kernel. If the script is written to expect that extra parameter, the script will fail and report an error:
TypeError: irq__irq_handler_exit_new() takes exactly 11 arguments (10 given)
Ideally, a means to automatically discover if the additional parameter is passed would be available to permit a script to easily run with both the old and new APIs and to take advantage of the new API if it is available. Unfortunately, such a means is not readily apparent.
Since there is clearly value in using the new API to determine process-wide statistics, curt provides a command line option to use the new API. curt then takes advantage of Python's lazy function binding to adjust, at run-time, which API to use:


if params.api==1:

        dummy_dict ={}

        dummy_dict['sample']={}

        dummy_dict['sample']['pid']='unknown'

        raw_syscalls__sys_enter = raw_syscalls__sys_enter_old

        []

else:

        raw_syscalls__sys_enter = raw_syscalls__sys_enter_new

        []


This requires two functions for each event:


def raw_syscalls__sys_enter_new(event_name, context, common_cpu, common_secs, common_nsecs, common_pid, common_comm, common_callchain,id, args, perf_sample_dict):


        event = Event_sys_enter(nsecs(common_secs,common_nsecs), common_cpu, common_pid, common_comm,id, perf_sample_dict['sample']['pid'])

        process_event(event)


def raw_syscalls__sys_enter_old(event_name, context, common_cpu, common_secs, common_nsecs, common_pid, common_comm, common_callchain,id, args):

        global dummy_dict

        raw_syscalls__sys_enter_new(event_name, context, common_cpu, common_secs, common_nsecs, common_pid, common_comm, common_callchain,id, args, dummy_dict)


Note that the event-handling function for the older API will make use of the function for the newer API, passing a statically defined dictionary containing just enough data such that accessing it as perf_sample_dict['sample']['pid'] will work (resulting in 'unknown').

Events reported on other CPUs

Not all events that refer to a task are reported from a CPU on which the task is running. This could result in an artificially high migration count and other incorrect statistics. For these types of events (sched_stat), the event CPU is ignored.

Explicit migrations (no sched_migrate event)

While there is conveniently an event for when the kernel decides to migrate a task from one CPU to another, there is no event for when the task requests a migration on its own. These are effected by system calls (sched_setaffinity), so the sys_exit event handler must compare the event CPU to the task's CPU, and if different, presume a migration has occurred. (This is described above, but repeated here in the "issues" section for completeness.)

Mapping system call IDs to names is architecture-specific

System calls are identified in events only as unique numeric identifiers. These identifiers are not readily interpreted by humans in the report. These numeric identifiers are not readily mapped to their mnemonics because they are architecture-specific, and new system calls can be added in newer kernels. Fortunately, perf provides a means to map system call numeric identifiers to system call names. A simple example follows:


from Util import syscall_name

def raw_syscalls__sys_enter(event_name, context, common_cpu,

        common_secs, common_nsecs, common_pid, common_comm,

        common_callchain,id, args, perf_sample_dict):

                print"%s id=%d" % (syscall_name(id),id)


Unfortunately, using syscall_name introduces a dependency on the audit python bindings. This dependency is being removed in upstream versions of perf.

Mapping hypervisor call IDs to names is non-existent

Similar to system calls, hypervisor calls are also identified only with numeric identifiers. For IBM's POWER hypervisor, they are statically defined. Unfortunately, perf does not provide a means to map hypervisor call identifiers to mnemonics. curt includes a (hardcoded) function to do just that:


hcall_to_name ={

        '0x4':'H_REMOVE',

        '0x8':'H_ENTER',     

        '0xc':'H_READ',     

        '0x10':'H_CLEAR_MOD',

[]

}


def hcall_name(opcode):

        try:

                return hcall_to_name[hex(opcode)]

        except:

                returnstr(opcode)


Command strings as bytearrays

perf stores command names and string arguments in Python bytearrays. Unfortunately, printing bytearrays in Python prints every character in the bytearray—even if the string is null-terminated. For example:


$ perf record –a –e 'sched:sched_switch' sleep 3

$ perf script –g Python

generated Python script: perf-script.py

$ perf script -s ./perf-script.py

in trace_begin

sched__sched_switch      3 664597.912692243    21223 perf                
 prev_comm=perf^@-terminal-^@, prev_pid=21223, prev_prio=120,
prev_state=, next_comm=migration/3^@^@^@^@^@, next_pid=23, next_prio=0

[…]


One solution is to truncate the length of these bytearrays based on null termination, as needed before printing:


def null(ba):

        null = ba.find('\x00')

        if null >=0:

                ba = ba[0:null]

        return ba


def sched__sched_switch(event_name, context, common_cpu,

        common_secs, common_nsecs, common_pid, common_comm,

        common_callchain, prev_comm, prev_pid, prev_prio, prev_state,

        next_comm, next_pid, next_prio, perf_sample_dict):


                print"prev_comm=%s, prev_pid=%d, prev_prio=%d, " \

                "prev_state=%s, next_comm=%s, next_pid=%d, " \

                "next_prio=%d" % \

                (null(prev_comm), prev_pid, prev_prio,

                flag_str("sched__sched_switch","prev_state", prev_state),

                null(next_comm), next_pid, next_prio)


Which nicely cleans up the output:
sched__sched_switch
     3 664597.912692243    21223 perf                  prev_comm=perf,
prev_pid=21223, prev_prio=120, prev_state=, next_comm=migration/3,
next_pid=23, next_prio=0

Dynamic mappings, like IRQ number to name

Dissimilar to system calls and hypervisor calls, interrupt numbers (IRQs) are dynamically assigned by the kernel on demand, so there can't be a static table mapping an IRQ number to a name. Fortunately, perf passes the name to the event's irq_handler_entry routine. This allows a script to create a dictionary that maps the IRQ number to a name:


irq_to_name ={}

def irq__irq_handler_entry_new(event_name, context, common_cpu, common_secs, common_nsecs, common_pid, common_comm, common_callchain, irq, name, perf_sample_dict):

        irq_to_name[irq]= name

        event = Event_irq_handler_entry(nsecs(common_secs,common_nsecs), common_cpu, common_pid, common_comm, irq, name, getpid(perf_sample_dict))

        process_event(event)


Somewhat oddly, perf does not pass the name to the irq_handler_exit routine. So, it is possible that a trace may only see an irq_handler_exit for an IRQ and must be able to tolerate that. Here, instead of mapping the IRQ to a name, the IRQ number is returned as a string instead:


def irq_name(irq):

        if irq in irq_to_name:

                return irq_to_name[irq]

        returnstr(irq)


Task 0

Task 0 shows up everywhere. It's not a real task. It's a substitute for the "idle" state. It's the task ID given to the sched_switch event handler when the CPU is going to (or coming from) the "idle" state. It's often the task that is "interrupted" by interrupts. Tracking the statistics for task 0 as if it were a real task would not make sense. Currently, curt ignores task 0. However, this loses some information, like some time spent in interrupt processing. curt should, but currently doesn't, track interesting (non-idle) time for task 0.

Spurious sched_migrate_task events (same CPU)

Rarely, a sched_migrate_task event occurs in which the source and target CPUs are the same. In other words, the task is not migrated. To avoid artificially inflated migration counts, this case must be explicitly ignored:


class Event_sched_migrate_task (Event):

        def process(self):

[]

                ifself.cpu==self.dest_cpu:

                        return


exec

The semantics of the exec system call are that the image of the current process is replaced by a completely new process image without changing the process ID. This is awkward for tracking the statistics of a process (really, a task) based on the process (task) ID. The change is significant enough that the statistics for each task should be accumulated separately, so the current task's statistics need to be closed out and a new set of statistics should be initialized. The challenge is that both the old and new tasks have the same process (task) ID. curt addresses this by tagging the task's task ID with a numeric suffix:


class Event_sched_process_exec (Event):

  def process(self):

    global start_timestamp, curr_timestamp

    curr_timestamp =self.timestamp

    if(start_timestamp ==0):

      start_timestamp = curr_timestamp


    task =super(Event_sched_process_exec,self).process()


    new_task = Task(self.timestamp,self.command, task.mode,self.pid)

    new_task.sched_stat=True

    new_task.syscall= task.syscall

    new_task.syscalls[task.syscall]= Call()

    new_task.syscalls[task.syscall].timestamp=self.timestamp


    task.change_mode(curr_timestamp,'exit')


    suffix=0

    whileTrue:

      old_tid =str(self.tid)+"-"+str(suffix)

      if old_tid in tasks:

        suffix +=1

      else:

        break


    tasks[old_tid]= tasks[self.tid]


    del tasks[self.tid]


    tasks[self.tid]= new_task


This will clearly separate the statistics for the different process images. In the example below, the perf command (task "9614-0") exec'd exec.sh (task "9614-1"), which in turn exec'd itself (task "9614"):


-- [  task] command   cpu      user       sys       irq        hv      busy      idle |  util% moves

    [  9614] execs.sh    4  1.328238  0.485604  0.000000  0.000000  0.000000  2.273230 |  44.4%

    [  9614] execs.sh    7  0.000000  0.201266  0.000000  0.000000  0.000000  0.003466 |  98.3%

    [  9614] execs.sh  ALL  1.328238  0.686870  0.000000  0.000000  0.000000  2.276696 |  47.0%     1


-- [  task] command   cpu      user       sys       irq        hv      busy      idle |  util% moves

    [9614-0] perf        3  0.000000  0.408588  0.000000  0.000000  0.000000  2.298722 |  15.1%

    [9614-0] perf        4  0.059079  0.028269  0.000000  0.000000  0.000000  0.611355 |  12.5%

    [9614-0] perf        5  0.000000  0.067626  0.000000  0.000000  0.000000  0.004702 |  93.5%

    [9614-0] perf      ALL  0.059079  0.504483  0.000000  0.000000  0.000000  2.914779 |  16.2%     2


-- [  task] command   cpu      user       sys       irq        hv      busy      idle |  util% moves

    [9614-1] execs.sh    3  1.207972  0.987433  0.000000  0.000000  0.000000  2.435908 |  47.4%

    [9614-1] execs.sh    4  0.000000  0.341152  0.000000  0.000000  0.000000  0.004147 |  98.8%

    [9614-1] execs.sh  ALL  1.207972  1.328585  0.000000  0.000000  0.000000  2.440055 |  51.0%     1


Distribution support

Surprisingly, there is currently no support for perf's Python bindings in Ubuntu. Follow the saga for more detail.

Limit on number of traced events

As curt gets more sophisticated, it is likely that more and more events may be required to be included in the trace file. perf currently requires one file descriptor per event per CPU. This becomes a problem when the maximum number of open file descriptors is not a large multiple of the number of CPUs on the system. On systems with large numbers of CPUs, this quickly becomes a problem. For example, the default maximum number of open file descriptors is often 1,024. An IBM POWER8 system with four sockets may have 12 cores per socket and eight threads (CPUs) per core. Such a system has 4 * 12 * 8 = 392 CPUs. In that case, perf could trace only about two events! A workaround is to (significantly) increase the maximum number of open file descriptors (ulimit –n if the system administrator has configured the hard limits high enough; or the administrator can set the limits higher in /etc/security/limits.conf for nofile).

Summary

I hope this article shows the power of perf—and specifically the utility and flexibility of the Python scripting enabled with perf—to perform sophisticated processing of kernel trace data. Also, it shows some of the issues and edge cases that can be encountered when the boundaries of such technologies are tested.
Please feel free to download and make use of the curt tool described here, report problems, suggest improvements, or contribute code of your own on the curt GitHub page.

How To Mount OneDrive In Linux Using Rclone (Supports Business And Personal Accounts)

$
0
0
https://www.linuxuprising.com/2018/07/how-to-mount-onedrive-in-linux-using.html

Microsoft OneDrive doesn't have an official client application for Linux, but you can access your OneDrive files from a file manager on Linux thanks to a third-party tool called Rclone. This article explains how to mount OneDrive in Linux using Rclone.


OneDrive mounted Linux

Microsoft OneDrive (previously SkyDive) is a cloud storage / file synchronization service, part of the Office Online suite. It offers 5 GB of storage free of charge, with additional storage available with a paid subscription.

Rclone is "rsync for cloud storage". It can synchronize files not only from your filesystem to the cloud (and the other way around), but also from one cloud storage service to another. The tool supports a wide variety of cloud storage services, from Google Drive to Amazon Drive and S3, ownCloud, Yandex Disk, and many others.

Besides on demand file synchronization, Rclone supports mounting any supported cloud storage systems as a file system with FUSE. While this feature exists for some time, it's still considered experimental, so use it with care.

After mounting Microsoft OneDrive, you'll be able to access it from your file manager, be it Nautilus (Files), Nemo, Caja, etc. The behavior is similar to the one explained on our article about Google Drive: Mounting Google Drive On Xfce Or MATE Desktops (Ubuntu, Linux Mint). As a side note, you can also use Rclone to mount Google Drive in Linux.

Rclone supports OneDrive for Business / Office 365. However, if the organization is in an unmanaged state (not verified by the domain owner), you won't be able to mount OneDrive using Rclone with FUSE. Such accounts can be used with Sharepoint though. See this page for more information.

OneDrive Rclone mount limitations:

  • Any files deleted with Rclone are moved to the trash because Microsoft doesn't provide an API to permanently delete files or empty the trash
  • OneDrive is case insensitive, so you can't have two files with the same names but different cases in the same folder (example: MyFile.txt and myfile.txt can't be in the same folder).
  • OneDrive doesn't support some characters that are not allowed in filenames on Windows operating systems. Rclone maps these characters to identical looking Unicode equivalents, like ? to

Also, renaming folders doesn't seem to work, at least on my system. I'm not sure if this is a Rclone issue or limitation, since Rclone is supposed to support renaming folders in general.

These instructions should work not only on any Linux distribution (from Ubuntu, Linux Mint, or Debian, to Arch Linux, Fedora, openSUSE, and so on), but also on FreeBSD and macOS. It even works on Windows but you'll need WinFsp.

Related: Cryptomator Secures Your Cloud Storage Data (Open Source, Multi-Platform Client-Side Encryption Tool)

Mount OneDrive as a file system in Linux using Rclone


1. Install Rclone.

You can download Rclone binaries from here. For Linux you'll find generic binaries, as well as DEB and RPM binaries.

I don't recommend installing the Rclone Snap package (even if you use Ubuntu), because it fails to find the fusermount executable, even if it's installed with --classic. When using the Snap package, you'll get an error similar to the one below when trying to mount a cloud storage service supported by Rclone:

failed to mount FUSE fs: fusermount: exec: "fusermount": executable file not found in $PATH

This was apparently fixed a while back but it looks like the issue occurs again.

2. Add a new OneDrive remote to Rclone. The instructions below may seem long but it only takes a few seconds to set it up.

To start adding the OneDrive remote to Rclone, use this command to enter the Rclone configuration mode:

rclone config

Rclone will display a list of options from which you need to select the New remote option by entering n and pressing the Enter key:

$ rclone config
Current remotes:

Name Type
==== ====
mega mega

e) Edit existing remote
n) New remote
d) Delete remote
r) Rename remote
c) Copy remote
s) Set configuration password
q) Quit config
e/n/d/r/c/s/q> n

Next, it will prompt you to enter a name for the new remote. Enter the name you want to use (I'm using onedrive as the name in these instructions):

name> onedrive

After pressing the Enter key, a list of supported cloud storage services is displayed. You need to select the Microsoft OneDrive option by entering its corresponding number (16 right now but it may change in the future):

Type of storage to configure.
Choose a number from below, or type in your own value
1 / Alias for a existing remote
\ "alias"
2 / Amazon Drive
\ "amazon cloud drive"
3 / Amazon S3 Compliant Storage Providers (AWS, Ceph, Dreamhost, IBM COS, Minio)
\ "s3"
4 / Backblaze B2
\ "b2"
5 / Box
\ "box"
6 / Cache a remote
\ "cache"
7 / Dropbox
\ "dropbox"
8 / Encrypt/Decrypt a remote
\ "crypt"
9 / FTP Connection
\ "ftp"
10 / Google Cloud Storage (this is not Google Drive)
\ "google cloud storage"
11 / Google Drive
\ "drive"
12 / Hubic
\ "hubic"
13 / Local Disk
\ "local"
14 / Mega
\ "mega"
15 / Microsoft Azure Blob Storage
\ "azureblob"
16 / Microsoft OneDrive
\ "onedrive"

17 / OpenDrive
\ "opendrive"
18 / Openstack Swift (Rackspace Cloud Files, Memset Memstore, OVH)
\ "swift"
19 / Pcloud
\ "pcloud"
20 / QingCloud Object Storage
\ "qingstor"
21 / SSH/SFTP Connection
\ "sftp"
22 / Webdav
\ "webdav"
23 / Yandex Disk
\ "yandex"
24 / http Connection
\ "http"
Storage> 16

For the next two steps, press Enter without entering any information since there's no need to enter the Microsoft App Client ID or Secret:

Microsoft App Client Id - leave blank normally.
client_id>
Microsoft App Client Secret - leave blank normally.
client_secret>

Now you can choose the OneDrive account type (enter b for Business or p for Personal OneDrive accounts):

Remote config
Choose OneDrive account type?
* Say b for a OneDrive business account
* Say p for a personal OneDrive account
b) Business
p) Personal
b/p> p

Depending on your setup, you'll have to enter auto configuration or manual for the next step. For desktop users, type y to use the auto configuration:

Use auto config?
* Say Y if not sure
* Say N if you are working on a remote or headless machine
y) Yes
n) No
y/n> y

A new tab should open in your default web browser, asking you to give Rclone access to your OneDrive account. Allow it and you can close the tab.

Rclone runs a webserver on your local machine (on port 53682) to retrieve the authentication token. You may need to unblock it temporarily if you use a firewall.

Now you'll need to check if everything is correct and save the settings by typing y:


[onedrive]
type = onedrive
client_id =
client_secret =
token = {"access_token":"GoKSt5YMioiuCWX1KOuo8QT0Fwy+Y6ZeX7M","token_type":"bearer","refresh_token":"7OMvoEAO3l*8BbhS2AMxpTbJW0Y6np9cdql!bwEdYAhJ6XBG0tnR0UK","expiry":"2018-07-26T15:15:13.696368366+03:00"}
--------------------
y) Yes this is OK
e) Edit this remote
d) Delete this remote
y/e/d> y

And finally, exit the Rclone configuration by typing q:

Current remotes:

Name Type
==== ====
onedrive onedrive

e) Edit existing remote
n) New remote
d) Delete remote
r) Rename remote
c) Copy remote
s) Set configuration password
q) Quit config
e/n/d/r/c/s/q> q

3. Create a new folder on your system that will be used to mount Microsoft OneDrive.

I suggest creating a folder called OneDrive in your home directory. The instructions below will be using this as the mount point (~/OneDrive).

4. Mount OneDrive (with Rclone using FUSE) as a file system.

To mount Microsoft OneDrive using Rclone, use this command:

rclone --vfs-cache-mode writes mount onedrive: ~/OneDrive

Where onedrive is the name of the Rclone remote, followed by : (we've used exactly onedrive in the instructions above so you can use precisely that for the command), and ~/OneDrive is the folder where you want to mount OneDrive on your system.

The mount command uses --vfs-cache-mode writes because according to the Rclone documentation, "many applications won't work with their files on an Rclone mount" without this or --vfs-cache-mode full. The Rclone file caching section explains this in detail.

You can stop and unmount it by pressing Ctrl + C to close Rclone.

5. (Optional) Mount OneDrive on system startup

To mount OneDrive on startup, open Startup Applications. This depends on the desktop environment you're using so I'll list some of them below and how to access startup applications to add a new entry:

  • Gnome / Unity: search for Startup Applications in the Dash / applications thingy, and in Startup Applications click Add
  • Xfce: launch Session and Startup from the menu, go to the Application Autostart tab and click Add
  • MATE: launch Startup Applications from the menu, and click Add

After clicking Add, use the following:

  • Name: Rclone OneDrive Mount
  • Command: sh -c "rclone --vfs-cache-mode writes mount onedrive: ~/OneDrive"

There are other ways of mounting OneDrive automatically, like adding a line in your /etc/fstab file, using systemd, etc. As a starting point you can use the examples from google-drive-ocamlfuse, as they should also work for Rclone.

How to Flush the DNS Cache on Linux

$
0
0
https://www.maketecheasier.com/flush-dns-cache-linux


There is no single standard for DNS servers on Linux. Each distribution uses something different, so you’ll need to see which one is running on your system. Of course, it doesn’t hurt to just try these and see which works. The procedure is nearly the same.
Most modern distributions are running either “systemd-resolve” or “nscd.” There is a chance, though, that you might be working with “dnsmasq” or “BIND.” In any case, flushing the cache is usually as simple as restarting whichever daemon is running.
Ubuntu and other Debian-based distributions are probably running systemd-resolve. It’s a convenient DNS daemon that’s built in to systemd, which your system already utilizes for a ton of things. If you are running Ubuntu, everything is already set up and ready to go. Clear your cache by telling systemd to flush it.
Flush DNS Cache Systemd
That’s all there is to it. You can check whether it worked by asking for the statistics.
DNS Cache Stats Systemd
If you see a zero by the cache size, you’ve successfully flushed your system’s cache.
Flush DNS Cache NSCD
If you’re running a different distribution, there’s a good chance it’s using nscd. It’s the choice of the Red Hat distributions and Arch Linux. This one is just as easy to use. You only need to restart the service to clear out the cache.
dnsmasq is another option. It’s more common on servers than it is on desktop machines, but it is still often used. Dnsmasq is great for local DNS servers, and it’s often used on routers. Like with nscd, you only need to restart the service.
Finally, BIND is a more traditional option. Not a lot of distributions use it by default, but you certainly might encounter it. BIND is still used for purpose-built DNS servers.
Whichever DNS service your computer is running, you shouldn’t have any problem clearing your DNS cache. Restarting most DNS servers is an easy fix. For Debian-based distributions, you can use a built-in function in systemd to clear your cache. In all cases, the process is simple, and it doesn’t require a restart of your whole system.

9 Productivity Tools for Linux That Are Worth Your Attention

$
0
0
https://www.fossmint.com/linux-productivity-tools


Linux Productivity Tools
Written by Marina Pilipenko
There are so many distractions and unproductive activities that affect our performance at the workplace, and so many methods to increase focus and work efficiency. If you’re looking for a way to improve your productivity and stay organized, consider using special software to create a productive work environment.
We’ve collected a list of productivity tools for Linux platforms that you probably haven’t heard about. They will help you with:
  • blocking out distractions;
  • keeping track of how you spend your work time;
  • automating manual work;
  • reminding of important to-dos;
  • organize and structure knowledge;
  • and much more.

1. FocusWriter

FocusWriter is a text processor that creates a distraction-free environment for writers. It supports popular text formats and uses a hide-away interface to block out all distractions. You can select any visual and sound theme that works best for your productivity, and focus on your work. FocusWriter also allows you to set daily goals, use timers, alarms, and look into statistics.
FocusWriter Text Processor for Linux
The tool can be installed on various Unix platforms and also provides an option of portable mode. Its source code is also available at the developer’s website.

2. actiTIME

actiTIME is a time-tracking and work management tool for companies of any size and self-employed individuals. Alongside with its cloud-hosted version, a self-hosted edition for Unix systems is available that can be installed on a personal computer or on a company’s internal server.
actiTIME Tracking Tool for Linux
The tool helps get accurate records of work and leave time and run reports based on that data to measure your personal productivity and your team’s performance. It also allows to approve and lock timesheets, calculate billable amounts, and issue invoices. Its work management features include organizing project teams, granting project assignments, and configuring email alerts on upcoming deadlines, worked out time estimates, overrun project budget, and other events.

3. LastPass

Anyone knows the pain of having forgotten a password. Those who prefer not to use the same password for all services, will definitely appreciate LastPass. It works in your browser and helps manage passwords easily and securely – and stop spending time on useless attempts to remember them all. Besides, it helps create secure and easy to read passwords.
LastPass Password Manager for Linux
The tool is available for Linux platforms as a universal installer and as an addition to specific web browsers.

4. f.lux

Those who work late at night know the negative effect of the blue screen light on productivity, health and energy. Experts say it’s better not to work at night, but if quitting this is not an option, a special tool that adapts screen light to the environment can help.
System Display Color Temperature
Available for various mobile and desktop platforms, f.lux automatically adjusts the light of your computer or smartphone screen to the lighting. To set it up, you need to choose your location and configure lighting type in the app’s settings. After that, the light from your devices’ screens will dynamically adjust to the environment, decreasing its negative effects.

5. Simplenote

Simplenote is a free tool for keeping notes and sharing them across all your devices. It is available for various desktop platforms and mobile devices. If you’re using Simplenote on several devices, your notes are automatically kept synced and updated on all of them.
Simplenote Note Taking Software
The tool offers collaboration features. You can post instructions, publish your thoughts, or share lists with your friends, coworkers or family. If you’re using Simplenote frequently and keep many notes in it, its tags and quick search will be of help. The app helps you stay productive and organized and never miss an important reminder.

6. Osmo

Osmo is a personal organizer. It includes various modules: calendar, notes, tasks list and reminder, and contacts. It is a lightweight and easy to use tool for managing all important personal information. The app can run both in an open window or in the background mode, and it doesn’t need an Internet connection.
Osmo Personal Organizer Software
Osmo offers various configuration and formatting options for different types of information you record in it: addresses, birthdays, ideas, events, etc. Its handy search allows to find and access necessary information quickly and easily.

7. FreeMind

FreeMind is a free mind-mapping software for Linux platforms. It helps structure knowledge, brainstorm and develop new ideas, and prioritize your to-dos. The tool allows users to create multi-level structures that visually represent ideas, workflows, or knowledge.
FreeMind - Mind Mapping Software
FreeMind – Mind Mapping Software
The tool is great for writers, developers, researchers, students and other people who need to collect and structure large amounts of information. To view and process your mind maps in other software, FreeMind supports export of maps to HTML files that can be opened with any web browser.

8. Autokey

Autokey is an automation utility available for various Linux distributions that allows to create and manage collections of scripts and phrases, and assign abbreviations or hotkeys to them. This helps speed up typing large parts of text or automate executing scripts in any program that you’re using on your computer.
Linux Desktop Automation Software
Phrases are stored as plain text and scripts as plain Python files, so you can edit them in any text editor. You can collect them in folders and assign a hotkey or abbreviation to show the contents of the folder as a popup menu. The tool also allows you to exclude some hotkeys or abbreviations from triggering in specific applications. Autokey can help automate literally any task that can be performed with mouse and keyboard.

9. Catfish

Catfish is a file searching tool for Linux platforms. It speeds up your work with files on your machine, saving your time for productive work. The tool handles your search queries using technologies that are already included in your system, and shows results in a graphic interface.
Linux File Searching Tool
Simple and powerful, the tool offers advanced search options: searching through hidden files, enabling or disabling search through file content, changing views, etc. It is a good option when you don’t feel like opening a terminal and locating a file using a find command.
Hope this was helpful! In this article, we’ve collected productivity tools for Linux that cover the most important aspects of productivity. If we have missed something, let us know using the feedback form below.

The evolution of package managers

$
0
0
https://opensource.com/article/18/7/evolution-package-managers

Package managers play an important role in Linux software management. Here's how some of the leading players compare.

The evolution of package managers
Image by : 
opensource.com
x

Get the newsletter

Join the 85,000 open source advocates who receive our giveaway alerts and article roundups.
Every computerized device uses some form of software to perform its intended tasks. In the early days of software, products were stringently tested for bugs and other defects. For the last decade or so, software has been released via the internet with the intent that any bugs would be fixed by applying new versions of the software. In some cases, each individual application has its own updater. In others, it is left up to the user to figure out how to obtain and upgrade software.
Linux adopted early the practice of maintaining a centralized location where users could find and install software. In this article, I'll discuss the history of software installation on Linux and how modern operating systems are kept up to date against the never-ending torrent of CVEs.

How was software on Linux installed before package managers?

Historically, software was provided either via FTP or mailing lists (eventually this distribution would grow to include basic websites). Only a few small files contained the instructions to create a binary (normally in a tarfile). You would untar the files, read the readme, and as long as you had GCC or some other form of C compiler, you would then typically run a ./configure script with some list of attributes, such as pathing to library files, location to create new binaries, etc. In addition, the configure process would check your system for application dependencies. If any major requirements were missing, the configure script would exit and you could not proceed with the installation until all the dependencies were met. If the configure script completed successfully, a Makefile would be created.
Once a Makefile existed, you would then proceed to run the make command (this command is provided by whichever compiler you were using). The make command has a number of options called make flags, which help optimize the resulting binaries for your system. In the earlier days of computing, this was very important because hardware struggled to keep up with modern software demands. Today, compilation options can be much more generic as most hardware is more than adequate for modern software.
Finally, after the make process had been completed, you would need to run make install (or sudo make install) in order to actually install the software. As you can imagine, doing this for every single piece of software was time-consuming and tedious—not to mention the fact that updating software was a complicated and potentially very involved process.

What is a package?

Packages were invented to combat this complexity. Packages collect multiple data files together into a single archive file for easier portability and storage, or simply compress files to reduce storage space. The binaries included in a package are precompiled with according to the sane defaults the developer chosen. Packages also contain metadata, such as the software's name, a description of its purpose, a version number, and a list of dependencies necessary for the software to run properly.
Several flavors of Linux have created their own package formats. Some of the most commonly used package formats include:
  • .deb: This package format is used by Debian, Ubuntu, Linux Mint, and several other derivatives. It was the first package type to be created.
  • .rpm: This package format was originally called Red Hat Package Manager. It is used by Red Hat, Fedora, SUSE, and several other smaller distributions.
  • .tar.xz: While it is just a compressed tarball, this is the format that Arch Linux uses.
While packages themselves don't manage dependencies directly, they represented a huge step forward in Linux software management.

What is a software repository?

A few years ago, before the proliferation of smartphones, the idea of a software repository was difficult for many users to grasp if they were not involved in the Linux ecosystem. To this day, most Windows users still seem to be hardwired to open a web browser to search for and install new software. However, those with smartphones have gotten used to the idea of a software "store." The way smartphone users obtain software and the way package managers work are not dissimilar. While there have been several attempts at making an attractive UI for software repositories, the vast majority of Linux users still use the command line to install packages. Software repositories are a centralized listing of all of the available software for any repository the system has been configured to use. Below are some examples of searching a repository for a specifc package (note that these have been truncated for brevity):
Arch Linux with aurman


user@arch ~ $  aurman -Ss kate


extra/kate 18.04.2-2 (kde-applications kdebase)

    Advanced Text Editor

aur/kate-root 18.04.0-1 (11, 1.139399)

    Advanced Text Editor, patched to be able to run as root

aur/kate-git r15288.15d26a7-1 (1, 1e-06)

    An advanced editor component which is used in numerous KDE applications requiring a text editing component


CentOS 7 using YUM


[user@centos ~]$ yum search kate


kate-devel.x86_64 : Development files for kate

kate-libs.x86_64 : Runtime files for kate

kate-part.x86_64 : Kate kpart plugin


Ubuntu using APT


user@ubuntu ~ $ apt search kate

Sorting... Done

Full Text Search... Done


kate/xenial 4:15.12.3-0ubuntu2 amd64

  powerful text editor


kate-data/xenial,xenial 4:4.14.3-0ubuntu4 all

  shared data files for Kate text editor


kate-dbg/xenial 4:15.12.3-0ubuntu2 amd64

  debugging symbols for Kate


kate5-data/xenial,xenial 4:15.12.3-0ubuntu2 all

  shared data files for Kate text editor


What are the most prominent package managers?

As suggested in the above output, package managers are used to interact with software repositories. The following is a brief overview of some of the most prominent package managers.

RPM-based package managers

Updating RPM-based systems, particularly those based on Red Hat technologies, has a very interesting and detailed history. In fact, the current versions of yum (for enterprise distributions) and DNF (for community) combine several open source projects to provide their current functionality.
Initially, Red Hat used a package manager called RPM (Red Hat Package Manager), which is still in use today. However, its primary use is to install RPMs, which you have locally, not to search software repositories. The package manager named up2date was created to inform users of updates to packages and enable them to search remote repositories and easily install dependencies. While it served its purpose, some community members felt that up2date had some significant shortcomings.
The current incantation of yum came from several different community efforts. Yellowdog Updater (YUP) was developed in 1999-2001 by folks at Terra Soft Solutions as a back-end engine for a graphical installer of Yellow Dog Linux. Duke University liked the idea of YUP and decided to improve upon it. They created Yellowdog Updater, Modified (yum) which was eventually adapted to help manage the university's Red Hat Linux systems. Yum grew in popularity, and by 2005 it was estimated to be used by more than half of the Linux market. Today, almost every distribution of Linux that uses RPMs uses yum for package management (with a few notable exceptions).

Working with yum

In order for yum to download and install packages out of an internet repository, files must be located in /etc/yum.repos.d/ and they must have the extension .repo. Here is an example repo file:


[local_base]

name=Base CentOS  (local)

baseurl=http://7-repo.apps.home.local/yum-repo/7/

enabled=1

gpgcheck=0


This is for one of my local repositories, which explains why the GPG check is off. If this check was on, each package would need to be signed with a cryptographic key and a corresponding key would need to be imported into the system receiving the updates. Because I maintain this repository myself, I trust the packages and do not bother signing them.
Once a repository file is in place, you can start installing packages from the remote repository. The most basic command is yum update, which will update every package currently installed. This does not require a specific step to refresh the information about repositories; this is done automatically. A sample of the command is shown below:


[user@centos ~]$ sudo yum update

Loaded plugins: fastestmirror, product-id, search-disabled-repos, subscription-manager

local_base                             | 3.6 kB  00:00:00    

local_epel                             | 2.9 kB  00:00:00    

local_rpm_forge                        | 1.9 kB  00:00:00    

local_updates                          | 3.4 kB  00:00:00    

spideroak-one-stable                   | 2.9 kB  00:00:00    

zfs                                    | 2.9 kB  00:00:00    

(1/6): local_base/group_gz             | 166 kB  00:00:00    

(2/6): local_updates/primary_db        | 2.7 MB  00:00:00    

(3/6): local_base/primary_db           | 5.9 MB  00:00:00    

(4/6): spideroak-one-stable/primary_db |  12 kB  00:00:00    

(5/6): local_epel/primary_db           | 6.3 MB  00:00:00    

(6/6): zfs/x86_64/primary_db           |  78 kB  00:00:00    

local_rpm_forge/primary_db             | 125 kB  00:00:00    

Determining fastest mirrors

Resolving Dependencies

--> Running transaction check


If you are sure you want yum to execute any command without stopping for input, you can put the -y flag in the command, such as yum update -y.
Installing a new package is just as easy. First, search for the name of the package with yum search:


[user@centos ~]$ yum search kate


artwiz-aleczapka-kates-fonts.noarch : Kates font in Artwiz family

ghc-highlighting-kate-devel.x86_64 : Haskell highlighting-kate library development files

kate-devel.i686 : Development files for kate

kate-devel.x86_64 : Development files for kate

kate-libs.i686 : Runtime files for kate

kate-libs.x86_64 : Runtime files for kate

kate-part.i686 : Kate kpart plugin


Once you have the name of the package, you can simply install the package with sudo yum install kate-devel -y. If you installed a package you no longer need, you can remove it with sudo yum remove kate-devel -y. By default, yum will remove the package plus its dependencies.
There may be times when you do not know the name of the package, but you know the name of the utility. For example, suppose you are looking for the utility updatedb, which creates/updates the database used by the locate command. Attempting to install updatedb returns the following results:


[user@centos ~]$ sudo yum install updatedb

Loaded plugins: fastestmirror, langpacks

Loading mirror speeds from cached hostfile

No package updatedb available.

Error: Nothing to do


You can find out what package the utility comes from by running:


[user@centos ~]$ yum whatprovides *updatedb

Loaded plugins: fastestmirror, langpacks

Loading mirror speeds from cached hostfile


bacula-director-5.2.13-23.1.el7.x86_64 : Bacula Director files

Repo        : local_base

Matched from:

Filename    : /usr/share/doc/bacula-director-5.2.13/updatedb


mlocate-0.26-8.el7.x86_64 : An utility for finding files by name

Repo        : local_base

Matched from:

Filename    : /usr/bin/updatedb


The reason I have used an asterisk * in front of the command is because yum whatprovides uses the path to the file in order to make a match. Since I was not sure where the file was located, I used an asterisk to indicate any path.
There are, of course, many more options available to yum. I encourage you to view the man page for yum for additional options.
Dandified Yum (DNF) is a newer iteration on yum. Introduced in Fedora 18, it has not yet been adopted in the enterprise distributions, and as such is predominantly used in Fedora (and derivatives). Its usage is almost exactly the same as that of yum, but it was built to address poor performance, undocumented APIs, slow/broken dependency resolution, and occasional high memory usage. DNF is meant as a drop-in replacement for yum, and therefore I won't repeat the commands—wherever you would use yum, simply substitute dnf.

Working with Zypper

Zypper is another package manager meant to help manage RPMs. This package manager is most commonly associated with SUSE (and openSUSE) but has also seen adoption by MeeGo, Sailfish OS, and Tizen. It was originally introduced in 2006 and has been iterated upon ever since. There is not a whole lot to say other than Zypper is used as the back end for the system administration tool YaST and some users find it to be faster than yum.
Zypper's usage is very similar to that of yum. To search for, update, install or remove a package, simply use the following:


zypper search kate

zypper update

zypper install kate

zypper remove kate


Some major differences come into play in how repositories are added to the system with zypper. Unlike the package managers discussed above, zypper adds repositories using the package manager itself. The most common way is via a URL, but zypper also supports importing from repo files.


suse:~ # zypper addrepo http://download.videolan.org/pub/vlc/SuSE/15.0 vlc

Adding repository 'vlc' [done]

Repository 'vlc' successfully added


Enabled     : Yes

Autorefresh : No

GPG Check   : Yes

URI         : http://download.videolan.org/pub/vlc/SuSE/15.0

Priority    : 99


You remove repositories in a similar manner:


suse:~ # zypper removerepo vlc

Removing repository 'vlc' ...................................[done]

Repository 'vlc' has been removed.


Use the zypper repos command to see what the status of repositories are on your system:


suse:~ # zypper repos

Repository priorities are without effect. All enabled repositories share the same priority.


#  | Alias                     | Name                                    | Enabled | GPG Check | Refresh

---+---------------------------+-----------------------------------------+---------+-----------+--------

 1 | repo-debug                | openSUSE-Leap-15.0-Debug                | No      | ----      | ----  

 2 | repo-debug-non-oss        | openSUSE-Leap-15.0-Debug-Non-Oss        | No      | ----      | ----  

 3 | repo-debug-update         | openSUSE-Leap-15.0-Update-Debug         | No      | ----      | ----  

 4 | repo-debug-update-non-oss | openSUSE-Leap-15.0-Update-Debug-Non-Oss | No      | ----      | ----  

 5 | repo-non-oss              | openSUSE-Leap-15.0-Non-Oss              | Yes     | ( p) Yes  | Yes    

 6 | repo-oss                  | openSUSE-Leap-15.0-Oss                  | Yes     | ( p) Yes  | Yes    


zypper even has a similar ability to determine what package name contains files or binaries. Unlike YUM, it uses a hyphen in the command (although this method of searching is deprecated):


localhost:~ # zypper what-provides kate

Command 'what-provides' is replaced by 'search --provides --match-exact'.

See 'help search' for all available options.

Loading repository data...

Reading installed packages...


S  | Name | Summary              | Type      

---+------+----------------------+------------

i+ | Kate | Advanced Text Editor | application

i  | kate | Advanced Text Editor | package  


As with YUM and DNF, Zypper has a much richer feature set than covered here. Please consult with the official documentation for more in-depth information.

Debian-based package managers

One of the oldest Linux distributions currently maintained, Debian's system is very similar to RPM-based systems. They use .deb packages, which can be managed by a tool called dpkg. dpkg is very similar to rpm in that it was designed to manage packages that are available locally. It does no dependency resolution (although it does dependency checking), and has no reliable way to interact with remote repositories. In order to improve the user experience and ease of use, the Debian project commissioned a project called Deity. This codename was eventually abandoned and changed to Advanced Package Tool (APT).
Released as test builds in 1998 (before making an appearance in Debian 2.1 in 1999), many users consider APT one of the defining features of Debian-based systems. It makes use of repositories in a similar fashion to RPM-based systems, but instead of individual .repo files that yum uses, apt has historically used /etc/apt/sources.list to manage repositories. More recently, it also ingests files from /etc/apt/sources.d/. Following the examples in the RPM-based package managers, to accomplish the same thing on Debian-based distributions you have a few options. You can edit/create the files manually in the aforementioned locations from the terminal, or in some cases, you can use a UI front end (such as Software & Updates provided by Ubuntu et al.). To provide the same treatment to all distributions, I will cover only the command-line options. To add a repository without directly editing a file, you can do something like this:
user@ubuntu:~$ sudo apt-add-repository "deb http://APT.spideroak.com/ubuntu-spideroak-hardy/ release restricted"
This will create a spideroakone.list file in /etc/apt/sources.list.d. Obviously, these lines change depending on the repository being added. If you are adding a Personal Package Archive (PPA), you can do this:
user@ubuntu:~$ sudo apt-add-repository ppa:gnome-desktop
NOTE: Debian does not support PPAs natively.
After a repository has been added, Debian-based systems need to be made aware that there is a new location to search for packages. This is done via the apt-get update command:


user@ubuntu:~$ sudo apt-get update

Get:1 http://security.ubuntu.com/ubuntu xenial-security InRelease [107 kB]

Hit:2 http://APT.spideroak.com/ubuntu-spideroak-hardy release InRelease

Hit:3 http://ca.archive.ubuntu.com/ubuntu xenial InRelease

Get:4 http://ca.archive.ubuntu.com/ubuntu xenial-updates InRelease [109 kB]              

Get:5 http://security.ubuntu.com/ubuntu xenial-security/main amd64 Packages [517 kB]

Get:6 http://security.ubuntu.com/ubuntu xenial-security/main i386 Packages [455 kB]      

Get:7 http://security.ubuntu.com/ubuntu xenial-security/main Translation-en [221 kB]    

...


Fetched 6,399 kB in 3s (2,017 kB/s)                                          

Reading package lists... Done


Now that the new repository is added and updated, you can search for a package using the apt-cache command:


user@ubuntu:~$ apt-cache search kate

aterm-ml - Afterstep XVT - a VT102 emulator for the X window system

frescobaldi - Qt4 LilyPond sheet music editor

gitit - Wiki engine backed by a git or darcs filestore

jedit - Plugin-based editor for programmers

kate - powerful text editor

kate-data - shared data files for Kate text editor

kate-dbg - debugging symbols for Kate

katepart - embeddable text editor component


To install kate, simply run the corresponding install command:
user@ubuntu:~$ sudo apt-get install kate
To remove a package, use apt-get remove:
user@ubuntu:~$ sudo apt-get remove kate
When it comes to package discovery, APT does not provide any functionality that is similar to yum whatprovides. There are a few ways to get this information if you are trying to find where a specific file on disk has come from.
Using dpkg


user@ubuntu:~$ dpkg -S /bin/ls

coreutils: /bin/ls


Using apt-file


user@ubuntu:~$ sudo apt-get install apt-file -y


user@ubuntu:~$ sudo apt-file update


user@ubuntu:~$ apt-file search kate


The problem with apt-file search is that it, unlike yum whatprovides, it is overly verbose unless you know the exact path, and it automatically adds a wildcard search so that you end up with results for anything with the word kate in it:


kate: /usr/bin/kate

kate: /usr/lib/x86_64-linux-gnu/qt5/plugins/ktexteditor/katebacktracebrowserplugin.so

kate: /usr/lib/x86_64-linux-gnu/qt5/plugins/ktexteditor/katebuildplugin.so

kate: /usr/lib/x86_64-linux-gnu/qt5/plugins/ktexteditor/katecloseexceptplugin.so

kate: /usr/lib/x86_64-linux-gnu/qt5/plugins/ktexteditor/katectagsplugin.so


Most of these examples have used apt-get. Note that most of the current tutorials for Ubuntu specifically have taken to simply using apt. The single apt command was designed to implement only the most commonly used commands in the APT arsenal. Since functionality is split between apt-get, apt-cache, and other commands, apt looks to unify these into a single command. It also adds some niceties such as colorization, progress bars, and other odds and ends. Most of the commands noted above can be replaced with apt,  but not all Debian-based distributions currently receiving security patches support using apt by default, so you may need to install additional packages.

Arch-based package managers

Arch Linux uses a package manager called pacman. Unlike .deb or .rpm files, pacman uses a more traditional tarball with the LZMA2 compression (.tar.xz). This enables Arch Linux packages to be much smaller than other forms of compressed archives (such as gzip). Initially released in 2002, pacman has been steadily iterated and improved. One of the major benefits of pacman is that it supports the Arch Build System, a system for building packages from source. The build system ingests a file called a PKGBUILD, which contains metadata (such as version numbers, revisions, dependencies, etc.) as well as a shell script with the required flags for compiling a package conforming to the Arch Linux requirements. The resulting binaries are then packaged into the aforementioned .tar.xz file for consumption by pacman.
This system led to the creation of the Arch User Repository (AUR) which is a community-driven repository containing PKGBUILD files and supporting patches or scripts. This allows for a virtually endless amount of software to be available in Arch. The obvious advantage of this system is that if a user (or maintainer) wishes to make software available to the public, they do not have to go through official channels to get it accepted in the main repositories. The downside is that it relies on community curation similar to Docker Hub, Canonical's Snap packages, or other similar mechanisms. There are numerous AUR-specific package managers that can be used to download, compile, and install from the PKGBUILD files in the AUR (we will look at this later).

Working with pacman and official repositories

Arch's main package manager, pacman, uses flags instead of command words like yum and apt. For example, to search for a package, you would use pacman -Ss. As with most commands on Linux, you can find both a manpage and inline help. Most of the commands for pacman use the sync (-S) flag. For example:


user@arch ~ $ pacman -Ss kate


extra/kate 18.04.2-2 (kde-applications kdebase)

    Advanced Text Editor

extra/libkate 0.4.1-6 [installed]

    A karaoke and text codec for embedding in ogg

extra/libtiger 0.3.4-5 [installed]

    A rendering library for Kate streams using Pango and Cairo

extra/ttf-cheapskate 2.0-12

    TTFonts collection from dustimo.com

community/haskell-cheapskate 0.1.1-100

    Experimental markdown processor.


Arch also uses repositories similar to other package managers. In the output above, search results are prefixed with the repository they are found in (extra/ and community/ in this case). Similar to both Red Hat and Debian-based systems, Arch relies on the user to add the repository information into a specific file. The location for these repositories is /etc/pacman.conf. The example below is fairly close to a stock system. I have enabled the [multilib] repository for Steam support:


[options]

Architecture = auto


Color

CheckSpace


SigLevel    = Required DatabaseOptional

LocalFileSigLevel = Optional


[core]

Include = /etc/pacman.d/mirrorlist


[extra]

Include = /etc/pacman.d/mirrorlist


[community]

Include = /etc/pacman.d/mirrorlist


[multilib]

Include = /etc/pacman.d/mirrorlist


It is possible to specify a specific URL in pacman.conf. This functionality can be used to make sure all packages come from a specific point in time. If, for example, a package has a bug that affects you severely and it has several dependencies, you can roll back to a specific point in time by adding a specific URL into your pacman.conf and then running the commands to downgrade the system:


[core]

Server=https://archive.archlinux.org/repos/2017/12/22/$repo/os/$arch


Like Debian-based systems, Arch does not update its local repository information until you tell it to do so. You can refresh the package database by issuing the following command:


user@arch ~ $ sudo pacman -Sy


:: Synchronizing package databases...

 core                                                                    
130.2 KiB   851K/s 00:00
[##########################################################] 100%

 extra                                                                  
1645.3 KiB  2.69M/s 00:01
[##########################################################] 100%

 community                                                              
   4.5 MiB  2.27M/s 00:02
[##########################################################] 100%

 multilib is up to date


As you can see in the above output, pacman thinks that the multilib package database is up to date. You can force a refresh if you think this is incorrect by running pacman -Syy. If you want to update your entire system (excluding packages installed from the AUR), you can run pacman -Syu:


user@arch ~ $ sudo pacman -Syu


:: Synchronizing package databases...

 core is up to date

 extra is up to date

 community is up to date

 multilib is up to date

:: Starting full system upgrade...

resolving dependencies...

looking for conflicting packages...


Packages (45) ceph-13.2.0-2  ceph-libs-13.2.0-2  debootstrap-1.0.105-1
 guile-2.2.4-1  harfbuzz-1.8.2-1  harfbuzz-icu-1.8.2-1
 haskell-aeson-1.3.1.1-20

              haskell-attoparsec-0.13.2.2-24  haskell-tagged-0.8.6-1
 imagemagick-7.0.8.4-1  lib32-harfbuzz-1.8.2-1  lib32-libgusb-0.3.0-1
 lib32-systemd-239.0-1

              libgit2-1:0.27.2-1  libinput-1.11.2-1  libmagick-7.0.8.4-1
 libmagick6-6.9.10.4-1  libopenshot-0.2.0-1  libopenshot-audio-0.1.6-1
 libosinfo-1.2.0-1

              libxfce4util-4.13.2-1  minetest-0.4.17.1-1
 minetest-common-0.4.17.1-1  mlt-6.10.0-1  mlt-python-bindings-6.10.0-1
 ndctl-61.1-1  netctl-1.17-1

              nodejs-10.6.0-1  


Total Download Size:      2.66 MiB

Total Installed Size:   879.15 MiB

Net Upgrade Size:      -365.27 MiB


:: Proceed with installation? [Y/n]


In the scenario mentioned earlier regarding downgrading a system, you can force a downgrade by issuing pacman -Syyuu. It is important to note that this should not be undertaken lightly. This should not cause a problem in most cases; however, there is a chance that downgrading of a package or several packages will cause a cascading failure and leave your system in an inconsistent state. USE WITH CAUTION!
To install a package, simply use pacman -S kate:


user@arch ~ $ sudo pacman -S kate


resolving dependencies...

looking for conflicting packages...


Packages (7) editorconfig-core-c-0.12.2-1  kactivities-5.47.0-1
 kparts-5.47.0-1  ktexteditor-5.47.0-2  syntax-highlighting-5.47.0-1
 threadweaver-5.47.0-1

             kate-18.04.2-2


Total Download Size:   10.94 MiB

Total Installed Size:  38.91 MiB


:: Proceed with installation? [Y/n]


To remove a package, you can run pacman -R kate. This removes only the package and not its dependencies:


user@arch ~ $ sudo pacman -S kate


checking dependencies...


Packages (1) kate-18.04.2-2


Total Removed Size:  20.30 MiB


:: Do you want to remove these packages? [Y/n]


If you want to remove the dependencies that are not required by other packages, you can run pacman -Rs:


user@arch ~ $ sudo pacman -Rs kate


checking dependencies...


Packages (7) editorconfig-core-c-0.12.2-1  kactivities-5.47.0-1
 kparts-5.47.0-1  ktexteditor-5.47.0-2  syntax-highlighting-5.47.0-1
 threadweaver-5.47.0-1

             kate-18.04.2-2


Total Removed Size:  38.91 MiB


:: Do you want to remove these packages? [Y/n]


Pacman, in my opinion, offers the most succinct way of searching for the name of a package for a given utility. As shown above, yum and apt both rely on pathing in order to find useful results. Pacman makes some intelligent guesses as to which package you are most likely looking for:


user@arch ~ $ sudo pacman -Fs updatedb

core/mlocate 0.26.git.20170220-1

    usr/bin/updatedb


user@arch ~ $ sudo pacman -Fs kate

extra/kate 18.04.2-2

    usr/bin/kate


Working with the AUR

There are several popular AUR package manager helpers. Of these, yaourt and pacaur are fairly prolific. However, both projects are listed as discontinued or problematic on the Arch Wiki. For that reason, I will discuss aurman. It works almost exactly like pacman, except it searches the AUR and includes some helpful, albeit potentially dangerous, options. Installing a package from the AUR will initiate use of the package maintainer's build scripts. You will be prompted several times for permission to continue (I have truncated the output for brevity):


aurman -S telegram-desktop-bin

~~ initializing aurman...

~~ the following packages are neither in known repos nor in the aur

...

~~ calculating solutions...


:: The following 1 package(s) are getting updated:

   aur/telegram-desktop-bin  1.3.0-1  ->  1.3.9-1


?? Do you want to continue? Y/n: Y


~~ looking for new pkgbuilds and fetching them...

Cloning into 'telegram-desktop-bin'...


remote: Counting objects: 301, done.

remote: Compressing objects: 100% (152/152), done.

remote: Total 301 (delta 161), reused 286 (delta 147)

Receiving objects: 100% (301/301), 76.17 KiB | 639.00 KiB/s, done.

Resolving deltas: 100% (161/161), done.

?? Do you want to see the changes of telegram-desktop-bin? N/y: N


[sudo] password for user:


...

==> Leaving fakeroot environment.

==> Finished making: telegram-desktop-bin 1.3.9-1 (Thu 05 Jul 2018 11:22:02 AM EDT)

==> Cleaning up...

loading packages...

resolving dependencies...

looking for conflicting packages...


Packages (1) telegram-desktop-bin-1.3.9-1


Total Installed Size:  88.81 MiB

Net Upgrade Size:       5.33 MiB


:: Proceed with installation? [Y/n]


Sometimes you will be prompted for more input, depending on the complexity of the package you are installing. To avoid this tedium, aurman allows you to pass both the --noconfirm and --noedit options. This is equivalent to saying "accept all of the defaults, and trust that the package maintainers scripts will not be malicious."USE THIS OPTION WITH EXTREME CAUTION! While these options are unlikely to break your system on their own, you should never blindly accept someone else's scripts.

Conclusion

This article, of course, only scratches the surface of what package managers can do. There are also many other package managers available that I could not cover in this space. Some distributions, such as Ubuntu or Elementary OS, have gone to great lengths to provide a graphical approach to package management.
If you are interested in some of the more advanced functions of package managers, please post your questions or comments below and I would be glad to write a follow-up article.

Appendix


# search for packages

yum search

dnf search

zypper search

apt-cache search

apt search

pacman -Ss


# install packages

yum install

dnf install

zypper install

apt-get install

apt install

pacman -Ss


# update package database, not required by yum, dnf and zypper

apt-get update

apt update

pacman -Sy


# update all system packages

yum update

dnf update

zypper update

apt-get upgrade

apt upgrade

pacman -Su


# remove an installed package

yum remove

dnf remove

apt-get remove

apt remove

pacman -R

pacman -Rs


# search for the package name containing specific file or folder

yum whatprovides *

dnf whatprovides *

zypper what-provides

zypper search --provides

apt-file search

pacman -Sf


Viewing all 1413 articles
Browse latest View live


<script src="https://jsc.adskeeper.com/r/s/rssing.com.1596347.js" async> </script>