http://xmodulo.com/2014/08/remove-file-metadata-linux.html
A typical data file often has associated "metadata" which is descriptive information about the file, represented in the form of a set of name-value pairs. Common metadata include creator's name, tools used to generate the file, file creation/update date, location of creation, editing history, etc. EXIF (images), RDF (web resources), DOI (digital documents) are some of popular metadata standards.
While metadata has its own merits in data management fields, it can actually affect your privacy adversely. EXIF data in photo images can reveal personally identifiable information such as your camera model, GPS coordinate of shooting, your favorite photo editor software, etc. Metadata in documents and spreadsheets contain author/affiliation information and other editing history. Not to be paranoid, but metadata gathering tools such as metagoofil are often exploited during information gathering stage as part of penetration testing.
For those of you who want to strip any personalizing metadata from any shared data, there are ways to remove metadata from data files. You can use existing document or image editor software which typically have built-in metadata editing capability. In this tutorial, let me introduce a nice standalone metadata cleaner tool which is developed for a single goal: anonymize all metadata for your privacy.
MAT (Metadata Anonymisation Toolkit) is a dedicated metadata cleaner written in Python. It was developed under the umbrella of the Tor project, and comes standard on Tails, privacy-enhanced live OS.
Compared to other tools such as exiftool which can write to only a limited number of file types, MAT can eliminate metadata from all kinds of files: images (png, jpg), documents (odt, docx, pptx, xlsx, pdf), archives (tar, tar.bz2), audio (mp3, ogg, flac), etc.
![]()
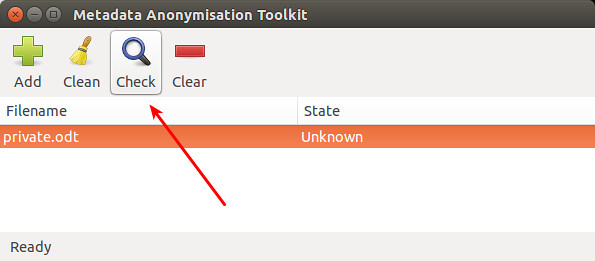
To add the file to MAT for cleanup, click on "Add" icon. Once the file is loaded, click on "Check" icon to scan for any hidden metadata information.
![]()
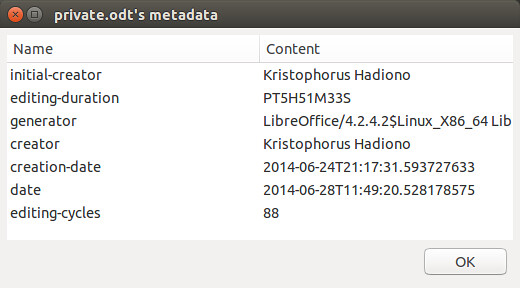
Once any metadata is detected by MAT, "State" will be marked as "Dirty". You can double click the file to see detected metadata.
![]()
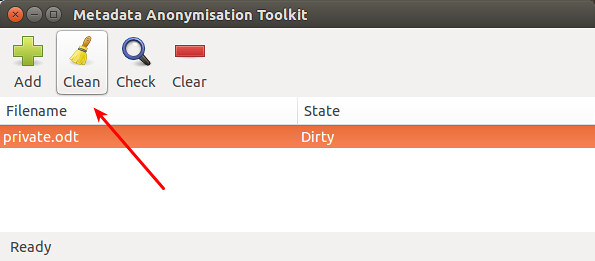
To clean up metadata from the file, click on "Clean" icon. MAT will automatically empty all private metadata fields from the file.
![]()
The cleaned up state is without any personally identifiable traces:
![]()
To check for any sensitive metadata, first go to the directory where your files are located, and then run:
![]()
You can check actual metadata detected by using '-d' option:
![]()
If you don't supply any option with mat command, the default action is to remove metadata from files. If you want to keep a backup of original files during cleanup, use '-b' option. The following command cleans up all files, and stores original files as '*.bak" files.
![]()
To see a list of all supported file types, run:
![]()
A typical data file often has associated "metadata" which is descriptive information about the file, represented in the form of a set of name-value pairs. Common metadata include creator's name, tools used to generate the file, file creation/update date, location of creation, editing history, etc. EXIF (images), RDF (web resources), DOI (digital documents) are some of popular metadata standards.
While metadata has its own merits in data management fields, it can actually affect your privacy adversely. EXIF data in photo images can reveal personally identifiable information such as your camera model, GPS coordinate of shooting, your favorite photo editor software, etc. Metadata in documents and spreadsheets contain author/affiliation information and other editing history. Not to be paranoid, but metadata gathering tools such as metagoofil are often exploited during information gathering stage as part of penetration testing.
For those of you who want to strip any personalizing metadata from any shared data, there are ways to remove metadata from data files. You can use existing document or image editor software which typically have built-in metadata editing capability. In this tutorial, let me introduce a nice standalone metadata cleaner tool which is developed for a single goal: anonymize all metadata for your privacy.
MAT (Metadata Anonymisation Toolkit) is a dedicated metadata cleaner written in Python. It was developed under the umbrella of the Tor project, and comes standard on Tails, privacy-enhanced live OS.
Compared to other tools such as exiftool which can write to only a limited number of file types, MAT can eliminate metadata from all kinds of files: images (png, jpg), documents (odt, docx, pptx, xlsx, pdf), archives (tar, tar.bz2), audio (mp3, ogg, flac), etc.
Install MAT on Linux
On Debian-based systems (Ubuntu or Linux Mint), MAT comes packaged, so installation is straightforward:$ sudo apt-get install mat
On Fedora, MAT does not come as a pre-built package, so you need to build it from the source. Here is how I built MAT on Fedora (with some limited success; see the bottom of the tutorial):$ sudo yum install python-devel intltool python-pdfrw perl-Image-ExifTool python-mutagen
$ sudo pip install hachoir-core hachoir-parser
$ wget https://mat.boum.org/files/mat-0.5.tar.xz
$ tar xf mat-0.5.tar.xz
$ cd mat-0.5
$ python setup.py install
$ sudo pip install hachoir-core hachoir-parser
$ wget https://mat.boum.org/files/mat-0.5.tar.xz
$ tar xf mat-0.5.tar.xz
$ cd mat-0.5
$ python setup.py install
Anonymize Metadata with MAT-GUI
Once installed, MAT can be accessible via GUI as well as from the command line. To launch MAT's GUI, simply type:$ mat-gui
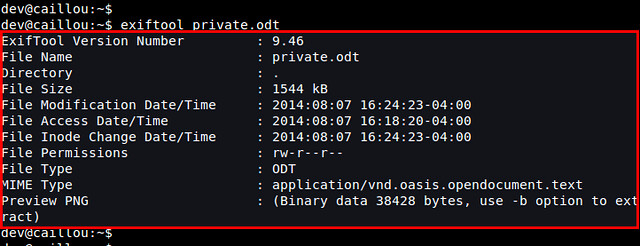
Let's clean up a sample document file (e.g., private.odt) which has the following metadata embedded.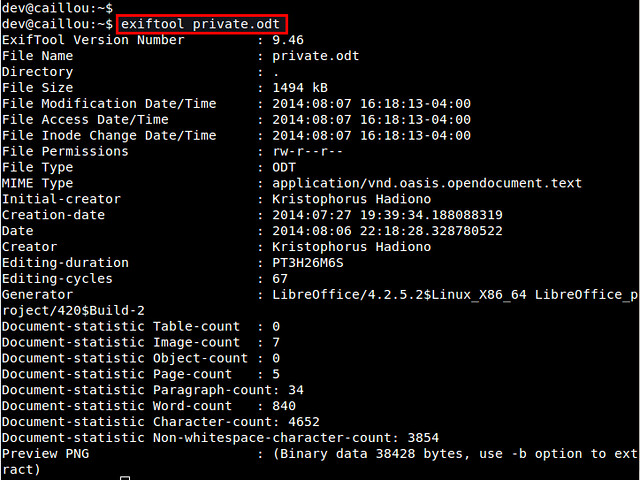
To add the file to MAT for cleanup, click on "Add" icon. Once the file is loaded, click on "Check" icon to scan for any hidden metadata information.
Once any metadata is detected by MAT, "State" will be marked as "Dirty". You can double click the file to see detected metadata.
To clean up metadata from the file, click on "Clean" icon. MAT will automatically empty all private metadata fields from the file.
The cleaned up state is without any personally identifiable traces:
Anonymize Metadata from the Command Line
As mentioned before, another way to invoke MAT is from the command line, and for that, use mat command.To check for any sensitive metadata, first go to the directory where your files are located, and then run:
$ mat -c .
It will scan all files in the current directory and its sub directories, and report their state (clean or unclean).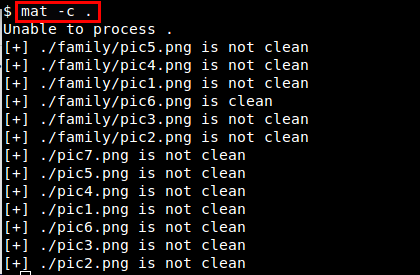
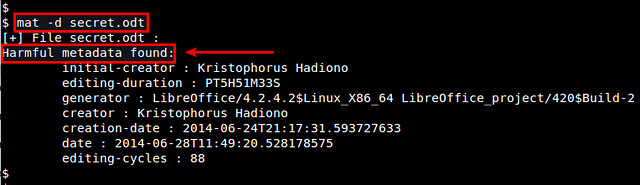
You can check actual metadata detected by using '-d' option:
$ mat -d
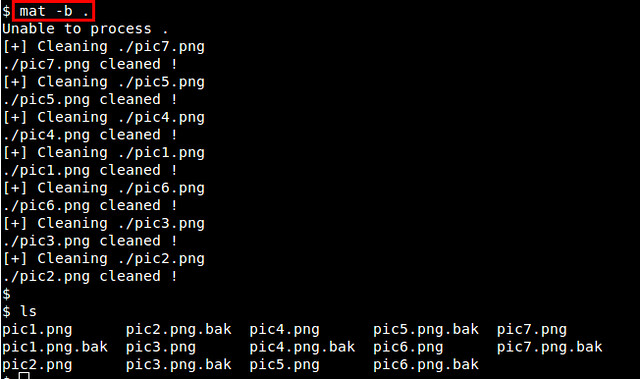
If you don't supply any option with mat command, the default action is to remove metadata from files. If you want to keep a backup of original files during cleanup, use '-b' option. The following command cleans up all files, and stores original files as '*.bak" files.
$ mat -b .
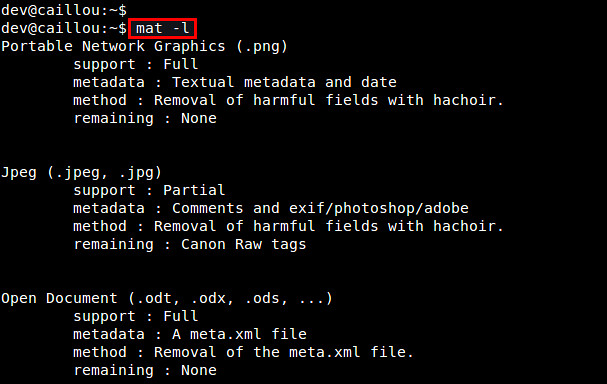
To see a list of all supported file types, run:
$ mat -l
Troubleshooting
Currently I have the following issue with a compiled version of MAT on Fedora. When I attempt to clean up archive/document files (e.g., *.gz, *.odt, *.docx) on Fedora, MAT fails with the following error. If you know how to fix this problem, let me know in the comment.File "/usr/lib64/python2.7/zipfile.py", line 305, in __init__
raise ValueError('ZIP does not support timestamps before 1980')
ValueError: ZIP does not support timestamps before 1980


 Figure 1. Wireshark Output
  Figure 2. Follow TCP Stream
  Figure 3. Raw TCP Dump
  Figure 4. Filtering to a Single TCP Stream
  Figure 5. Gzip-Encoded JSON
  Figure 6. Encrpyted Traffic
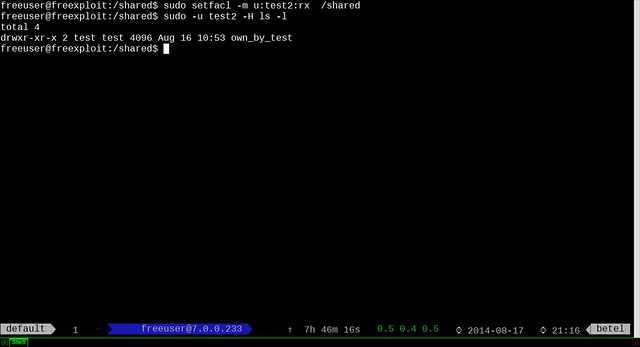

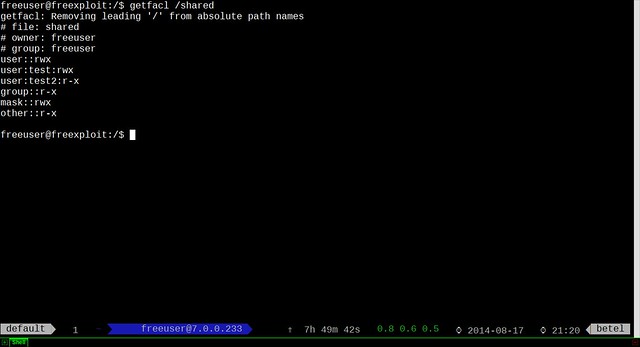
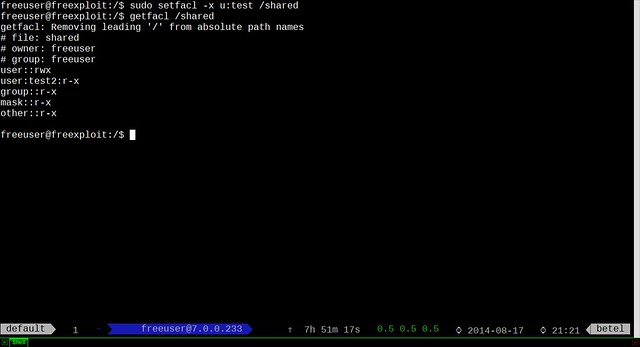

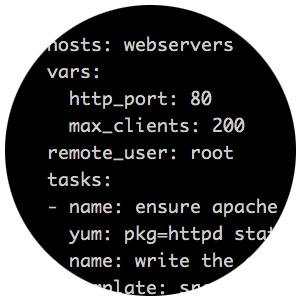


 Figure 1. Example Playbook That Will Upgrade Apache to the Latest Version
  Figure 2. Example of ad hoc Command Showing Uptime Output for All Targets
  Figure 3. In this example, Ansible pings the target hosts using the ping module.
  Figure 4. The /etc/hosts File for My Test Cluster
  Figure 5. My Simple Playbook to Execute STIG Scripts on All Targets
  Figure 6. Output Showing a Successful STIG Playbook Execution