Quantcast
Channel: Sameh Attia
Viewing all 1407 articles
Browse latest View live

How to check RPM package dependencies on Fedora, CentOS or RHEL

$
0
0
http://xmodulo.com/2014/07/check-rpm-package-dependencies-fedora-centos-rhel.html

A typical RPM package on Red Hat-based systems requires all its dependent packages be installed to function properly. For end users, the complexity of such RPM dependency is hidden by package managers (e.g., yum or DNF) during package install/upgrade/removal process. However, if you are a sysadmin or a RPM maintainer, you need to be well-versed in RPM dependencies to maintain run-time environment for the system or roll out up-to-date RPM specs.
In this tutorial, I am going to show how to check RPM package dependencies. Depending on whether a package is installed or not, there are several ways to identify its RPM dependencies.

Method One

One way to find out RPM dependencies for a particular package is to use rpm command. The following command lists all dependent packages for a target package.
$ rpm -qR

Note that this command will work only if the target package is already installed. If you want to check package dependencies for any uninstalled package, you first need to download the RPM package locally (no need to install it).
To download a RPM package without installing it, use a command-line utility called yumdownloader. Install yumdownloader as follows.
$ sudo yum install yum-utils
Now let's check RPM depenencies of a uninstalled package (e.g., tcpdump). First download the package in the current folder with yumdownloader:
$ yumdownloader --destdir=. tcpdump
Then use rpm command with "-qpR" options to list dependencies of the downloaded package.
# rpm -qpR tcpdump-4.4.0-2.fc19.i686.rpm

Method Two

You can also get a list of dependencies for a RPM package using repoquery tool. repoquery works whether or not a target package is installed. This tool is included in yum-utils package.
$ sudo yum install yum-utils
To show all required packages for a particular package:
$ repoquery --requires --resolve

For repoquery to work, your computer needs network connectivity since repoquery pulls information from Yum repositories.

Method Three

The third method to show RPM package dependencies is to use rpmreaper tool. Originally this tool is developed to clean up unnecessary packages and their dependencies on RPM-based systems. rpmreaper has an ncurses-based intuitive interface for browsing installed packages and their dependency trees.
To install rpmrepater, use yum command. On CentOS, you need to set up EPEL repo first.
$ sudo yum install rpmreaper
To browser RPM dependency trees, simply run:
$ rpmreaper

The rpmrepater interface will show you a list of all installed packages. You can navigate the list using up/down arrow keys. Press "r" on a highlighted package to show its dependencies. You can expand the whole dependency tree by recursively pressing "r" keys on individual dependent packages. The "L" flag indicates that a given package is a "leaf", meaning that no other package depends on this package. The "o" flag implies that a given package is in the middle of dependency chain. Pressing "b" on such a package will show you what other packages require the highlighted package.

Method Four

Another way to show package dependencies on RPM-based systems is to use rpmdep which is a command-line tool for generating a full package dependency graph of any installed RPM package. The tool analyzes RPM dependencies, and produce partially ordered package lists from topological sorting. The output of this tool can be fed into dotty graph visualization tool to generate a dependency graph image.
To install rpmdep and dotty on Fedora:
$ sudo yum install rpmorphan graphviz
To install the same tools on CentOS:
$ wget http://downloads.sourceforge.net/project/rpmorphan/rpmorphan/1.14/rpmorphan-1.14-1.noarch.rpm
$ sudo rpm -ivh rpmorphan-1.14-1.noarch.rpm
$ sudo yum install graphviz
To generate and plot a dependency graph of a particular installed package (e.g., gzip):
$ rpmdep.pl -dot gzip.dot gzip
$ dot -Tpng -o output.png gzip.dot

So far in this tutorial, I demonstrate several ways to check what other packages a given RPM package relies on. If you want to know more about .deb package dependencies for Debian-based systems, you can refer to this guide instead.

Counting lines of code with cloc

$
0
0
http://linuxconfig.org/counting-lines-of-code-with-cloc

Are you working on a project and need to submit your progress, statistics or perhaps you need to calculate a value of your code? cloc is a powerful tool that allows you to count all lines of your code, exclude comment lines and white space and even sort it by programming language.

cloc is available for all major Linux distributions. To install cloc on your system simply install cloc package from system's package repository:
DEBIAN/UBUNTU:
# apt-get install cloc
FEDORA/REDHAT/CENTOS
# yum install cloc
cloc work on per file or per directory basis. To count the lines of the code simply point cloc to a directory or file. Let's create my_project directory with single bash script:
$ mkdir my_project
$ cat my_project/bash.sh
#!/bin/bash

echo "hello world"
Let cloc to count the lines of our code:
$ cloc my_project/bash.sh 
1 text file.
1 unique file.
0 files ignored.

http://cloc.sourceforge.net v 1.60 T=0.00 s (262.8 files/s, 788.4 lines/s)
-------------------------------------------------------------------------------
Language files blank comment code
-------------------------------------------------------------------------------
Bourne Shell 1 1 0 2
-------------------------------------------------------------------------------
Let's add another file by this time with perl code and count the line of code by pointing it to the entire directory rather then just a single file:
$ cat my_project/perl.pl
#!/usr/bin/perl

print "hello world\n"
$ ls my_project/
bash.sh perl.pl
$ cloc my_project/
2 text files.
2 unique files.
0 files ignored.

http://cloc.sourceforge.net v 1.60 T=0.01 s (287.8 files/s, 863.4 lines/s)
-------------------------------------------------------------------------------
Language files blank comment code
-------------------------------------------------------------------------------
Perl 1 1 0 2
Bourne Shell 1 1 0 2
-------------------------------------------------------------------------------
SUM: 2 2 0 4
-------------------------------------------------------------------------------
In the next example we will print results for each file separately on each line. This can be done by the use of --by-file option:
$ cloc --by-file my_project/
2 text files.
2 unique files.
0 files ignored.

http://cloc.sourceforge.net v 1.60 T=0.01 s (149.5 files/s, 448.6 lines/s)
--------------------------------------------------------------------------------
File blank comment code
--------------------------------------------------------------------------------
my_project/perl.pl 1 0 2
my_project/bash.sh 1 0 2
--------------------------------------------------------------------------------
SUM: 2 0 4
--------------------------------------------------------------------------------

cloc can obtain count of all code lines also from a compressed file. In the next example we count code lines of entire joomla project, provided the we have already downloaded its zipped source code:
$ cloc /tmp/Joomla_3.3.1-Stable-Full_Package.zip
count lines of code - compressed file
Count lines of currently running kernel's source code ( redhat/fedora ):
$ cloc /usr/src/kernels/`uname -r`
count lines of kernel source code
For more information and options see cloc manual page man cloc

How to set up a highly available Apache cluster using Heartbeat

$
0
0
http://www.openlogic.com/wazi/bid/350999/how-to-set-up-a-highly-available-apache-cluster-using-heartbeat


A highly available cluster uses redundant servers to ensure maximum uptime. Redundant nodes mitigate risks related to single points of failure. Here's how you can set up a highly available Apache server cluster on CentOS.
Heartbeat provides cluster infrastructure services such as inter-cluster messaging, node memberships, IP allocation and migration, and starting and stopping of services. Heartbeat can be used to build almost any kind of highly available clusters for enterprise applications such as Apache, Samba, and Squid. Moreover, it can be coupled with load balancing software so that incoming requests are shared by all cluster nodes.
Our example cluster will consist of three servers that run Heartbeat. We'll test failover by taking down servers manually and checking whether the website they serve is still available. Here's our testing topology:
TopologyThe IP address against which the services are mapped needs to be reachable at all time. Normally Heartbeat would assign the designated IP address to a virtual network interface card (NIC) on the primary server for you. If the primary server goes down, the cluster will automatically shift the IP address to a virtual NIC on another of its available servers. When the primary server comes back online, it shifts the IP address back to the primary server again. This IP address is called "floating" because of its migratory properties.

Install packages on all servers

To set up the cluster, first install the prerequisites on each node using yum:
yum install PyXML cluster-glue cluster-glue-libs resource-agents
Next, download and install two Heartbeat RPM files that are not available in the official CentOS repository.
wget http://dl.fedoraproject.org/pub/epel/6/x86_64/heartbeat-3.0.4-2.el6.x86_64.rpm
wget http://dl.fedoraproject.org/pub/epel/6/x86_64/heartbeat-libs-3.0.4-2.el6.x86_64.rpm
rpm -ivh heartbeat-*
Alternatively, you can add the EPEL repository to your sources and use yum for the installs.
Heartbeat will manage starting up and stopping Apache's httpd service, so stop Apache and disable it from being automatically started:
service httpd stop
chkconfig httpd off

Set up hostnames

Now set the server hostnames by editing /etc/sysconfig/network on each system and changing the HOSTNAME line:
HOSTNAME=serverX.example.com
The new hostname will activate at the next server boot-up. You can use the hostname command to immediately activate it without restarting the server:
hostname serverX.example.com
You can verify that the hostname has been properly set by running uname -n on each server.

Configure Heartbeat

To configure Heartbeat, first copy its default configuration files from /usr to /etc/ha.d/:
cp /usr/share/doc/heartbeat-3.0.4/authkeys /etc/ha.d/
cp /usr/share/doc/heartbeat-3.0.4/ha.cf /etc/ha.d/
cp /usr/share/doc/heartbeat-3.0.4/haresources /etc/ha.d/
You must then modify all three files on all of your cluster nodes to match your requirements.
The authkeys file contains the pre-shared password to be used by the cluster nodes while communicating with each other. Each Heartbeat message within the cluster contains the password, and nodes process only those messages that have the correct password. Heartbeat supports SHA1 and MD5 passwords. In authkeys, the following directives set the authentication method as SHA1 and define the password to be used:
auth 2
2 sha1 pre-shared-password
Save the file, then give it permissions of r-- with the command chmod 600 /etc/ha.d/authkeys.
Next, in ha.cf, define timers, cluster nodes, messaging mechanisms, layer 4 ports, and other settings:
## logging ##
logfile /var/log/ha-log
logfacility local0hea

## timers ##
## All timers are set in seconds. Use 'ms' if you need to define time in milliseconds. ##

## heartbeat intervals ##
keepalive 2

## node is considered dead after this time ##
deadtime 15

## some servers take longer time to boot. this timer defines additional time to wait before confirming that a server is down ##
## the recommended time for this timer is at least twice of the dead timer ##
initdead 120

## messaging parameters ##
udpport 694

bcast eth0
## you can use multicasts or unicasts as well ##

## node definitions ##
## make sure that the hostnames match uname -n ##

node server1.example.com
node server2.example.com
node server3.example.com
Finally, the file haresources contains the hostname of the server that Heartbeat considers the primary node, as well as the floating IP address. It is vital that this file be identical across all servers. As long as the primary node is up, it serves all requests; Heartbeat stops the highly available service on all other nodes. When Heartbeat detects that that primary node is down, it automatically starts the service on the next available node in the cluster. When the primary node comes back online, Heartbeat sets it to take over again and serve all requests. Finally, this file contains the name of the script that is responsible for the highly available service: httpd in this case. Other possible values might be squid, smb, nmb, or postfix, mapping to the name of the service startup script typically located in the /etc/init.d/ directory.
In haresources, define server1.example.com to be the primary server, 192.168.56.200 to be the floating IP address, and httpd to be the highly available service. You do not need to create any interface or manually assign the floating IP address to any interface – Heartbeat takes care of that for you:
server1.example.com 192.168.56.200 httpd
After the configuration files are ready on each of the servers, start the Heartbeat service and add it to system startup:
service heartebeat start
chkconfig heartbeat on
You can keep an eye on the Heartbeat log with the command tailf /var/log/ha-log.
Heartbeat can be used to for multiple services. For example, the following directive in haresources would make Heartbeat manage both Apache and Samba services:
server1.example.com 192.168.56.200 httpd smb nmb
However, unless you're also running a cluster resource manager (CRM) such as Pacemaker, I do not recommend using Heartbeat to provide mulitple services in a single cluster. Without Pacemaker, Heartbeat monitors cluster nodes in layer 3 using IP addresses. As long as an IP address is reachable, Heartbeat is oblivious to any crashes or difficulties that services may be facing on a server node.

Testing

Once Heartbeat is up and running, test it out. Create separate index.html files on all three servers so you can see which server is serving the page. Browse to 192.168.56.200 or, if you have DNS set up, its domain name equivalent. The page should be loaded from server1.example.com, and you can check this by looking at the Apache log file in server1. Try refreshing the page and verify whether the page is being loaded from the same server each time.
If this goes well, test failover by stopping the Heartbeat service on server1.example.com. The floating IP address should be migrated to server 2, and the page should be loaded from there. A quick look into server2 Apache log should confirm the fact. If you stop the service on server2 as well, the web pages will be loaded from server3.example.com, the only available node in the cluster. When you restart the services on server1 and server2, the floating IP address should migrate from the active node to server1, per the setup in haresources.
As you can see, it's easy to set up a highly available Apache cluster under CentOS using Heartbeat. While we used three servers, Heartbeat should work with more or fewer nodes as well. Heartbeat has no constraint on the number of nodes, so you can scale the setup as you need.

Linux / Unix logtop: Realtime Log Line Rate Analyser

$
0
0
http://www.cyberciti.biz/faq/linux-unix-logtop-realtime-log-line-rate-analyser

How can I analyze line rate taking log file as input on a Linux system? How do I find the IP flooding my Apache/Nginx/Lighttpd web-server on a Debian or Ubuntu Linux?

Tutorial details
DifficultyEasy (rss)
Root privilegesYes
RequirementsNone
Estimated completion timeN/A
You need to use a tool called logtop. It is a system administrator tool to analyze line rate taking log file as input. It reads on stdin and print a constantly updated result displaying, in columns in the following format: Line number, count, frequency, and the actual line

How do install logtop on a Debian or Ubuntu based system?

Simply type the following apt-get command:
$ sudo apt-get install logtop
Sample outputs:
Reading package lists... Done
Building dependency tree
Reading state information... Done
The following NEW packages will be installed:
logtop
0 upgraded, 1 newly installed, 0 to remove and 3 not upgraded.
Need to get 15.7 kB of archives.
After this operation, 81.9 kB of additional disk space will be used.
Get:1 http://mirrors.service.networklayer.com/ubuntu/ precise/universe logtop amd64 0.3-1 [15.7 kB]
Fetched 15.7 kB in 0s (0 B/s)
Selecting previously unselected package logtop.
(Reading database ... 114954 files and directories currently installed.)
Unpacking logtop (from .../logtop_0.3-1_amd64.deb) ...
Processing triggers for man-db ...
Setting up logtop (0.3-1) ...

Syntax

The syntax is as follows:
 
logtop [OPTIONS][FILE]
command | logtop
command1 | filter | logtop
command1 | filter | logtop [options][file]
 

Examples

Here are some common examples of logtop.

Show the IP address flooding your LAMP server

Type the following command:
 
tail -f www.cyberciti.biz_access.log | cut -d'' -f1 | logtop
 
Sample outputs:
Fig.01: logtop command in action

See squid cache HIT and MISS log

 
tail -f cache.log | grep -o "HIT\|MISS" | logtop
 
To see realtime hit / miss ratio on some caching software log file, enter:
tail -f access.log | cut -d'' -f1 | logtop -s 20000
The -s option set logtop to work with the maximum of K lines instead of 10000.

Building a better Internet, one Tor relay at a time

$
0
0
http://parabing.com/2014/07/your-own-tor-relay

Everybody’s talking about privacy and anonymity on the Internet these days, and many people are concerned with their apparent demise. Understandably so, considering the torrent of revelations we’ve been getting for over a year now, all about the beliefs and practices of (in)famous three-letter agencies.
We’re not about to reiterate the valid concerns of privacy and/or anonymity minded people. Instead, we are going to demonstrate how one can make a small but extremely significant contribution towards an Internet where anonymity is an everyday practical option and not an elusive goal. (If you’re also interested in privacy, then maybe it’s time to setup your very own OpenVPN server.)
You’ve probably heard about Tor. Technically speaking, it is a global mesh of nodes, also known as relays, which encrypt and bounce traffic between client computers and servers on the Internet. That encryption and bouncing of traffic is done in such a way, that it is practically impossible to know who visited a web site or used a network service in general. To put it simply, anytime I choose to surf the web using Tor it’s impossible for the administrators of the sites I visit to know my real IP address. Even if they get subpoenaed, they are just unable to provide the real addresses of the clients who reached them through Tor.
If you care about your anonymity or you’re just curious about Tor, then you may easily experience it by downloading the official, freely available Tor Browser Bundle. The effectiveness of Tor relies in the network of those aforementioned relays: The more active relays participate in the Tor network, the stronger the anonymity Tor clients enjoy is.
advertisment
It is relatively easy to contribute to the strengthening of the Tor network. All you really need is an active Internet connection and a box/VM/VPS — or even a cheap computer like the Raspberry Pi. In the remainder of this post we demonstrate how one can setup a Tor relay on a VPS running Ubuntu Server 14.04 LTS (Trusty Tahr). You may follow our example to the letter or install Tor on some different kind of host, possibly running some other Linux distribution, flavor of BSD, OS X or even Windows.

Installation

We SSH into our Ubuntu VPS, gain access to the root account and add to the system a new, always up-to-date Tor repository:
$ sudo su
# echo "deb http://deb.torproject.org/torproject.org trusty main">> /etc/apt/sources.list
If you’re not running the latest version of Ubuntu Server (14.04 LTS, at the time of this writing), then you should replace “trusty” with the corresponding codename. One way to find out the codename of your particular Ubuntu version is with the help of lsb_release utility:
# lsb_release -a
No LSB modules are available.
Distributor ID: Ubuntu
Description:    Ubuntu 14.04 LTS
Release:        14.04
Codename:       trusty
Now, let’s refresh all the local repositories:
# apt-get update
...
W: GPG error: http://deb.torproject.org trusty InRelease:
The following signatures couldn't be verified because the
public key is not available: NO_PUBKEY
The Tor repository signature cannot be verified, so naturally we get an error. The verification fails because the public key is missing. We may manually download that key and let APT know about it, but it’s better to install the deb.torproject.org-keyring package instead. That way, whenever the signing key changes, we won’t have to re-download the corresponding public key.
# apt-get install deb.torproject.org-keyring
Reading package lists... Done
Building dependency tree      
Reading state information... Done
The following NEW packages will be installed:
  deb.torproject.org-keyring
0 upgraded, 1 newly installed, 0 to remove and 0 not upgraded.
Need to get 4138 B of archives.
After this operation, 20.5 kB of additional disk space will be used.
WARNING: The following packages cannot be authenticated!
  deb.torproject.org-keyring
Install these packages without verification? [y/N] y
We confirm the installation of deb.torproject.org-keyring and then refresh the local repositories:
# apt-get update
This time around there should be no errors. To install Tor itself, we just have to type…
# apt-get install tor
Reading package lists... Done
Building dependency tree      
Reading state information... Done
The following extra packages will be installed:
  tor-geoipdb torsocks
Suggested packages:
  mixmaster xul-ext-torbutton socat tor-arm polipo privoxy apparmor-utils
The following NEW packages will be installed:
  tor tor-geoipdb torsocks
0 upgraded, 3 newly installed, 0 to remove and 0 not upgraded.
Need to get 1317 kB of archives.
After this operation, 5868 kB of additional disk space will be used.
Do you want to continue? [Y/n]y
That’s all great! By now, Tor should be up and running:
# netstat -antp
Active Internet connections (servers and established)
Proto Recv-Q Send-Q Local Address           Foreign Address         State       PID/Program name
tcp        0      0 0.0.0.0:22              0.0.0.0:*               LISTEN      808/sshd       
tcp        0      0 127.0.0.1:9050          0.0.0.0:*               LISTEN      973/tor        
tcp        0      0 10.10.10.235:22         10.10.10.250:49525      ESTABLISHED 2095/sshd: sub0
tcp6       0      0 :::22                   :::*                    LISTEN      808/sshd
But before we add a new relay to the Tor network, we should properly configure it first.

Configuration

The Tor configuration file is named torrc and it resides within the /etc/tor directory. Before we make any changes to it, it’s a good idea to keep a backup. Then we open up torrc with a text editor, e.g., nano:
# cp /etc/tor/torrc /etc/tor/torrc.original
# nano /etc/tor/torrc
We locate the following lines and modify them to fit our setup. Please take a closer look at our modifications:
SocksPort 0
Log notice file /var/log/tor/notices.log
Nickname parabing
ORPort 9001
DirPort 9030
Address noname.example.com # this is optional
ContactInfo cvarelas AT gmail DOT com
RelayBandwidthRate 128 KB
RelayBandwidthBurst 192 KB
ExitPolicy reject *:*
Some explaining is in order.
  • SocksPort 0
    We want Tor to act as a relay only and ignore connections from local applications.
  • Log notice file /var/log/tor/notices.log
    All messages of level “notice” and above should go to /var/log/tor/notices.log. Check the five available message levels here.
  • Nickname parabing
    A name for our Tor relay. Feel free to name yours anyway you like. The relay will be searchable in the various public relay databases by that name.
  • ORPort 9001
    This is the standard Tor port for incoming network connections.
  • DirPort 9030
    This is the standard port for distributing information about the public Tor directory.
  • Address noname.example.com
    This is optional but in some cases useful. If your relay has trouble participating in the Tor network during startup, then try providing here the fully qualified domain name or the public IP address of the host computer/VM/VPS.
  • ContactInfo cvarelas AT gmail DOT com
    You may type a real email address here — and you don’t have to care for syntax correctness: The address may be just intelligible, so if anyone wishes to contact you for any reason then he or she will have a chance to know an email of yours by looking up your relay in a public directory.
  • RelayBandwidthRate 128 KB
    The allowed bandwidth for incoming traffic. In this example it’s 128 kilobytes per second, that is 8 x 128 = 1024Kbps or 1Mbps. Please note that RelayBandwidthRate must be at least 20 kilobytes per second.
  • RelayBandwidthBurst 192 KB
    This is the allowed bandwidth burst for incoming traffic. In our example it’s 50% more than the allowed RelayBandwidthRate.
  • ExitPolicy reject *:*
    This relay does not allow exits to the “normal” Internet — it’s just a member of the Tor network. If you’re hosting the relay yourself at home, then it’s highly recommended to disallow exits. This is true even if you’re running Tor on a VPS. See the Closing comments section for more on when it is indeed safe to allow exits to the Internet.
advertisment
After all those modifications in /etc/tor/torrc we’re ready to restart Tor (it was automatically activated immediately after the installation). But before we do that, there might be a couple of things we should take care of.

Port forwarding and firewalls

It’s likely that the box/VM/VPS our Tor relay is hosted is protected by some sort of firewall. If this is indeed the case, then we should make sure that the TCP ports for ORPort and DirPort are open. For example, one of our Tor relays lives on a GreenQloud instance and that particular IaaS provider places a firewall in front of any VPS (instance). That’s why we had to manually open ports 9001/TCP and 9030/TCP on the firewall of that instance. There’s also the case of the ubiquitous residential NAT router. In this extremely common scenario we have to add two port forwarding rules to the ruleset of the router, like the following:
  • redirect all incoming TCP packets for port 9001 to port 9001 on the host with IP a.b.c.d
  • redirect all incoming TCP packets for port 9030 to port 9030 on the host with IP a.b.c.d
where a.b.c.d is the IP address of the relay host’s Internet-facing network adapter.

First-time startup and checks

To let Tor know about the fresh modifications in /etc/tor/torrc, we simply restart it:
# service tor restart
* Stopping tor daemon...
* ...
* Starting tor daemon...        [ OK ]
#
To see what’s going on during Tor startup, we take a look at the log file:
# tail -f /var/log/tor/notices.log
Jul 18 09:30:07.000 [notice] Bootstrapped 80%: Connecting to the Tor network.
Jul 18 09:30:07.000 [notice] Guessed our IP address as 37.b.c.d (source: 193.23.244.244).
Jul 18 09:30:08.000 [notice] Bootstrapped 85%: Finishing handshake with first hop.
Jul 18 09:30:09.000 [notice] Bootstrapped 90%: Establishing a Tor circuit.
Jul 18 09:30:09.000 [notice] Tor has successfully opened a circuit. Looks like client functionality is working.
Jul 18 09:30:09.000 [notice] Bootstrapped 100%: Done.
Jul 18 09:30:09.000 [notice] Now checking whether ORPort 37.b.c.d:9001 and DirPort 37.b.c.d:9030 are reachable... (this may take up to 20 minutes -- look for log messages indicating success)
Jul 18 09:30:10.000 [notice] Self-testing indicates your DirPort is reachable from the outside. Excellent.
Jul 18 09:30:11.000 [notice] Self-testing indicates your ORPort is reachable from the outside. Excellent. Publishing server descriptor.
Jul 18 09:31:43.000 [notice] Performing bandwidth self-test...done.
(Press [CTR+C] to stop viewing the log file.) Notice that DirPort and ORPort are reachable — and that’s good. If any of those ports is not reachable, then check the firewall/port forwarding rules. You may also have to activate the Address directive in /etc/tor/torrc and restart the tor service.
You can look up any Tor relay in the Atlas directory. The relay shown on the screenshot is one of our own and it lives in a datacenter in Iceland, a country with strong pro-privacy laws.

Relay monitoring

One way to find out if your new, shiny Tor relay is actually active, is to look it up on Atlas. You may also monitor its operation in real-time with arm (anonymizing relay monitor). Before we install arm, let’s make a couple of modifications to /etc/tor/torrc. At first we locate the following two lines and uncomment them (i.e., delete the # character on the left):
ControlPort 9051
HashedControlPassword ...
We then move at the end of torrc and add this line:
DisableDebuggerAttachment 0
We make sure the modifications to torrc are saved and then restart tor:
# service tor restart
To install arm we type:
# apt-get install tor-arm
Reading package lists... Done
Building dependency tree      
Reading state information... Done
The following extra packages will be installed:
  python-geoip python-socksipy python-support python-torctl
The following NEW packages will be installed:
  python-geoip python-socksipy python-support python-torctl tor-arm
0 upgraded, 5 newly installed, 0 to remove and 0 not upgraded.
Need to get 406 kB of archives.
After this operation, 1,735 kB of additional disk space will be used.
Do you want to continue? [Y/n] y
There’s no need to work from the root account anymore, so let’s exit to our non-privileged user account:
# exit
exit
$
Right after the installation of the tor-arm package, a new account is created. The username of that account is debian-tor and for security reasons we run arm from the confines of said account:
$ sudo -u debian-tor arm

Closing comments

If you have more than one relays running, then no matter if they reside in the same local network or not you may want to put them in the same family, so clients will be able to avoid using more than one of your relays in a single circuit. To do that, on each node open up /etc/tor/torrc for editing, locate and uncomment the MyFamily directive and list the fingerprints of all your relays. One way to find the fingerprint of a relay is to look it up in Atlas; just search for the relay by name, click on the name and take a look at the Properties column. Another way is to simply run arm and check the information at the fourth line from the top of the terminal.
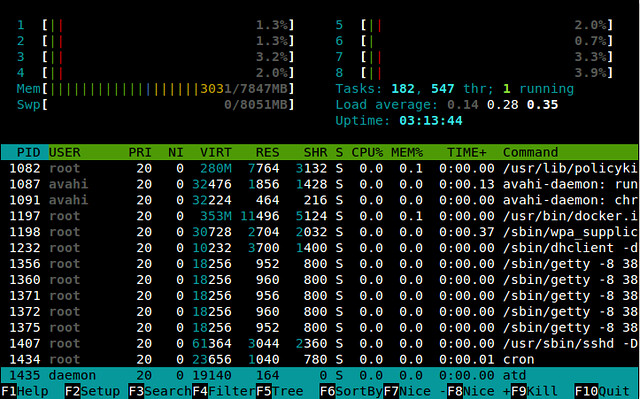
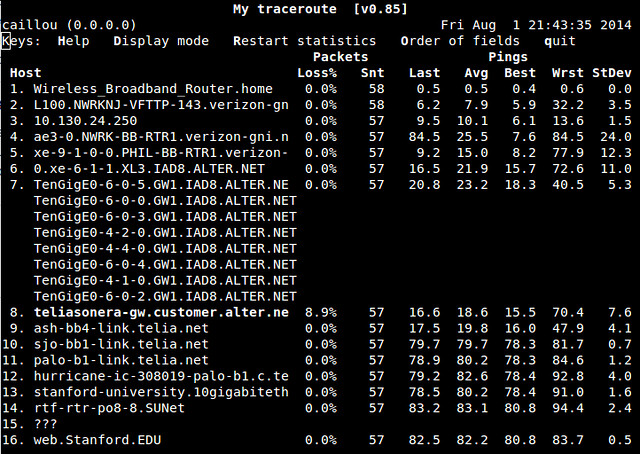
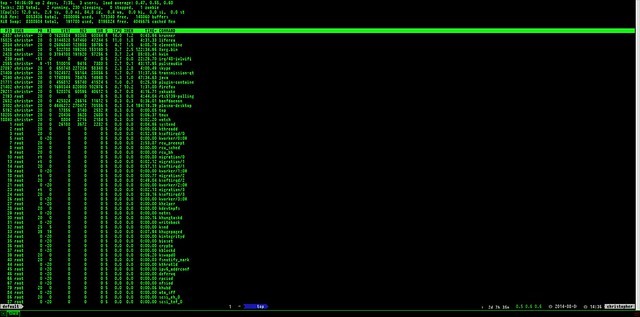
Thanks to arm (anonymizing relay monitor) we can monitor our Tor relay operation from our beloved terminal. The relay shown is hosted on Raspberry Pi with Raspbian.Tor relays can be configured to allow a predefined amount of traffic per time period and then hibernate until the next time period comes. Bandwidth isn’t always free in all VPS providers and/or ISPs, so you may want to define the AccountingMax and AccountingStart directives in your relay’s torrc file.
Now, in this post we setup a relay which is indeed a member of the global Tor network but it is not an exit node. In other words, no website or service on the Internet will see traffic coming from the public IP of our relay. This arrangement keeps us away from trouble. (Think about it: We can never know the true intentions of Tor clients, nor can we be responsible for their actions.) Having said that, we can’t stress enough that there’s always a high demand for Tor exit nodes. So if you want your contribution to the Tor network to have the highest positive impact possible, you might want to configure your relay to act as an exit relay. To do that, open /etc/tor/torrc, comment out the old ExitPolicy line and add this one:
ExitPolicy accept *:*
The above directive allows all kinds of exits, i.e., traffic destined to any TCP port, but you may selectively disallow exits to certain ports (services). See the following example:
ExitPolicy reject *:25, reject *:80, accept *:*
This means that all exits are allowed but not those to web or SMTP servers. In general, exit policies are considered first to last and the first match wins. You may split your policy in several lines, all beginning with ExitPolicy. See, for example, the default policy of any tor relay:
ExitPolicy reject *:25
ExitPolicy reject *:119
ExitPolicy reject *:135-139
ExitPolicy reject *:445
ExitPolicy reject *:563
ExitPolicy reject *:1214
ExitPolicy reject *:4661-4666
ExitPolicy reject *:6346-6429
ExitPolicy reject *:6699
ExitPolicy reject *:6881-6999
ExitPolicy accept *:*
We recommend that you read the man page of torrc for more details on exit policies.
Judging from my personal experience, if you completely allow all exits on your relay then it’s almost certain that sooner rather than later you’ll get an email from your VPS provider or your ISP. This has happened to me more than four times already. In one of those cases there were complaints about downloading of infringing content (movies and TV shows) via BitTorrent. At another time, an email from my ISP was mentioning excessive malware activity originating from my public IP at home. Each time I was the recipient of such emails, I immediately modified the exit policy of the corresponding Tor instance and continued using it as a non-exit relay. After the change of the policy, I had no further (justified) complaints from the ISP/VPS provider.
advertisment
My understanding is that even if your relay allows exits, it’s still highly improbable that you’ll get yourself in any sort of legal trouble. It is *not impossible* though, and occasionally it all depends on the law in your country and/or other legal precedents. So my recommendation is to always disallow exits or use the default exit policy. If your relay is hosted in a university, then you should probably get away by allowing all kinds of exits. In any case, always be cooperative and immediately comply to any requests from your ISP or VPS provider.
Congratulations on your new Tor relay — and have fun!

An introduction to systemd for CentOS 7

$
0
0
http://www.openlogic.com/wazi/bid/351296/an-introduction-to-systemd-for-centos-7

With Red Hat Enterprise Linux 7 released and CentOS version 7 newly unveiled, now is a good time to cover systemd, the replacement for legacy System V (SysV) startup scripts and runlevels. Red Hat-based distributions are migrating to systemd because it provides more efficient ways of managing services and quicker startup times. With systemd there are fewer files to edit, and all the services are compartmentalized and stand separate from each other. This means that should you screw up one config file, it won't automatically take out other services.
Systemd has been the default system and services manager in Red Hat Fedora since the release of Fedora 15, so it is extensively field-tested. It provides more consistency and troubleshooting ability than SysV – for instance, it will report if a service has failed, is suspended, or is in error. Perhaps the biggest reason for the move to systemd is that it allows multiple services to start up at the same time, in parallel, making machine boot times quicker than they would be with legacy runlevels.
Under systemd, services are now defined in what are termed unit files, which are text files that contain all the configuration information a service needs to start, including its dependencies. Service files are located in /usr/lib/systemd/system/. Many but not all files in that directory will end in .service; systemd also manages sockets and devices.
No longer do you directly modify scripts to configure runlevels. Within systemd, runlevels have been replaced by the concept of states. States can be described as "best efforts" to get a host into a desired configuration, whether it be single-user mode, networking non-graphical mode, or something else. Systemd has some predefined states created to coincide with legacy runlevels. They are essentially aliases, designed to mimic runlevels by using systemd.
States require additional components above and beyond services. Therefore, systemd uses unit files not only to configure services, but also mounts, sockets, and devices. These units' names end in .sockets, .devices, and so on.
Targets, meanwhile, are logical groups of units that provide a set of services. Think of a target as a wrapper in which you can place multiple units, making a tidy bundle to work with.
Unit files are built from several configurable sections, including unit descriptions and dependencies. Systemd also allows administrators to explicitly define a service's dependencies and load them before the given service starts by editing the unit files. Each unit file has a line that starts After= that can be used to define what service is required before the current service can start. WantedBy=lines specify that a target requires a given unit.
Targets have more meaningful names than those used in SysV-based systems. A name like graphical.target gives admins an idea of what a file will provide! To see the current target at which the system is residing, use the command systemctl get-default. To set the default target, use the command systemctl set-default targetname.target. targetname can be, among others:
  • rescue.target
  • multi-user.target
  • graphical.target
  • reboot.target
Looking at the above it becomes obvious that although there is no direct mapping between runlevels and targets, systemd provides what could loosely be termed equivalent levels.
Another important feature systemd implements is cgroups, short for control groups, which provide security and manageability for the resources a system can use and control. With cgroups, services that use the same range of underlying operating system calls are grouped together. These control groups then manage the resources they control. This grouping performs two functions: it allows administrators to manage the amount of resources a group of services gets, and it provides additional security in that a service in a certain cgroup can't jump outside of cgroups control, preventing it for example from getting access to other resources controlled by other cgroups.
Cgroups existed in the old SysV model, but were not really implemented well. systemd attempts to fix this issue.

First steps in systemd

Under systemd you can still use the service and chkconfig commands to manage those additional legacy services, such as Apache, that have not yet been moved over to systemd management. You can also use service command to manage systemd-enabled services. However, several monitoring and logging services, including cron and syslog, have been rewritten to use the functionality that is available in systemd, in part because scheduling and some of the cron functionality is now provided by systemd.
You can also manage systemd with a GUI management tool called systemd System Manger, though it is not usually installed by default. To install it, as root, run yum -y install systemd-ui.
How can you start managing systemd services? Now that Centos 7 is out of the starting gate we can start to experiment with systemd and understand its operation. To begin, as the root user in a terminal, type chkconfig. The output shows all the legacy services running. As you can see by the big disclaimer, most of the other services that one would expect to be present are absent, because they have been migrated to systemd management.
Red Hat-based OSes no longer use the old /etc/initab file, but instead use a system.default configuration file. You can symlink a desired target to the system.default in order to have that target start up when the system boots. To configure the target to start a typical multi-user system, for example, run the command below:
ln -sf /lib/systemd/system/multi-user.target /etc/systemd/system/default.target
After you make the symlink, run systemctl, the replacement for chkconfig. Several pages of output display, listing all the services available:
systemctl
  • Unit – the service name
  • Load – gives status of the service (such as Loaded, Failed, etc.)
  • Active – indicates whether the status of the service is Active
  • Description – textual description of the unit
The key commands and arguments in systemctl are similar to the legacy ones found in chkconfig – for example, systemctl start postfix.service.
In the same vein, use systemctl stop and systemctl status to stop services or view information. This syntax similarity to chkconfig arguments is by design, to make the transition to systemd as smooth as possible.
To see all the services you can start using systemctl and their statuses, use the command
systemctl list-unit-files --type=service
services
While you can no longer enable a runlevel for a service using chkconfig --level, under systemd you can enable or disable a service when it boots. Use systemctl enable service to enable a service, and systemctl disable service to keep it from starting at boot. Get a service's current status (enabled or disabled) with the command systemctl is-enabled service.

Final thoughts on systemd

It may take you some time to get used to systemd, but you should plan to use it now before it becomes a requirement and management through legacy tools is no longer available. You should find that systemd makes managing services easier than it used to be with SysV.

Adminer—Better Than Awesome!

$
0
0
http://www.linuxjournal.com/content/adminer%E2%80%94better-awesome

I've always loved PHPMyAdmin for managing MySQL databases. It's Web-based, fairly robust and as powerful as I've ever needed. Basically, it's awesome. Today, however, I discovered something better than awesome: Adminer. Although it is conceptually identical to PHPMyAdmin, it is far simpler and far more powerful. How can it be both? The Adminer Web site has a great feature comparison: http://www.adminer.org/en/phpmyadmin.
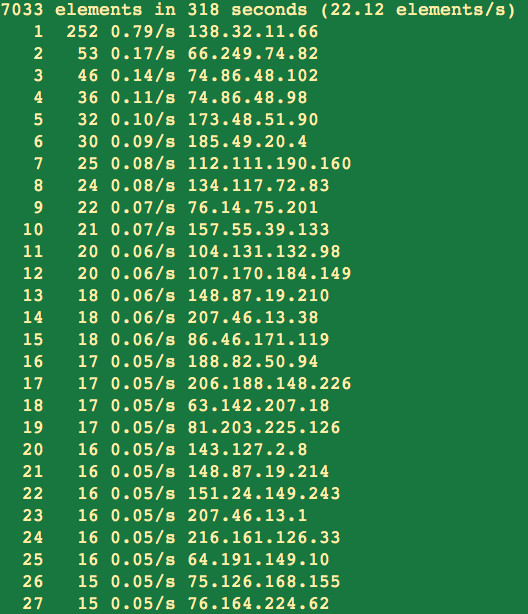
For me, the interface is basic, no-nonsense and intuitive. I like that installation is a single PHP file, and I also like that it supports alternate database systems like Postgres. If you are someone who prefers to use a Web interface over the command line, don't be ashamed. Heck, I recently managed an entire database department at a university, and I still prefer a Web-based interface. Anyway, if you're like me, you'll love Adminer. Get your copy today at http://www.adminer.org.

Modify web content with Apache's mod_substitute and mod_headers

$
0
0
http://www.openlogic.com/wazi/bid/351267/modify-web-content-with-apaches-mod_substitute-and-mod_headers

Ever heard of mod_substitute or mod_headers? These two Apache modules give you additional control over the content Apache serves. They can be useful in creating a staging environment, fixing unsupported web applications, or just adding custom HTTP headers for troubleshooting and monitoring.

Modifying content with mod_substitute

Mod_substitute allows you to modify the web content Apache serves to clients after all web code has been executed and all other Apache directives have been processed. It lets you replace strings without touching the web code. It works on both content coming from Apache (such as static pages and server-side scripts) and forwarded content in cases when Apache acts as proxy.
Mod_substitute is part of the default Apache installations in most Linux distributions, including CentOS and Ubuntu. In CentOS mod_substitute is enabled by default, but in Ubuntu you have to enable it with the command a2enmod substitute. You can confirm mod_substitute is installed on your server with the command apachectl -t -D DUMP_MODULES |grep substitute_module. The command output should include the name of the module if mod_susbstitute is installed.
Mod_substitute can be used per location context within a given Apache instance. This means that you can apply its rules either to a whole site (Location /) or recursively for a directory and its subdirectories (Location /somedirectory). You can add mod_substitute directives either to the global Apache context in the main /etc/httpd/conf.d/httpd.conf file or to a specific virtual host.
Here is an example of a mod_substitute directive that changes a URL for a production site from www.example.org to that of a staging site at test.example.org. You can use this to create a staging environment:

AddOutputFilterByType SUBSTITUTE text/html
Substitute s/www\.example\.org/test.example.org/i

The first directive AddOutputFilterByType SUBSTITUTE text/html creates an output filter for the HTML part of the web content. The Substitute directive uses a regular expression to search for a string (wwww\.example\.org) and replace it with the a different string (test.example.org). The i flag indicates a case-insensitive search. Another flag you might find useful, n, defines the second argument as a fixed string instead of a regular expression.
Mod_substitute can replace text, links, and even HTTP headers. Being able to replace all of these items is useful if you wish to have a staging site for an application like WordPress or Joomla that is configured by your production FQDN (example.org). If an application is configured to work at one FQDN, it often will not work properly when accessed under another, with broken links or images that won't load because of the different FQDN. Mod_substitute resolves this problem.
Substituting HTTP headers works as described only with Apache 2.2, which is still widely considered the most stable and production-ready version. In Apache 2.4, the code above will not make a substitution in the HTTP headers because of core functionality changes in the Apache web server software. If you want to make substitutions in the headers you have to use mod_headers.

Modifying HTTP headers with mod_headers

Having the ability to modify HTTP headers allows you to control HTTP parameters such as redirects and create custom HTTP headers. Mod_headers saves you from having to reconfigure header information in unsupported web application or in staging environments. It also lets you add custom headers or remove unwanted ones. Custom headers can be useful in many situations – for instance, if you have a multinode balanced Apache environment and you wish to identify which node serves each request.
Like mod_substitute, mod_headers comes with the default Apache installations in most Linux distributions. While it's enabled by default in CentOS, you have to enable it in Ubuntu with the command a2enmod headers.
As previously mentioned, since Apache version 2.4 you can no longer manage the HTTP headers with mod_substitute – you should use mod_headers. However, even though mod_headers is in Apache 2.2, for changing headers such as redirects it's better to use mod_substitute.
To change HTTP redirects from www.example.org to test.example.org with mod_headers, use the following directive in either the global Apache configuration or in a vhost context:
Header edit Location ^http://www\.example\.org http://test.example.org
To test whether this directive worked, you could create a PHP file with the following content:

When you access this file with your browser, you should be redirected to http://test.example.org instead of http://www.example.org if your mod_headers rule works correctly in Apache 2.4. For Apache 2.2. you can should instead use mod_substitute.
With mod_headers you can also remove headers or add custom ones. This can be of use, for example, when you have several load-balanced web servers and for troubleshooting reasons you wish to identify which one is handling your request. You can do that by adding the directive Header add Node Node1 to add a custom HTTP header called Node and identify a given server as Node1. You would set the Node value to Node2 for the second balanced web server, and so on.
To verify that these header settings work as intended, you need a browser plugin that traces HTTP header information, such as HTTP Headers for Google Chrome. Alternatively, from the Linux command line, you can use lynx and its -head option to view all headers for a page: lynx -head -dump http://example.org.
Mod_headers can also work with dynamic variables, which means that, for example, you can add a header for reporting how much time it takes Apache to server a request. To do that, use the directive Header set Loadtime "%D", which creates a new header Loadtime and reports the time in milliseconds. You could use this header to monitor the performance of the web server by extending Nagios for custom monitoring.
However, not all headers can be modified with mod_headers. For example, the Server header, which specifies the HTTP server name (Apache) and its version, cannot. If you want to modify those headers, you should instead use ModSecurity and its SecServerSignature setting, as described in the Wazi article on how to protect and audit your web server with ModSecurity.
As you can see, mod_substitute and mod_headers are simple to use but powerful and extremely useful. Excellent modules such as these are among the reasons Apache continues to be the preferred web server.

How to configure chroot SFTP in Linux

$
0
0
http://www.linuxtechi.com/configure-chroot-sftp-in-linux

There are some scenario where system admin wants only few users should be  allowed to transfer files to Linux boxes not ssh. We can achieve this by setting up SFTP in chroot environment.
Background of SFTP & chroot :
SFTP stands for SSH File Transfer protocol or Secure File Transfer Protocol. SFTP provides file access, file transfer, and file management functionalities over any reliable data stream. When we configure SFTP in chroot environment , then only allowed users will be limited to their home directory , or we can say allowed users will be in jail like environment where they can’t even change their directory.
In article we will configure Chroot SFTP in RHEL 6.X& CentOS 6.X. We have one user ‘Jack’ , this users will be allowed to transfer files on linux box but no ssh access.
 
Step:1  Create a group
[root@localhost ~]# groupadd  sftp_users
 
Step:2 Assign the secondary group(sftp_users) to the user.
If the users doesn’t exist on system , use below command :
[root@localhost ~]# useradd  -G sftp_users  -s /sbin/nologin  jack
[root@localhost ~]# passwd jack
For already existing users , use below usermod command :
[root@localhost ~]# usermod –G sftp_users  -s /sbin/nologin  jack
Note : if you want to change the default home directory of users , then use ‘-d’ option in useradd and usermod  command and set the correct permissions.
 
Step:3 Now edit the config file “/etc/ssh/sshd_config”  
# vi /etc/ssh/sshd_config
#comment out the below line and add a line like below
#Subsystem sftp /usr/libexec/openssh/sftp-server
Subsystem sftp internal-sftp
# add Below lines  at the end of file
Match Group sftp_users
  X11Forwarding no
  AllowTcpForwarding no
  ChrootDirectory %h                    
  ForceCommand internal-sftp
Where :
Match Group sftp_users– This indicates that the following lines will be matched only for users who belong to group sftp_users
ChrootDirectory %h– This is the path(default user's home directory) that will be used for chroot after the user is authenticated. So, for Jack, this will be /home/jack.
ForceCommand internal-sftp– This forces the execution of the internal-sftp and ignores any command that are mentioned in the ~/.ssh/rc file.
Restart the ssh service
# service sshd restart
 
Step:4 Set the Permissions :
[root@localhost ~]# chmod 755 /home/jack
[root@localhost ~]# chown root /home/jack
[root@localhost ~]# chgrp -R sftp_users /home/jack
If You want that jack user should be allowed to upload files , then create a upload folder with the below permissions ,
[root@localhost jack]# mkdir /home/jack/upload
[root@localhost jack]# chown jack. /home/jack upload/
 
Step:5  Now try to access the system & do testing
Try to access the system via ssh
ssh-try
As You can see below jack user is logged in  via SFTP and can't change the directory becuase of chroot environment.
sftp-login
Now do the uploading and downloading testing as shown below:
sftp-upload-downloadAs we can see above , both uploading & downloading working fine for jack user.

More GDB tips and tricks

$
0
0
http://www.openlogic.com/wazi/bid/351471/more-gdb-tips-and-tricks

The GNU Debugger (GDB) is a powerful tool for developers. In an earlier article I talked about how to use breakpoints and watchpoints, and how to auto-display values and call user-defined and system functions. This time, let's see how to use GDB to examine memory and debug macros and signal handlers. To create the examples here, I used GDB 7.6.1 and GCC 4.8.1, and compiled the C code using the -ggdb option.

Examine memory

Use GDB's x command to examine memory. The command offers several formatting options that let you control the number of bytes to display and the way you'd like to display them.
The syntax of the command is x/FMT ADDRESS, where FMT specifies the output format and ADDRESS is the memory address to be examined. FMT consists of three types of information: the repeat count, the display format, and the unit size. For example: x/3uh 0x786757 is a request to display three halfwords (h) of memory, formatted as unsigned decimal integers (u), starting at address 0x786757. Available format letters are o (octal), x (hex), d (decimal), u (unsigned decimal), t (binary), f (float), a (address), i (instruction), c (char) and s (string), while available unit size letters are b (byte), h (halfword), w (word), g (giant, 8 bytes). And it doesn't matter whether the unit size or format comes first; either order works.
To understand how to use the x command, consider the following code:
#include 
#include

void func(char *ptr)
{
char tmp[] = "someOtherString";
char *new_ptr = ptr+3;
if(strncmp(tmp, new_ptr, sizeof(tmp)))
{
/*
* Some processing
*/
}
}

int main(void)
{
func("1. Openlogic");
return 0;
}
Suppose the main() and the func() functions are in different modules, and while debugging a problem you want to examine the value pointed to by the new_ptr pointer. Load the program using GDB, put a breakpoint at the strncmp line, then run the program. Once the program hits the breakpoint, you'll get a prompt:
$ gdb test
Reading symbols from /home/himanshu/practice/test...done.
(gdb) break 8
Breakpoint 1 at 0x80484a9: file test.c, line 8.
(gdb) run
Starting program: /home/himanshu/practice/test

Breakpoint 1, func (ptr=0x8048590 "1. Openlogic") at test.c:8
8 if(strncmp(tmp, new_ptr, sizeof(tmp)))
(gdb)
Run x/s new_ptr at this prompt, and you'll get the following output:
(gdb) x/s new_ptr
0x8048593: "Openlogic"
(gdb)
The x command with the s format letter displays the value stored at the memory address pointed by new_ptr as a string. To display the value in character format, change the format specifier to c:
(gdb) x/9c new_ptr
0x8048593: 79 'O' 112 'p' 101 'e' 110 'n' 108 'l' 111 'o' 103 'g' 105 'i'
0x804859b: 99 'c'

Debugging macros

One of the biggest reasons developers prefer inline functions over macros is that debuggers tend to be better at dealing with the former. For example, consider the following code:
#include 

#define CUBE(x) x*x*x

int main(void)
{
int a =3;
printf("\n The cube of [%d] is [%d]\n", a+1, CUBE(a+1));
return 0;
}
The cube of 4 is 64, but watch what happens when you run the program:
$ ./test

The cube of [4] is [10]
It can be a nightmare to pinpoint the cause of this kind of problem in a project with a large code base, as most debuggers simply aren't good at debugging macros.
GDB doesn't know anything about macros by default either, but you can enable macro debugging in the debugger using compile-time flags such as -gdwarf-2 and -g3; for more info on these options, read the man page of the GCC compiler. Once the program is compiled with the aforementioned command-line options, load and run it with GDB in the standard way. Put in a breakpoint so that you can debug the macro while the program is running:
$ gdb test
Reading symbols from /home/himanshu/practice/test...done.
(gdb) break 9
Breakpoint 1 at 0x8048459: file test.c, line 9.
(gdb) run
Starting program: /home/himanshu/practice/test

The cube of [4] is [10]

Breakpoint 1, main () at test.c:9
9 return 0;
(gdb)
When the program hits the breakpoint, run the following command to see how the macro is expanded:
(gdb) macro expand CUBE(3+1)
expands to: 3+1*3+1*3+1
That expansion is equivalent to: 3 + ( 1 * 3 ) + ( 1 * 3 ) + 1, or 10. Once you know the problem, you can easily correct it by redefining the macro as #define CUBE(x) (x)*(x)*(x).
You can also use the info macro command to find out more about a macro. For example:
(gdb) info macro CUBE
Defined at /home/himanshu/practice/test.c:3
#define CUBE(x) x*x*x
Read this document to learn more on how to debug macros using GDB.

Debugging signal handlers

Debugging signal handlers is not as easy as debugging normal functions with GDB. For example, consider the following program:
#include 
#include
#include

void sighandler(int signum)
{
printf("\n Caught SIGNIT - : %d", signum);
}

int main()
{
signal(SIGINT, (void*)sighandler);

while (1)
{
printf("\n Waiting for user action...");
sleep(1);
}
}
The program defines a signal handler for SIGINT, which is usually generated when someone presses Ctrl-C. Load the program using GDB, put a breakpoint at the sighandler() function, as you would do for any other normal function that you want to debug, then run the program:
$ gdb test
Reading symbols from /home/himanshu/practice/test...done.
(gdb) break sighandler
Breakpoint 1 at 0x8048483: file test.c, line 7.
(gdb) run
Starting program: /home/himanshu/practice/test

Waiting for user action...
Now generate the SIGINT signal by pressing Ctrl-C, and you'll see the problem:
Waiting for user action...
^C
Program received signal SIGINT, Interrupt.
0xb7fdd424 in __kernel_vsyscall ()
(gdb)
Instead of the breakpoint being hit, the signal is intercepted by the debugger.
To alter this behavior, use the handle command. It expects a list of signals, along with the actions to be applied on them. In this case, the actions nostop and pass are of interest. The former makes sure that GDB doesn't stop the program when the signal happens, while the latter makes sure that GDB allows the program to see this signal.
Run the handle command after setting the breakpoint:
$ gdb test
Reading symbols from /home/himanshu/practice/test...done.
(gdb) break sighandler
Breakpoint 1 at 0x8048483: file test.c, line 7.
(gdb) handle SIGINT nostop pass
SIGINT is used by the debugger.
Are you sure you want to change it? (y or n) y
Signal Stop Print Pass to program Description
SIGINT No Yes Yes Interrupt
(gdb)
Make sure you answer in the affirmative the question asked by the debugger. Now when you run the program and press Ctrl-C to generate and send SIGINT, the breakpoint is hit:
(gdb) run
Starting program: /home/himanshu/practice/test

Waiting for user action...
^C
Program received signal SIGINT, Interrupt.

Breakpoint 1, sighandler (signum=2) at test.c:7
7 printf("\n Caught SIGNIT - : %d", signum);
(gdb)

Conclusion

All the debugging commands described here can do even more for you. If you want to share another useful GDB feature or command, please leave a comment below.

What are better alternatives to basic command line utilities

$
0
0
http://xmodulo.com/2014/07/better-alternatives-basic-command-line-utilities.html

The command line can be scary especially at the beginning. You might even experience some command-line-induced nightmare. Over time, however, we all realize that the command line is actually not that scary, but extremely useful. In fact, the lack of shell is what gives me an ulcer every time I have to use Windows. The reason for the change in perception is that the command line tools are actually smart. The basic utilities, what you are given to work with on any Linux terminal, are very powerful. But very powerful is never enough. If you want to make your command line experience even more pleasant, here are a few applications that you can download to replace the default ones, and will provide you with far more features than the originals.

dfc

As an LVM user, I really like to keep an eye on my hard drive memory usage. I also never really understood why in Windows we have to open the file explorer to know this basic information. Hopefully on Linux, we can use the command.
$ df -h

which gives you the size, usage, free space, ratio, and mount point of every volume on your computer. Notice that you have to pass in the "-h" argument to get all the data in human readable format (gigabytes instead of kilobytes). But you can replace completely df with dfc, which can, without any additional arguments, get you everything that df showed, and throw in a usage graph for each device, and a color code, which makes it a lot easier to read.

As a bonus, you can sort the volumes using the argument "-q", define the units that you want to see with "-u", and even export to csv or html format with "-e"

dog

Dog is better than cat. At least that is what this program declares. You have to give it credit for once. Everything that the cat command does, dog does it better. Beyond just outputting some text stream to the console, dog is capable of filtering that stream. You can for example find all images in a web page by using the syntax:
$ dog --images [URL]

Or all the links with:
dog --links [URL]

Besides, dog commands can also do other smaller tasks, like convert to upper or lower case, use different encoding, display the line numbers, and deal with hexadecimal. In short, dog is a must-have to replace cat.

advcp

One of the most basic command in Linux is the copy command: cp. It is probably as basic as cd. Yet it cruelly lacks feedback. You can enable the verbose mode to see which files are being copied in real time, but if one of the files is very big, you will be left waiting in front of your screen with no idea of what is really happening behind the scenes. An easy way to fix that is to add a progress bar: what advcp (short for advanced cp) does! Available as a patched version of the GNU coreutils, advcopy provides you with the acp and amv commands, which are "advanced" versions of cp and mv. Use the syntax:
$ acp -g [file] [copy]
to copy a file to another location, and display a progress bar.

I also advise using an alias in your .barshrc or .zshrc
1
2
aliascp="acp -g"
aliasmv="amv -g"

The Silver Searcher

Behind this atypical name, the silver searcher is a utility designed as a replacement for grep and ack. Intended to be faster than ack, and capable of ignoring files unlike grep, the silver searcher scrolls through your text file looking for the piece that you want. Among other features, it can spit out a colored output, follow symlink, use regular expressions, and even ignore some patterns.

The developers' website provides us with some benchmark statistic on the search speed which, if they are still true, are quite impressive. And cherry on the cake: you can include the utility in Vim in order to call it with a simple shortcut. In two words, smart and fast.

plowshare

All fans of the command line like to use wget or one of its alternatives to download things from the internet. But if you use a lot of file sharing websites, like mediafire or rapidshare, you will be glad to know that there is an equivalent to wget dedicated to those websites, which is called plowshare. Once you install it, you can download files with:
$ plowdown [URL]
or upload them with:
$ plowup [website name] [file]
given that you have an account for that file sharing website.
Finally, it is possible to gather information, such as a list of links contained in a shared folder with:
$ plowlist [URL]
or the filename, size, hash, etc, with:
$ plowprobe [URL]
plowshare is also a good alternative to the slow and excruciating jDownloader for those of you who are familiar with these services.

htop

If you use top command regularly, chances are you will love htop command. Both top and htop offer a real-time view of running processes, but htop boasts of a number of user-friendly features lacking in top command. For example, with htop, you can scroll process list vertically or horizontally to see full command lines of every process, and can do basic process management (e.g., kill, (re)nice) using mouse clicks and arrow keys (without entering numeric PIDs).

mtr

One of essential network diagnostic tools for system admins is traceroute which shows layer-3 routing path from a local host to a destination host. mtr (short for "My Traceroute") advances the venerable traceroute by integrating ping with it. Once a full routing path is discovered, mtr prints running statistics of ping delays to all intermediate router hops, making it extremely useful to characterize link delays. While there are other variations of traceroute (e.g., tcptraceroute or traceroute-nanog), I believe mtr is the most practical enhancement of traceroute tool.

To conclude, these kinds of tools, which efficiently replace basic command line utilities, are like little pearl of usefulness. They are not always easy to find, but once you've got one, you always wonder how you survived for so long without it. If you know any other utility fitting this description, please share in the comments.

tpp - the command line presentation tool

$
0
0
http://linuxconfig.org/tpp-the-command-line-presentation-tool

There is no need to install tons of software in order to create a nice and informative presentation. tpp is a simple to use command line presentation tool which allows you to create a fancy text based slide show presentation and share it with your colleges or students as an ordinary ASCII text file. tpp supports colors, slide-in, source code output, animated command line execution and a real time command executions all available from within your terminal.

Linux command line presentation tool TPP example

Let's create a simple presentation consisting of 2 slides. First, create a new text file with some arbitrary name like sample.tpp. Once ready, start with the presentation header:
--author by LinuxConfig.org
--title TPP Sample Perl Presentation
--date today
--heading Where is Perl used?

The above will create presentation header including author, title, current date and heading, all centered in the middle of the page. To emulate a "break" tpp use 3x hyphen syntax. Anytime you put --- into your tpp source code a SPACE press will be needed to continue with the presentation. Next we create a list of item using different colors and slide-in from top and left. Make sure to reset foreground color to white at the end for the list:
---
--color green
* Web sites and Web services
---
--beginslideleft
--color blue
* Data analysis
---
--endslideleft
--beginslidetop
--color red
* System administration
--color white
--endslidetop
The above will create nice slide-in animation for last to items and --- will ensure the correct manual timing by presenter. --center command can be used to display centered headings.
---
--center Source Code
Next, we display a source code using --beginoutput command. This will put a nice frame around the code. If you need to display source code lines one by one feel free to include --- between the lines.
--beginoutput

#!/usr/bin/perl

print "Hello World!";

--endoutput
What follows next is a animated command line execution. In this case tpp will animate command typing and display in output on the next line. This is one a real time execution as you will need to include your output to tpp's source file:
--center Shell Output
---
--beginshelloutput
$ perl -e 'print "Hello World!\n"'
Hello World!
--endshelloutput
So far all about examples were displayed on a single slide. tpp allows for multiple slides presentation and this can be achieved by --newpage command.
---
--newpage
--boldon
--revon
--center Please check Perl's Manual Page for more info
For additional decorating purposes the above code uses --boldon command to make text bold and --revon to produce reverse black-on-white text style. For more information about ttp visit tpp's manual page:
$ man tpp
SOURCE CODE SUMMARY:
--author by LinuxConfig.org
--title TPP Sample Presentation
--date today
--heading Where is Perl used?
---
--color green
* Web sites and Web services
---
--beginslideleft
--color blue
* Data analysis
---
--endslideleft
--beginslidetop
--color red
* System administration
--color white
--endslidetop
---
--center Source Code
--beginoutput

#!/usr/bin/perl

print "Hello World!";

--endoutput
--center Shell Output
---
--beginshelloutput
$ perl -e 'print "Hello World!\n"'
Hello World!
--endshelloutput
---
--newpage
--boldon
--revon
--center Please check Perl's Manual Page for more info

Linux/UNIX Awk Command Tutorial with Examples

$
0
0
http://www.linuxtechi.com/awk-command-tutorial-with-examples

AWK  Stands for 'Aho, Weinberger, and Kernighan'
Awk is a scripting language which is used  for  processing or analyzing text files. Or we can say that awk is mainly used for grouping of data based on either a column or field , or on a set of columns. Mainly it's used for reporting data in a usefull manner. It also employs Begin and End Blocks to process the data.
Syntax of awk :
# awk 'pattern {action}' input-file > output-file
Lets take a input file with the following data
$ cat  awk_file
Name,Marks,Max Marks
Ram,200,1000
Shyam,500,1000
Ghyansham,1000
Abharam,800,1000
Hari,600,1000
Ram,400,1000


Example:1 Print all the lines from a file.
By default, awk prints all lines of a file , so to print every line of above created file use below command :
linuxtechi@mail:~$ awk '{print;}' awk_file
Name,Marks,Max Marks
Ram,200,1000
Shyam,500,1000
Ghyansham,1000
Abharam,800,1000
Hari,600,1000
Ram,400,1000


Example:2 Print only Specific field like 2nd & 3rd.

linuxtechi@mail:~$ awk -F ","'{print $2, $3;}' awk_file
Marks Max Marks
200 1000
500 1000
1000
800 1000
600 1000
400 1000

In the above command we have used the option  -F “,”  which specifies that comma (,) is the field separator in the file

Example:3 Print the lines which matches the pattern
I want to print the lines which contains the word “Hari & Ram”
linuxtechi@mail:~$ awk '/Hari|Ram/' awk_file
Ram,200,1000
Hari,600,1000
Ram,400,1000


Example:4 How do we find unique values in the first column of name
linuxtechi@mail:~$ awk -F, '{a[$1];}END{for (i in a)print i;}' awk_file
Abharam
Hari
Name
Ghyansham
Ram
Shyam

 
Example:5  How to find the sum of data entry in a particular column .
Synatx :  awk -F, '$1=="Item1"{x+=$2;}END{print x}' awk_file
linuxtechi@mail:~$ awk -F, '$1=="Ram"{x+=$2;}END{print x}' awk_file
600

Example:6  How to find the  total of all numbers in a column.
For eg we take the 2nd and the 3rd column.
linuxtechi@mail:~$ awk -F","'{x+=$2}END{print x}' awk_file
3500
linuxtechi@mail:~$ awk -F","'{x+=$3}END{print x}' awk_file
5000

Example:7  How to find the sum of individual group records.
Eg if we consider the first column than we can do the summation for the first column based on the items
linuxtechi@mail:~$ awk -F, '{a[$1]+=$2;}END{for(i in a)print i”, “a[i];}' awk_file
Abharam, 800
Hari, 600
Name, 0
Ghyansham, 1000
Ram, 600
Shyam, 500

Example:8 How to find the sum of all entries in second column  and append it to the end of the file.
linuxtechi@mail:~$ awk -F","'{x+=$2;y+=$3;print}END{print "Total,"x,y}' awk_file
Name,Marks,Max Marks
Ram,200,1000
Shyam,500,1000
Ghyansham,1000
Abharam,800,1000
Hari,600,1000
Ram,400,1000
Total,3500 5000


Example:9 How to find the count of entries against every column based on the first column:
linuxtechi@mail:~$ awk -F, '{a[$1]++;}END{for (i in a)print i, a[i];}' awk_file
Abharam 1
Hari 1
Name 1
Ghyansham 1
Ram 2
Shyam 1


Example:10 How to print only the first record of every group:
linuxtechi@mail:~$ awk -F, '!a[$1]++' awk_file
Name,Marks,Max Marks
Ram,200,1000
Shyam,500,1000
Ghyansham,1000
Abharam,800,1000
Hari,600,1000


AWK Begin Block
Syntax for BEGIN block is
 # awk ‘BEGIN{awk initializing code}{actual AWK code}’ filename.txt
Let us create a datafile with below contents

 
Example:11  How to populate each column names along with their corresponding data.
linuxtechi@mail:~$ awk 'BEGIN{print "Names\ttotal\tPPT\tDoc\txls"}{printf "%-s\t%d\t%d\t%d\t%d\n", $1,$2,$3,$4,$5}' datafile
awk-begin

Example:12 How to change the Field Separator
As we can see space is the field separator in the datafile , in the below example we will change field separator  from space to "|"
linuxtechi@mail:~$ awk 'BEGIN{OFS="|"}{print $1,$2,$3,$4,$5}' datafile
awk-field-separator


Install fonts on Linux – Debian, Ubuntu, Kali, Mint – Microsoft TrueType core and many more 2

$
0
0
http://www.blackmoreops.com/2014/07/31/install-fonts-on-linux


Installing fonts is important for those who are multilingual or want to spice up their screen. Many websites uses different fonts and without having to install fonts on Linux, you wont see those, you will see a flat boring default font. I will also show how to reconfigure your fontconfig so that it looks better on your CRT or LCD screen.
This posts shows how you can install fonts and configure them on the following Linux Operating systems:
  1. Debian Linux
  2. Ubuntu Linux
  3. Linux Mint
  4. Kali Linux
  5. Any Debian or Ubuntu Variant such as Elementary OS

The basic – Microsoft TrueType core Fonts

This package allows for easy installation of the Microsoft True Type Core Fonts for the Web including:
  Andale Mono
Arial Black
Arial (Bold, Italic, Bold Italic)
Comic Sans MS (Bold)
Courier New (Bold, Italic, Bold Italic)
Georgia (Bold, Italic, Bold Italic)
Impact
Times New Roman (Bold, Italic, Bold Italic)
Trebuchet (Bold, Italic, Bold Italic)
Verdana (Bold, Italic, Bold Italic)
Webdings
You will need an Internet connection to download these fonts if you don’t already have them.

NOTE: the package ttf-liberation contains free variants of the Times, Arial and Courier fonts. It’s better to use those instead unless you specifically need one of the other fonts from this package.

Install instructions:

First of all let’s check if we even have those fonts in our repositories. I use Kali Linux which is a variant of Debian Linux. If you’re using Kali, you need to add the default official repositories.
Let’s do an apt-cache search:
root@kali:~# apt-cache search ttf-mscorefonts-installer 
ttf-mscorefonts-installer - Installer for Microsoft TrueType core fonts
apt-cache search fonts - blackMORE Ops

That means we are good to go. If not, follow the link above to add official repositories for Kali Linux (or if you’re using Debian Linux or Ubuntu Linux (or even Linux Mint variants), go and add official repositories for that.)
Now install Microsoft TrueType core using a single command:
root@kali:~# 
root@kali:~# apt-get install ttf-mscorefonts-installer
(output below)

Note: If you’re behind a proxy server or TOR network, this install might not work, it seems you must be directly connected to Internet.
Similar font package you can also install
Here’s a list of other fonts that you can install, follow is a list of package names, that means you can use
apt-get install 
to install these
    ttf-liberation
    fonts-liberation
    ttf-uralic
    fonts-uralic
    ttf-root-installer
    ttf-freefont
    ttf-dustin
    ttf-linux-libertine
    fonts-linuxlibertine
    fonts-dustin
    ttf-staypuft
For example:

apt-get install ttf-staypuft

install more fonts - Debian Linux or Kali Linux - blackMORE Ops

More ways to install fonts (XORG) on Debian, Ubuntu or other Debian (i.e. Kali Linux) based systems

Sometimes you download  .ttf file (a font file) and you want to install it directly. In that case, copy the font file to one of the following directory.
The fonts can be copied in one of this directories:
  1. /usr/share/fonts
  2. /usr/share/X11/fonts
  3. /usr/local/share/fonts
  4. ~/.fonts
Here’s how the directories work.
If you want the fonts for everyone on the system (i.e. in a multiuser environment) then put them on /usr/share/fonts.

If you only want the fonts for yourself, then put them on ~.fonts directory of your home folder.
Once you’ve copied the files in correct places, issue the following command to which will read and cache all installed fonts from these directories.
root@kali:~# fc-cache -fv
Now if you want to list all installed and cached fonts on your system, you need to use fc-list command.
Sample output below:
root@kali:~# fc-list

Configuring Fonts on Linux

Now if you want to reconfigure or configure hows fonts are displayed on your system, you use the following command:
root@kali:~# dpkg-reconfigure fontconfig-config
It will present you with  a series of options where you select what you want.
The first option is if you want Native, Autohinter or None tuning for your fonts.
dpkg-reconfigure fontconfig-config - blackMORE Ops-
I’ve selected Native on the above screen and pressed Ok.
On the next screen, it will ask you whether you want to enable subpixel rendering for screen.
dpkg-reconfigure fontconfig-config - subppixel rendering blackMORE Ops-

Obviously we want that, it makes fonts look a lot better on flat (LCD) screen, at the sametime if you’re using a CRT screen, it might break a few things. So automatic is the way to go. (in my personal case, I should’ve chosed Always and I am using a LCD screen, the choice is yours to make). Press Ok to move to the next screen.

The last screen was asking me whether I want to enable bitmapped fonts by default. I selected Yes … (duh! I wasn’t actually sure, but heck, I can come back anytime and run the dpkg reconfigure command to fix any problems. So why not? )
dpkg-reconfigure fontconfig-config - enable bitmapped fonts -  blackMORE Ops
Choose your option and press Enter.
Do fonts on your screen looks better now?

Downloading and installing a font

During my search I came across this great website that contains free fonts.http://www.dafont.com/
So I decided I want to download a Gothic Font for fun.
root@kali:~# wget http://img.dafont.com/dl/?f=old_london -O old_london.zip

Please note that I used -O old_london.zip file as the output name. It’s because the website doesn’t provide a direct link to the file.

download a font file using wget - blackMORE Ops
Uncompress the file:
root@kali:~# ls
Desktop  Downloads  old_london.zip  Work
root@kali:~# unzip old_london.zip
Archive:  old_london.zip
  inflating: OldLondon.ttf           
  inflating: OldLondonAlternate.ttf  
  inflating: Olondon_.otf            
  inflating: Olondona.otf            
root@kali:~#

Move the font files (*.ttf) to /usr/share/fonts folder.
root@kali:~# mv OldLondon.ttf OldLondonAlternate.ttf /usr/share/fonts/
root@kali:~#
Rebuild your font cache.
root@kali:~# fc-cache -f
root@kali:~#

Confirm that the files exists in font cache now.
root@kali:~# fc-list | grep OldLondon
/usr/share/fonts/OldLondon.ttf: Old London:style=Regular
/usr/share/fonts/OldLondonAlternate.ttf: Old London Alternate:style=Regular
root@kali:~#
Installing Fonts and confirming it - blackMORE Ops

So now that we have fonts and all, lets type to see how it really looks like:
How custom fonts Looks in Leafpad

It reads
blackMORE Ops
Welcome to the
Temple of the King
(A song title from Rainbow in case you're wondering)


Conclusion:

The best take from this post would be installing new fonts. I think this solves font config for any Linux distributions. Enjoy and try out some interesting fonts.

Thanks for reading. Please share.

Echo Command with Practical Examples

$
0
0
http://www.nextstep4it.com/categories/unix-command/echo-command

echo command is built in shell command , which is used to display the value of a variable or print a line of text.  Echo command plays a important role in building a shell script.

Synatx :


# echo [Options] [String]

The items in square brackets are optional. A string can be defined as  finite sequence of characters (like letters, numerals, symbols  punctuation marks).

When echo command is used without any options or strings, echo returns a blank line on the display screen followed by the command prompt on the subsequent line. This is because pressing the ENTER key is a signal to the system to start a new line, and thus echo repeats this signal.

Options :


-n     do not output the trailing newline
-e     enable interpretation of backslash escapes
-E     disable interpretation of backslash escapes (default)


If -e is in effect, the following sequences are recognized:

\\     backslash
\a     alert (BEL)
\b     backspace
\c     produce no further output
\e     escape
\f     form feed
\n     new line
\r     carriage return
\t     horizontal tab
\v     vertical tab
\0NNN  byte with octal value NNN (1 to 3 digits)
\xHH   byte with hexadecimal value HH (1 to 2 digits)

Example :1  Display the value of System Defined Variables


Using the set command , we can list the system define variables and to print the vaule of these variables we can use echo command :

jack@localhost:~$ echo $USER
jack
jack@localhost:~$ echo $HOME
/home/jack

Example:2 Display the value of User defined Variables :


jack@nextstep4it:~$ var1=`date`
jack@nextstep4it:~$ echo "Today's date  time is : $var1"
Today's date  time is : Mon Jul 28 13:11:37 IST 2014
 

Example:3 Display the text String


jack@nextstep4it:~$ echo " Hi this echo command testing"
Hi this echo command testing

Example:4 Use of backspace in echo command


jack@nextstep4it:~$ echo -e "Ubuntu \bis \bthe \bbest \bDesktop \bOS"
Above Command will Print :
UbuntuisthebestDesktopOS

Example:5  Use of  tab space in echo command


nextstep4it@nextstep4it:~$ echo -e "Ubuntu \tis \tthe \tbest \tDesktop \tOS"
Above command will show below output :
Ubuntu          is         the      best     Desktop         OS

Example:6 Use of Vertical tab in echo Command


jack@nextstep4it:~$ echo -e "Ubuntu \vis \vthe \vbest \vDesktop \vOS"
Ubuntu
       is
              the
                     best
                            Desktop
                                          OS

Example:7  Colored output of echo command


echo command can change the font style, background color of fonts and font colors. Escape sequence \033 can be used to alter font properties. -e option has to be used in order to the escape sequence be in effect. Some of escape codes are listed below :

  • [0m: Normal
  • [1m: Bold fonts
  • [2m: Font color changes to Purple
  • [4m: Underlined fonts
  • [7m: Invert foreground and background colors
  • [8m: Invisible fonts
  • [9m: Cross lined fonts
  • [30m: Font color changes to Grey 
  • [31m: Font color changes to Red
  • [32m: Font color changes to Green
  • [33m: Font color changes to Brown
  • [34m: Font color changes to Blue
  • [35m: Font color changes to Violet
  • [36m: Font color changes to Sky Blue
  • [37m: Font color changes to Light Grey
  • [38m: Font color changes to Black
  • [40m: Background color changes to Black
  • [41m: Background color changes to Red
  • [42m: Background color changes to Green
  • [43m: Background color changes to Brown
  • [44m: Background color changes to Blue
  • [45m: Background color changes to Violet
  • [46m: Background color changes to Sky Blue
  • [47m: Background color changes to Light Grey


Below command will print the output in red color.

jack@nextstep4it:~$ echo -e "\033[31mMagic of Linux\033[0m"
Magic of Linux

Below Command will print “Magic of Linux” in bold style and red background color.

nextstep4it@nextstep4it:~$ echo -e "\033[1m\033[41mMagic of Linux\033[0m"

How to set up a Samba file server to use with Windows clients

$
0
0
http://xmodulo.com/2014/08/samba-file-server-windows-clients.html

According to the Samba project web site, Samba is an open source/free software suite that provides seamless file and print services to SMB/CIFS clients. Unlike other implementations of the SMB/CIFS networking protocol (such as LM Server for HP-UX, LAN Server for OS/2, or VisionFS), Samba (along with its source code) is freely available (at no cost to the end user), and allows for interoperability between Linux/Unix servers and Windows/Unix/Linux clients.
For these reasons, Samba is the preferred solution for a file server in networks where different operating systems (other than Linux) coexist - the most common setup being the case of multiple Microsoft Windows clients accessing a Linux server where Samba is installed, which is the situation we are going to deal with in this article.
Please note that on the other hand, if our network consists of only Unix-based clients (such as Linux, AIX, or Solaris, to name a few examples), we can consider using NFS (although Samba is still an option in this case), which has greater reported speeds.

Installing Samba in Debian and CentOS

Before we proceed with the installation, we can use our operating system's package management system to look for information about Samba:
On Debian:
# aptitude show samba
On CentOS:
# yum info samba
In the following screenshot we can see the output of 'aptitude show samba' ('yum info samba' yields similar results):

Now let's install Samba (the screenshot below corresponds to the installation on a Debian 7 [Wheezy] server):
On Debian:
# aptitude install samba
On CentOS:
# yum install samba

Adding Users to Samba

For versions earlier than 4.x, a local Unix account is required for adding users to Samba:
# adduser

Next, we need to add the user to Samba using the smbpasswd command with the '-a' option, which specifies that the username following should be added to the local smbpasswd file. We will be prompted to enter a password (which does not necessarily have to be the same as the password of the local Unix account):
# smbpassword -a

Finally, we will give access to user xmodulo to a directory within our system that will be used as a Samba share for him (and other users as well, if needed). This is done by opening the /etc/samba/smb.conf file with a text editor (such as Vim), navigating to the end of the file, and creating a section (enclose name between square brackets) with a descriptive name, such as [xmodulo]:
1
2
3
4
5
6
7
8
9
# SAMBA SHARE
[xmodulo]
path = /home/xmodulo
available = yes
valid users= xmodulo
readonly = no
browseable = yes
public = yes
writeable = yes
We must now restart Samba and -just in case- check the smb.conf file for syntax errors with the testparm command:
# service samba restart
# testparm

If there are any errors, they will be reported when testparm ends.

Mapping the Samba Share as a Network Drive on a Windows 7 PC

Right click on Computer, and select "Map network drive":

Type the IP address of the machine where Samba is installed, followed by the name of the share (this is the name that is enclosed between single brackets in the smb.conf file), and make sure that the "Connect using different credentials" checkbox is checked:

Enter the username and password that were set with 'smbpasswd -a' earlier:

Go to Computer and check if the network drive has been added correctly:

As a test, let's create a pdf file from the man page of Samba, and save it in the /home/xmodulo directory:

Next, we can verify that the file is accessible from Windows:

And we can open it using our default pdf reader:

Finally, let's see if we can save a file from Windows in our newly mapped network drive. We will open the change.log file that lists the features of Notepad++:

and try to save it in Z:\ as a plain text file (.txt extension); then let's see if the file is visible in Linux:

Enabling quotas

As a first step, we need to verify whether the current kernel has been compiled with quota support:
# cat /boot/config-$(uname -r) | grep -i config_quota

Each file system has up to five types of quota limits that can be enforced on it: user soft limit, user hard limit, group soft limit, group hard limit, and grace time.
We will now enable quotas for the /home file system by adding the usrquota and grpquota mount options to the existing defaults option in the line that corresponds to the /home filesystem in the /etc/fstab file, and we will remount the file system in order to apply the changes:

Next, we need to create two files that will serve as the databases for user and group quotas: aquota.user and aquota.group, respectively, in /home. Then, we will generate the table of current disk usage per file system with quotas enabled:
# quotacheck -cug /home
# quotacheck -avugm

Even though we have enabled quotas for the /home file system, we have not yet set any limits for any user or group. Check for quota information for existing user/group:
# quota -u
# quota -g

Finally, the last couple of steps consist of assigning the quotas per user and / or group with the quotatool command (note that this task can also be performed by using edquota, but quotatool is more straightforward and less error-prone).
To set the soft limits to 4 MB and the hard limit to 5 MB for the user called xmodulo, and 10 MB / 15 MB for the xmodulo group:
# quotatool -u xmodulo -bq 4M -l '5 Mb' /home
# quotatool -g xmodulo -bq 10M -l '15 Mb' /home

And we can see the results in Windows 7 (3.98 MB free of 4.00 MB):

Linux Terminal: Reptyr attach a running process to a new terminal

$
0
0
ttp://linuxaria.com/pills/linux-terminal-reptyr-attach-a-running-process-to-a-new-terminal

If, like me, you work on terminals connected via ssh to remote computer/server you are probably used to tmux and screen and so it’s not a problem if you have to close your session, as you’ll be able to easily re-connect when you need it, but sometimes you could forget about using one of these utility.
Started a long-running process over ssh, but have to leave and don’t want to interrupt it?
Just start a screen, use reptyr to grab it, and then kill the ssh session and head on home.


Reptyr is a utility for taking an existing running program and attaching it to a new terminal, and is particularly useful for moving a long-running process into a GNU screen session.
reptyr does a more thorough job of transferring programs than many other tools, including the popular “screenify” shell script, because it changes the program’s controlling terminal. This means that actions such as window resizes and interrupts are sent to the process from the new terminal.

USAGE

The usage of reptyr it’s quiet easy, just discover the PID of the process you want to “move” to screen with a ps command and run the command:
reptyr PID
< "reptyr PID" will grab the process with id PID and attach it to your current terminal.
After attaching, the process will take input from and write output to the new terminal, including ^C and ^Z. (Unfortunately, if you background it, you will still have to run "bg" or "fg" in the old terminal. This is likely impossible to fix in a reasonable way without patching your shell.)
As a bonus feature, if you run reptyr -l, reptyr will create a new pseudo-terminal pair with nothing attached to the slave end, and print its name out.
If you are debugging a program in gdb, you can pass that name to “set inferior-pty”. Because there is no existing program listening to that tty, this will work much better than passing an existing shell’s terminal.


How to improve your productivity in terminal environment with Tmux

$
0
0
http://xmodulo.com/2014/08/improve-productivity-terminal-environment-tmux.html

The introduction of the mouse was a wonderful innovation in making computers more accessible to average people. But for programmers and sysadmins, moving our hands off the keyboard while working on a computer can be distracting.
As a sysadmin, I spend most of the time working in the terminal environment. Opening tabs and moving around windows through multiple terminals slows me down, and I just can't waste any second when something is going really wrong with my server.

Tmux is one of those tools that are essential for my daily work. With Tmux, I can create complex development environments, and have SSH connections side by side. I can create multiple windows, split panes, attach and detach sessions, etc. After mastering Tmux, you will throw out your mouse away ( just kidding don't do it :D ).
Tmux (short for "Terminal Multiplexer") lets us launch multiple terminals in a flexible layout on a single screen, so that we can work with them side by side. For example, on one pane we can edit some config files with Vim, while on the other we are using irssi to chat and on other pane, tailing some logs. Then open another window to update your system, and another to SSH to some servers. Navigating through them is just as easy as creating all these windows and panes. It is perfectly configurable and customizable so it can become an extension of your mind.

Install Tmux on Linux/OSX

You can install Tmux by compiling it from sources or via your operating system package manager. I recommend you to use a package manager. It's faster and easier than compiling.
OSX:
# sudo brew install tmux
# sudo port install tmux
Debian/Ubuntu:
$ sudo apt-get install tmux
RHEL/CentOS/Fedora (RHEL/CentOS require EPEL repo):
$ sudo yum install tmux
Archlinux:
$ sudo pacman -S tmux

Working with Different Sessions

The best way to use Tmux is working with sessions, so that you can organize your tasks and applications into different sessions the way you want. If you need to change a session, whatever runs inside the session won't stop or get killed. Let's see how it works.
Let's start a new session named "session", and run top command in it.
$ tmux new -s new session
$ top
then type CTRL-b d to detach from this session. To re-attach to it:
$ tmux attach-session -t session
And you will see top still running in the re-attached session.
Some commands to manage sessions:
$ tmux list-session
$ tmux new-session
$ tmux attach-session -t
$ tmux rename-session -t
$ tmux choose-session -t
$ tmux kill-session -t

Working with Different Windows

Often you will need to run multiple commands and perform different tasks in a session. We can organize all of them on multiple windows in one session. A window can be seen as a tab on modern GUI terminal (such iTerm, or Konsole). After configuring our default environment in a session, we will be able to create as many windows as we would need within the same session. Windows, like our apps running in sessions, persist when we detach from the current session. Let's check out an example:
$ tmux new -s my_session

Press CTRL-b c
This will create a new window and move focus into it. Now you can start up another application in the new window. You can write down the name of your current window. In this case I was running top so that's the window's name.
To rename it just type:
CTRL-b ,
The status bar changes to let you rename the current window.

Once we create multiple windows in a session, we need a way to move through them. Windows are organized as an array, so every window has a number starting at 0. To jump quickly to other windows:
CTRL-b
If we have named our windows, we can look for them with:
CTRL-b f
and to list all windows:
CTRL-b w
and to move to a different window one by one:
CTRL-b n (go to the next window)
CTRL-b p (go to the previous window)
To leave a window, just type exit or:
CTRL-b &
You have to confirm if you want to kill off the window.

Splitting a Window into Panes

Sometimes you need to type in your editor and check a log at the same time, and having your editor and tail side by side is really useful. With Tmux, we can divide a window into multiple panes. So for example, we can create a dashboard to monitor our servers and a complex development environment with the editor, the compiler and debugger running together side by side.
Let's create another Tmux session to work with panes. First let's detach from any Tmux session in case we are in a running session.
CTRL-b d
Start a new session named "panes".
$ tmux new -s panes
You can split a window horizontally or vertically. Let's start horizontally by pressing:
CTRL-b "
Now you have two new panes. Now vertically by pressing:
CTRL-b %
and now two more:

To move through them:
CTRL-b

Conclusion

I hope this tutorial has been helpful to you. As a bonus, tools such as Tmuxinator or Tmuxifier can streamline the process of creating and loading Tmux sessions, windows and panes, so that you can configure Tmux easily. Check them out if you haven't.

Which Linux Desktop Environment Should You Use?

$
0
0
http://www.everydaylinuxuser.com/2014/08/which-linux-desktop-environment-should.html

Introduction

The question that I get asked the most is "Which Linux Distro Should I Use?".

I released an article similar last year called "I need a Linux distro that is more customisable than Ubuntu". In that article I listed some potential candidates based on the criteria provided.

I am working on a series of articles that lets you choose your distribution based on your needs and your computer's capabilities.
 One part of your decision making process is choosing the desktop environment that is right for you.

You can use any of the core distributions such as Debian, Fedora, openSUSE and Arch and pretty much every desktop environment is available.
 
Other Linux distributions take the default desktop environment and customise the settings to provide a richer experience. Examples include Bodhi, Xubuntu and Linux Mint.

This is a guide to the various desktop environments available and the distributions that utilise them.

Modern Heavyweight Desktop Environments

The following desktop environments are a break away from the traditional panel/menu driven desktops that many people are used to.

These desktop environments may not run so well on older hardware and will not be a good choice if you have insufficient RAM, CPU or an older/incompatible graphics card.

Unity


Unity is the flagship desktop environment for the Ubuntu Linux distribution.

Unity takes a little bit of time to get used to and isn't overly customisable but is incredibly intuitive when it comes to navigating the desktop and finding applications.

The Unity desktop has a quick launch bar at the side and hosts your favourite applications. When you press the super (Windows) key on your keyboard a dashboard appears with access to various views including applications, music, videos, photos and social media.

It is easy to embed popular online applications such as Twitter, GMail and Reddit.

If your machine is underpowered then it might not be able to run Unity or may be sluggish. It is worth giving Ubuntu a go in a live environment or in a virtual environment to see how well it performs for you.

Unity isn't to everybody's taste and so try before you buy (even though it is free) is definitely the best course of action, especially if you prefer the more traditional desktop.

Gnome


The Gnome desktop is very similar to the Unity desktop in that it uses a launcher style approach with a dashboard showing all the applications in an iconised fashion.

Again I would say it is worth trying out Gnome in a virtual machine to see if it is to your taste and in a live environment to make sure it works properly with your hardware.

Distributions that use Gnome include (but are not limited to):
  • Ubuntu Gnome
  • Mageia
  • Debian
  • Fedora
  • openSUSE
  • Arch
  • CentOS
  • Manjaro
  • Kali
  • Makulu
  • Knoppix
  • Korora
It is worth noting that whilst some distributions are listed as using Gnome, it may not be the default desktop and may only be available from the repositories post installation.

Traditional Heavyweight Desktop Environments

What do I mean by "Traditional Heavyweight Desktop Environment".

For me a traditional desktop environment includes a panel at the bottom, icons on the desktop and a traditional menu system whereby you scroll through categories to get to applications.

Heavy versus light? Well a heavyweight desktop environment requires more resources to run.

Cinnamon


Cinnamon is the flagship desktop environment for the Linux Mint distribution. Linux Mint actually works with a number of lighter environments as well so if Cinnamon doesn't work for you due to hardware restrictions then that doesn't discount Linux Mint completely as there are alternative desktop choices available.

If you like things to evolve naturally then the Cinnamon desktop is definitely worth considering. It includes all the bells and whistles which will make your computer look good but it is also well designed making it easy to navigate and requires the smallest of learning curves.

Definitely a traditional desktop as it contains a single panel, a menu and icons on the desktop.

Again it is worth noting that whilst some distributions are listed as using Cinnamon, it may not be the default desktop and may only be available from the repositories post installation.

Linux distributions that use Cinnamon include (but are not limited to):
  • Mint
  • Cinnarch
  • Makulu
  • Mageia
  • Fedora
  • Arch

KDE

The KDE desktop has been around for quite some time and has had a number of major updates.

On the surface it is very much a traditional desktop with a panel, menu and icons but there is much more to the KDE desktop with multiple activity style workspaces.

The KDE desktop also comes with more default applications than any of the other environments.

Linux distributions that use the KDE desktop environment include:

  • Mint
  • Debian
  • Mageia
  • Fedora
  • openSUSE
  • Kubuntu
  • PCLinuxOS
  • Netrunner
  • Arch
  • Korora
  • Makulu
  • SolyDK
  • Knoppix
  • SLAX

Zorin Desktop


The Zorin desktop is a heavily customised Gnome desktop. It is only used by the Zorin OS Linux distribution.

The Zorin desktop by default is made to look like Windows 7 but there is a look changer which lets you choose a Windows XP or Gnome 2 desktop.

There are huge differences between Gnome 2 and Gnome 3 and this brings us onto the lighter desktop environments.

The Zorin desktop is integrated with Compiz to prove whizzy effects.

Traditional lightweight desktop environments

Lightweight desktop environments will require less resources and will therefore work on most hardware.

Again traditional is used in terms of panels, menus and icons.

MATE

When Gnome 2 became Gnome 3 a new desktop environment called MATE was formed which basically forked the Gnome 2 code.

The MATE desktop is much slicker than Gnome 3 on older hardware.

MATE is extremely customisable and allows for multiple panels with alternative widgets and menus.

Linux distributions that use MATE include:
  • Linux Mint
  • PCLinuxOS
  • Makulu
  • Mageia
  • Fedora
  • Arch

XFCE

When it comes to customising a desktop you won't find a desktop environment quite like XFCE.

Linux experts and beginners swear by XFCE because you can tweak it and get it to behave how you want it to very quickly and there isn't a huge learning curve.

Multiple panels, applets, menus, docks and special effects make XFCE my own personal favourite desktop environment.

The fact that XFCE doesn't take up a huge amount of resources makes it just perfect.

Linux distributions that use XFCE include:

  • Xubuntu
  • Linux Mint
  • Debian
  • Mageia
  • Fedora
  • openSUSE
  • Arch
  • SolyDX

LXDE

If you are really tight on resources then LXDE is a viable alternative to XFCE.

LXDE is highly customisable but with a more basic look. As with XFCE you can use different menus, add multiple panels and use different widgets but it isn't quite the same and doesn't quite have the same appeal.

LXDE does work on pretty much anything hardware wise. If your computer doesn't run LXDE then you really will be pushed to find a Linux distribution that works for you (but they do exist).

Linux distributions that use LXDE:
  • Lubuntu
  • LXLE
  • Debian
  • Mageia
  • Fedora
  • Zorin OS Lite
  • PCLinuxOS
  • SparkyLinux
  • Simplicity

Enlightenment

Enlightenment is one of the lesser utilised desktop environments and is probably highlighted best in the Bodhi Linux distribution.

The Enlightenment desktop is potentially highly customisable and provides the ability to use a large number of virtual workspaces.

Linux distributions that use Enlightenment:
  • Bodhi Linux
  • SparkyLinux
  • Fedora
  • Arch
  • MacPUP

Fluxbox, JWM, IceWM, RazorQT

For completeness I have added the above desktops and window managers.

If you are looking for ultra lightweight then these are the graphical environments to go for. Note though that they are much harder to customise.

If you use any of these GUIs on a modern machine then you will soon realise that the speed is insane but realistically you only want to use them to keep older hardware alive.


The Linux distributions that use these desktops include:
  • Various versions of Puppy Linux
  • AntiX
  • Damn Small Linux
  • Tinycore

Summary

There are other Window Managers out there and you can try 76 of them out by downloading and trying out LinuxBBQ (although it takes patience).

If you just use your computer for browsing the web, watching videos and listening to music and you have a modern computer then why not try out Unity or Gnome.

If you are keen to stay traditional and have a modern computer try KDE or Cinnamon.

If you have a mid range computer then there is MATE and XFCE and these are worth trying out even on modern hardware because they will keep things nice and slick.

On older hardware try out LXDE first but if that fails try out one of the ultra light distributions that use ICEWM or Fluxbox.

The final option of course is no desktop at all. If you are using your computer as a server then you may not need a desktop environment in which case Ubuntu minimal and Debian minimal are worth looking into.

Thankyou for reading.

How to install Puppet server and client on CentOS and RHEL

$
0
0
http://xmodulo.com/2014/08/install-puppet-server-client-centos-rhel.html

As a system administrator acquires more and more systems to manage, automation of mundane tasks gets quite important. Many administrators adopted the way of writing custom scripts, that are simulating complex orchestration software. Unfortunately, scripts get obsolete, people who developed them leave, and without an enormous level of maintenance, after some time these scripts will end up unusable. It is certainly more desirable to share a system that everyone can use, and invest in tools that can be used regardless of one's employer. For that we have several systems available, and in this howto you will learn how to use one of them - Puppet.

What is Puppet?

Puppet is an automation software for IT system administrators and consultants. It allows you to automate repetitive tasks such as the installation of applications and services, patch management, and deployments. Configuration for all resources are stored in so called "manifests", that can be applied to multiple machines or just a single server. If you would like to know more information, The Puppet Labs site has a more complete description of what Puppet is and how it works.

What are we going to achieve in this tutorial?

We will install and configure a Puppet server, and set up some basic configuration for our client servers. You will discover how to write and manage Puppet manifests and how to push it into your servers.

Prerequisites

Since Puppet is not in basic CentOS or RHEL distribution repositories, we have to add a custom repository provided by Puppet Labs. On all servers in which you want to use Puppet, install the repository by executing following command (RPM file name can change with new release):
On CentOS/RHEL 6.5:
# rpm -ivh https://yum.puppetlabs.com/el/6.5/products/x86_64/puppetlabs-release-6-10.noarch.rpm
On CentOS/RHEL 7:
# rpm -ivh https://yum.puppetlabs.com/el/7/products/x86_64/puppetlabs-release-7-10.noarch.rpm

Server Installation

Install the package "puppet-server" on the server you want to use as a master.
# yum install puppet-server
When the installation is done, set the Puppet server to automatically start on boot and turn it on.
# chkconfig puppetmaster on
# service puppetmaster start
Now when we have the server working, we need to make sure that it is reachable from our network.
On CentOS/RHEL 6, where iptables is used as firewall, add following line into section ":OUTPUT ACCEPT" of /etc/sysconfig/iptables.
1
-A INPUT -m state --state NEW -m tcp -p tcp --dport 8140 -j ACCEPT
To apply this change, it's necessary to restart iptables.
# service iptables restart
On CentOS/RHEL 7, where firewalld is used, the same thing can be achieved by:
# firewall-cmd --permanent --zone=public --add-port=8140/tcp
# firewall-cmd --reload

Client Installation

Install the Puppet client package on your client nodes by executing the following:
# yum install puppet
When the installation finishes, make sure that Puppet will start after boot.
# chkconfig puppet on
Your Puppet client nodes have to know where the Puppet master server is located. The best practice for this is to use a DNS server, where you can configure the Puppet domain name. If you don't have a DNS server running, you can use the /etc/hosts file, by simply adding the following line:
1.2.3.4 server.your.domain
2.3.4.5 client-node.your.domain
1.2.3.4 corresponds to the IP address of your Puppet master server, "server.your.domain" is the domain name of your master server (the default is usually the server's hostname), "client-node.your.domain" is your client node. This hosts file should be configured accordingly on all involved servers (both Puppet master and clients).
When you are done with these settings, we need to show the Puppet client what is its master. By default Puppet looks for a server called "puppet", but this setting is usually inappropriate for your network configuration, therefore we will exchange it for the proper FQDN of the Puppet master server. Open the file /etc/sysconfig/puppet and change the "PUPPET_SERVER" value to your Puppet master server domain name specified in /etc/hosts:
PUPPET_SERVER=server.your.domain
The master server name also has to be defined in the section "[agent]" of /etc/puppet/puppet.conf:
server=server.your.domain
Now you can start your Puppet client:
# service puppet start
We need to force our client to check in with the Puppet master by using:
# puppet agent --test
You should see something like the following output. Don't panic, this is desired as the server is still not verified on the Puppet master server.
Exiting; no certificate found and waitforcert is disabled
Go back to your puppet master server and check certificate verification requests:
# puppet cert list
You should see a list of all the servers that requested a certificate signing from your puppet master. Find the hostname of your client server and sign it using the following command (client-node is the domain name of your client node):
# puppet cert sign client-node
At this point you have a working Puppet client and server. Congratulations! However, right now there is nothing for the Puppet master to instruct the client to do. So, let's create some basic manifest and set our client node to install basic utilities.
Connect back to your Puppet server and make sure the directory /etc/puppet/manifests exists.
# mkdir -p /etc/puppet/manifests
Now create the manifest file /etc/puppet/manifests/site.pp with the following content
1
2
3
4
5
6
7
8
9
10
node 'client-node'{
        include custom_utils
}
 
class custom_utils {
        package { ["nmap","telnet","vim-enhanced","traceroute"]:
                ensure => latest,
                allow_virtual => false,
        }
}
and restart the puppetmaster service.
# service puppetmaster restart
The default refresh interval of the client configuration is 30 minutes, if you want to force the application of your changes manually, execute the following command on your client node:
# puppet agent -t
If you would like to change the default client refresh interval, add:
runinterval = 
to the "[agent]" section of /etc/puppet/puppet.conf on your client node. This setting can be a time interval in seconds (30 or 30s), minutes (30m), hours (6h), days (2d), or years (5y). Note that a runinterval of 0 means "run continuously" rather than "never run".

Tips & Tricks

1. Debugging

It can happen from time to time that you will submit a wrong configuration and you have to debug where the Puppet failed. For that you will always start with either checking logs in /var/log/puppet/ or running the agent manually to see the output:
# puppet agent -t
By default "-t" activates verbose mode, so it allows you to see the output of Puppet. This command also has several parameters that might help you identify your problem a bit more. The first useful option is:
# puppet agent -t --debug
Debug shows you basically all steps that Puppet goes through during its runtime. It can be really useful during debug of really complicated rules. Another parameter you might find really useful is:
# puppet agent -t --noop
This option sets puppet in so called dry-run mode, where no changes are performed. Puppet only writes what it would do on the screen but nothing is written on the disk.

2. Modules

After some time you find yourself in the situation where you will want to have more complicated manifests. But before you will sit down and start to program them, you should invest some time and browse https://forge.puppetlabs.com. Forge is a repository of the Puppet community modules and it's very likely that you find the solution for your problem already made there. If not, feel free to write your own and submit it, so other people can benefit from the Puppet modularity.
Now, let's assume that you have already found a module that would fix your problem. How to install it into the system? It is actually quite easy, because Puppet already contains an interface to download modules directly. Simply type the following command:
# puppet module install --version 0.0.0
is the name of your chosen module, the version is optional (if not specified then the latest release is taken). If you don't remember the name of the module you want to install, you can try to find it by using module search:
# puppet module search
As a result you will get a list of all modules that contain your search string.
# puppet module search apache
Notice: Searching https://forgeapi.puppetlabs.com ...
NAME DESCRIPTION AUTHOR KEYWORDS
example42-apache Puppet module for apache @example42 example42, apache
puppetlabs-apache Puppet module for Apache @puppetlabs apache web httpd centos rhel ssl wsgi proxy
theforeman-apache Apache HTTP server configuration @theforeman foreman apache httpd DEPRECATED
And if you would like to see what modules you already installed, type:
# puppet module list

Summary

By now, you should have a fully functional Puppet master that is delivering basic configuration to one or more client servers. At this point feel free to add more settings into your configuration to adapt it to your infrastructure. Don't worry about experimenting with Puppet and you will see that it can be a genuine lifesaver.
Puppet labs is trying to maintain a top quality documentation for their projects, so if you would like to learn more about Puppet and its configuration, I strongly recommend visiting the Puppet project page at http://docs.puppetlabs.com.
If you have any questions feel free to post them in the comments and I will do my best to answer and advise.
Viewing all 1407 articles
Browse latest View live


<script src="https://jsc.adskeeper.com/r/s/rssing.com.1596347.js" async> </script>