Quantcast
Channel: Sameh Attia
Viewing all 1407 articles
Browse latest View live

DevAssistant: A developer’s best friend

$
0
0
http://www.linuxbsdos.com/2014/09/24/devassistant-a-developers-best-friend

One application I came across while testing an installation of the main edition Fedora 21 alpha is DevAssistant. (See Fedora 21 Workstation: GNOME 3. KDE and Anaconda screenshots.)
DevAssistant automates the process of setting up development environments for a few of the most popular programming languages and development frameworks. Languages supported are shown in the screenshot below.
Fedora 21 GNOME 3 devassistant
Just after a few hours messing with it, I can tell you that DevAssistant looks like a must-have app, though its website, devassistant.org, is down. One more screenshot showing a few of the features supported by DevAssistant. Yep, it will create a Docker file and Docker image for your Python project.
Fedora 21 GNOME devassistant
For each programming language, you can see the framework(s) supported by clicking on the language’s button. For Python, Django, Flask and Python GTK+ 3 are supported. For Ruby, Rails (Ruby on Rails) is supported.
DevAssistant Python Django Flask
For any project, DevAssistant will install any dependencies the project needs to run.
DevAssistant Ruby Rails
For a Python project, for example, DevAssistant can create a Docker file and Docker image, set it up in a virtual environment, create a Git repository for it (local and remote at GitHub using your GitHub account) and push the code to the newly created GitHub account.
DevAssistant Python Django
Here’s the corresponding page for setting up a Rials project.
DevAssistant Ruby Rails
This screenshot shows all the dependencies that DevAssistant needed to install for a test Django project.
DevAssistant install dependencies
DevAssistant requesting my GitHub password.
DevAssistant GitHub
DevAssistant is supposed to push the project’s source code to the specified GitHub account, however, for the first two test projects I set up, I found that the files were not reaching the GitHub repo, even though the repo was created.
DevAssistant GitHub repo
An examination of the setup messages showed that an attempt to push the files to GitHub were failing with this message: Problem pushing source code: ssh_askpass: exec (/usr/libexec/openssh/ssh-askpass): No such file or directory. Host key verification failed. After a little bit of snooping, I found the solution: Install openssh-askpass using this command: yum install openssh-askpass.
DevAssistant GitHub remote repo
After installing openssh-askpass, DevAssistant prompted me to verify the SSH key for the next project I created. It’s just the same thing that happens when you attempt to ssh to a new SSH server whose key is not in the known_hosts file.
DevAssistant ssh-askpass openssh-askpass
A line in this image shows that the source code for the project was successfully pushed to my GitHub account.
DevAssistant ssh-askpass
This one shows the GitHub repo for the test project. DevAssistant is truly a developers best friend. Give it a test drive.
DevAssistant push GitHub remote
Please share this article

Secure Your Linux Desktop and SSH Login Using Two Factor Google Authenticator

$
0
0
http://www.cyberciti.biz/open-source/howto-protect-linux-ssh-login-with-google-authenticator

Two factor authentication is increasingly becoming a strongly recommended way of protecting user accounts in web applications from attackers by requiring a second method of authentication in addition to the standard username and password pair.

Although two factor authentication can encompass a wide range of techniques like biometrics or smart cards, the most commonly deployed technique in web applications is the one time password. If you have used applications like Gmail, you are probably familiar with the one time password generated by the Google Authenticator app that's available on iOS or Android devices.

The algorithm used for the one time password in the Google Authenticator app is known as the Time-based One-Time Password (TOTP) algorithm. The TOTP algorithm is a standard algorithm approved by the IETF in (RFC 6238) totp-rfc.

Prerequisites

You need to download Google Authenticator app that generates 2-step verification codes on your phone or desktop. Install Google Authenticator before you install anything else on your Android device/iPhone/iPad/BlackBerry/Firefox devices.

Install Google Authenticator on a Fedora Linux

It is a little known fact that you can use the TOTP algorithm to secure your user accounts in Linux systems. This article will walk you through the steps necessary. While the exact commands will be for Fedora 20, the TOTP algorithm can be deployed to any Linux distro with a little modification.
TOTP can be configured on Linux systems with a simple PAM that Google released. Installing it on Fedora is simple. Simply run the following yum command:
 
yum install google-authenticator
 
## OR ##
 
sudo yum install google-authenticator
 

Configure Google Authenticator on a Fedora Linux

Next, run the following command with the user you want to enable two factor authenticator for:
 
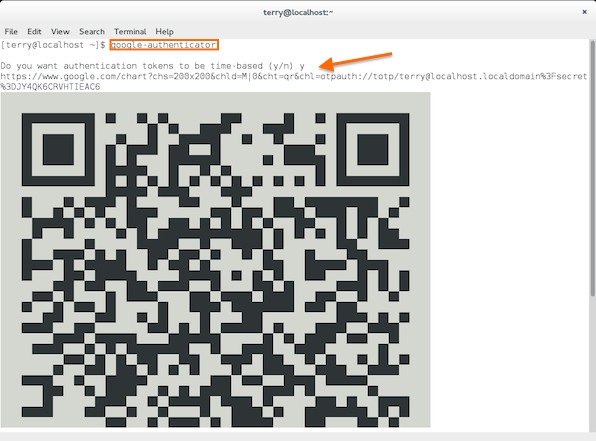
google-authenticator
 
You will be prompted for some configurations. Scan the QRcode that appears with the Google Authenticator app:
Fig.01: Google Authenticator app qr code for Linux

Save the backup codes listed somewhere safe. They will allow you to regain access if you lose your phone with the Authenticator app:
Fig.02: Google Authenticator Backup codes for Linux

Unless you have a good reason to, the defaults presented are sane. Just enter "y" for them:
Fig.03: Google Authenticator Linux options

Finally, add the following line to /etc/pam.d/gdm-password file:
 
auth required pam_google_authenticator.so
 
Save and close the file. On your next login, you should see a prompt for a verification code:
Fig.04: Google Authenticator code to protect Linux desktop login

Enter the one time password generated by the Google Authenticator app and you will be logged in:
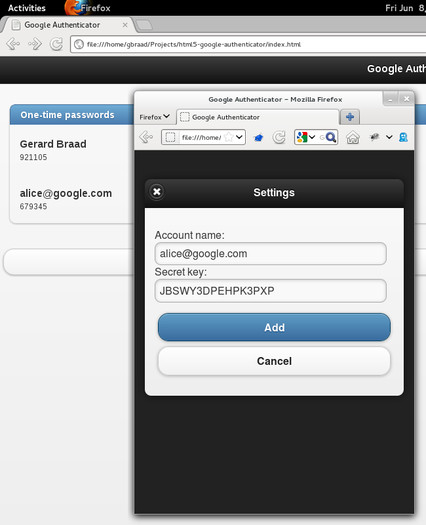
Fig.05: Firefox based Google Authenticator App in action

How can I get Google Authenticator tokens?

You can download app from the following location as per your device/browser to retrieve Google Authenticator tokens:
  1. Google Authenticator Apple iOS app - Works with 2-Step Verification for your Google Account to provide an additional layer of security when signing in.
  2. Google Authenticator android app - Generates 2-step verification codes on your phone.
  3. Google Authenticator Firefox app - Generates TOTP tokens when multi-factor authentication using Firefox.
  4. See the list of all Google Authenticator apps

Secure your OpenSSH server using two-step authentication on a Fedora / RHEL / CentOS Linux

This can be applied to SSH logins as well. Although disabling password logins for SSH and limiting it to SSH keys only is a good idea, this might not be possible in some environments. In such cases, adding two factor authentication can be a good compromise. Adding TOTP to SSH is easy as well.
Assuming you have already went through the above configurations, only two other steps is required.
First, add the following line to /etc/pam.d/sshd:
 
auth required pam_google_authenticator.so
 
Next, ensure that the /etc/ssh/sshd_config has the following line:
 
ChallengeResponseAuthentication yes
 
Save and close the file. Restart the sshd service:
 
sudo service sshd restart
## OR ##
sudo systemctl restart sshd.service
 
On your next SSH login, you should be promoted for a verification code in addition to the usual password:
login as: nixcraft
Verification code:
Password:

Linux/UNIX wget command with practical examples

$
0
0
http://www.linuxtechi.com/wget-command-practical-examples

wget is a Linux/UNIX command line file downloader.Wget is a free utility for non-interactive download of files from the Web. It supports HTTP, HTTPS, and FTP protocols, as well as retrieval through HTTP proxies.Wget is non-interactive, meaning that it can work in the background, while the user is not logged on.
In this post we will discuss different examples of wget command.

Example:1 Download Single File

# wget http://mirror.nbrc.ac.in/centos/7.0.1406/isos/x86_64/CentOS-7.0-1406-x86_64-DVD.iso
This command will download the CentOS 7 ISO file in the user’s current working directtory.

Example:2 Resume Partial Downloaded File

There are some scenarios where we start downloading a large file but in the middle Internet got disconnected , so using the option ‘-c’ in wget command we can resume our download from where it got disconnected.
# wget -c http://mirror.nbrc.ac.in/centos/7.0.1406/isos/x86_64/CentOS-7.0-1406-x86_64-DVD.iso
wget-resume-download

Example:3 Download Files in the background

We can download the file in the background using the option ‘-b’ in wget command.
linuxtechi@localhost:~$ wget -b http://mirror.nbrc.ac.in/centos/7.0.1406/isos/x86_64/
CentOS-7.0-1406-x86_64-DVD.iso
Continuing in background, pid 4505.
Output will be written to ‘wget-log’.
As we can see above that downloading progress is capture in ‘wget-log’ file in user’s current directory.
linuxtechi@localhost:~$ tail -f wget-log
2300K ………. ………. ………. ………. ………. 0% 48.1K 18h5m
2350K ………. ………. ………. ………. ………. 0% 53.7K 18h9m
2400K ………. ………. ………. ………. ………. 0% 52.1K 18h13m
2450K ………. ………. ………. ………. ………. 0% 58.3K 18h14m
2500K ………. ………. ………. ………. ………. 0% 63.6K 18h14m
2550K ………. ………. ………. ………. ………. 0% 63.4K 18h13m
2600K ………. ………. ………. ………. ………. 0% 72.8K 18h10m
2650K ………. ………. ………. ………. ………. 0% 59.8K 18h11m
2700K ………. ………. ………. ………. ………. 0% 52.8K 18h14m
2750K ………. ………. ………. ………. ………. 0% 58.4K 18h15m
2800K ………. ………. ………. ………. ………. 0% 58.2K 18h16m
2850K ………. ………. ………. ………. ………. 0% 52.2K 18h20m

Example:4 Limiting Download Speed .

By default wget command try to use full bandwidth , but there may be case that you are using shared internet , so if you try to download huge file using wget , this may slow down Internet of other users. This situation can be avoided if you limit the download speed using ‘–limit-rate‘ option.
#wget --limit-rate=100k http://mirror.nbrc.ac.in/centos/7.0.1406/isos/x86_64/CentOS-7.0-1406-x86_64-DVD.iso
In the above example,the download speed is limited to 100k.

Example:5 Download Multiple Files using ‘-i’ option

If you want to download multiple files using wget command , then first create a text file and add all URLs in the text file.
# cat download-list.txt
url1
url2
url3
url4

Now issue issue below Command :
# wget -i downlaod-list.txt

Example:6 Increase Retry Attempts.

We can increase the retry attempts using ‘–tries‘ option in wget. By default wget command retries 20 times to make the download successful.
This option becomes very useful when you have internet connection problem and you are downloading a large file , then there is a chance of failures in the download.
# wget --tries=75 http://mirror.nbrc.ac.in/centos/7.0.1406/isos/x86_64/CentOS-7.0-1406-x86_64-DVD.iso

Example:7 Redirect wget Logs to a log File using -o

We can redirect the wget command logs to a log file using ‘-o‘ option.
#wget -o download.log http://mirror.nbrc.ac.in/centos/7.0.1406/isos/x86_64/CentOS-7.0-1406-x86_64-DVD.iso
Download.log file will be created in the user’s current directory.

Example:8 Download Full website for local viewing.

# wget --mirror -p --convert-links -P ./ website-url
Whereas
  • –mirror : turn on options suitable for mirroring.
  • -p : download all files that are necessary to properly display a given HTML page.
  • –convert-links : after the download, convert the links in document for local viewing.
  • -P ./Local-Folder : save all the files and directories to the specified directory.

Example:9 Reject file types while downloading.

When you are planning to download full website , then we can force wget command not to download images using ‘–reject’ option .
# wget --reject=png Website-To-Be-Downloaded

Example:10 Setting Download Quota using wget -Q

We can force wget command to quit downloading when download size exceeds certain size using ‘-Q’ option
# wget -Q10m -i download-list.txt
Note that quota will never affect downloading a single file. So if you specify wget -Q10m ftp://wuarchive.wustl.edu/ls-lR.gz, all of the ls-lR.gz will be downloaded. The same goes even when several URLs are specified on the command-line. However, quota is respected when retrieving either recursively, or from an input file. Thus you may safely type ‘wget -Q10m -i download-list.txt’ download will be aborted when the quota is exceeded.

Example:11 Downloading file from password protected site.

# wget --ftp-user= --ftp-password= Download-URL
Another way to specify username and password is in the URL itself.
Either method reveals your password to anyone who bothers to run “ps”. To prevent the passwords from being seen, store them in .wgetrc or .netrc, and make sure to protect those files from other users with “chmod”. If the passwords are really important, do not leave them lying in those files either edit the files and delete them after Wget has started the download.

How to debug a C/C++ program with GDB command-line debugger

$
0
0
http://xmodulo.com/gdb-command-line-debugger.html

What is the worst part of coding without a debugger? Compiling on your knees praying that nothing will crash? Running the executable with a blood offering? Or just having to write printf("test") at every line hoping to find where the problem is coming from? As you probably know, there are not many advantages to coding without a debugger. But the good side is that debugging on Linux is easy. While most people use the debugger included in their favorite IDE, Linux is famous for its powerful command line C/C++ debugger: GDB. However, like most command line utilities, GDB requires a bit of training to master fully. In this tutorial, I will give you a quick rundown of GDB debugger.

Installation of GDB

GDB is available in most distributions' repositories.
For Debian or Ubuntu:
$ sudo apt-get install gdb
For Arch Linux:
$ sudo pacman -S gdb
For Fedora, CentOS or RHEL:
$ sudo yum install gdb
If you cannot find it anywhere else, it is always possible to download it from the official page.

Code Sample

When you are learning GDB, it is always better to have a piece of code to try things. Here is a quick sample that I coded to show the best features of GDB. Feel free to copy paste it to try the examples. That's the best way to learn.
1
2
3
4
5
6
7
8
9
10
11
12
13
14
15
16
17
#include
#include
 
intmain(intargc, char**argv)
{
    inti;
    inta=0, b=0, c=0;
    doubled;
    for(i=0; i<100 code="" i="">100>
    {
        a++;
        if(i>97)
            d = i / 2.0;
        b++;
    }
    return0;
}

Usage of GDB

First and foremost, you will need to compile your program with the flag "-g" (for debug) to run it via GDB. From there the syntax to start debugging is:
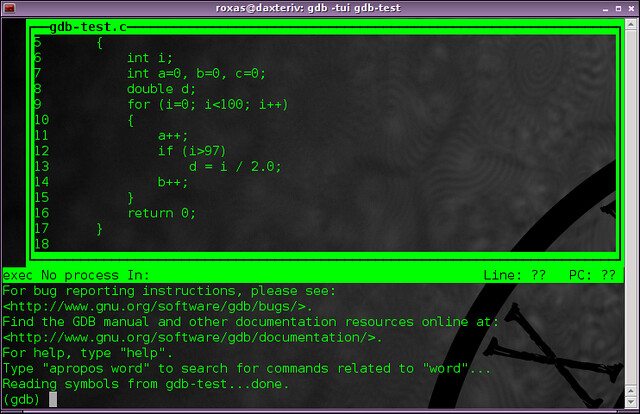
$ gdb -tui [executable's name]
The "-tui” option will show your code in a nice interactive terminal window (so-called "text user interface") that you can navigate in with the arrow keys, while typing in the GDB shell below.

We can now start playing around placing breakpoints anywhere in the source code with debugger. Here you have the options to set a breakpoint at a line number of the current source file:
break [line number]
or at a line number of a specific source file:
break [file name]:[line number]
or at a particular function:
break [function name]
And even better, you can set conditional breakpoints:
break [line number] if [condition]
For example, in our code sample, I can set:
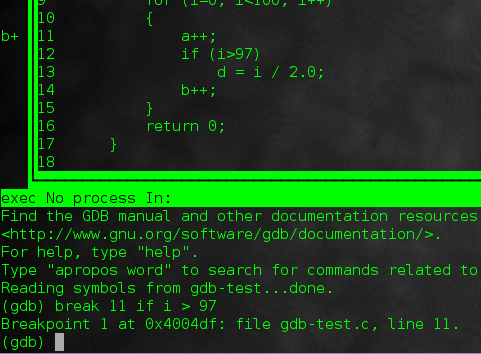
break 11 if i > 97

which will have an effect of stopping me at "a++;" after 97 iterations of the for loop. As you have guessed, this is very handy when you do not want to step through the loop 97 times on your own.
Last but not least, you can place a "watchpoint" which will pause the program if a variable is modified:
watch [variable]
Here, I can set one like:
watch d
which will stop the program as soon as variable d is set to a new value (i.e. when i > 97 is true).
Once our breakpoints are set, we can run the program with the "run" command, or simply:
r [command line arguments if your program takes some]
as most words can be abbreviated in just a letter with gdb.
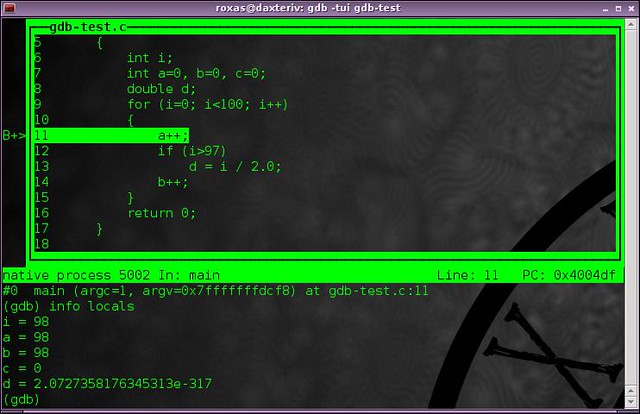
And without surprises, we are stopped at line 11. From there, we can do interesting things. The command:
bt
for backtrack will tell us how we got to that point.

info locals
will display all the local variables and their current values (as you can see I didn't set my d variable to anything so its value is currently garbage).

Of course:
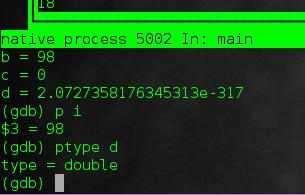
p [variable]
will show the value of a particular variable. But even better:
ptype [variable]
shows the type of a local variable. So here we can confirm that d is double type.

And since we are playing with fire, might as well do it all the way:
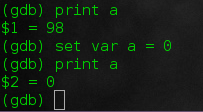
set var [variable] = [new value]
will override the value of the variable. Be careful though as you can't create a new variable or change its type. But here we can do:
set var a = 0

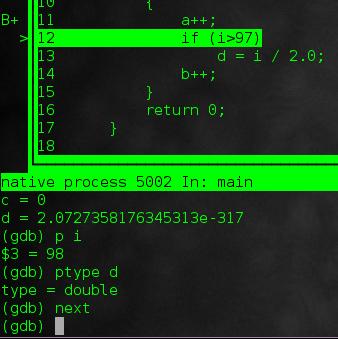
And just like any good debugger, we can "step" with:
step
to run the next line and potentially step into a function. Or just:
next
to just go straight to the line below, ignoring any function call.

And to finish testing, you can delete a breakpoint with:
delete [line number]
Keep running the program from the current breakpoint with:
continue
and exit GDB with:
quit
To conclude, with GDB, no more praying to compile, no more blood offerings to run, no more printf("test"). Of course this post is not exhaustive and GDB's capabilities run beyond this, so I really encourage you to learn more about it on your own (or in a future post maybe?). What I am the most interested now is to integrate GDB nicely in Vim. In the meantime, here is a very big memo of all the GDB commands for future reference.
What do you think of GDB? Would you consider its advantages over a graphical debugger or an IDE's? And what about integrating into Vim? Let us know in the comments.

How to configure HTTP load balancer with HAProxy on Linux

$
0
0
http://xmodulo.com/haproxy-http-load-balancer-linux.html

Increased demand on web based applications and services are putting more and more weight on the shoulders of IT administrators. When faced with unexpected traffic spikes, organic traffic growth, or internal challenges such as hardware failures and urgent maintenance, your web application must remain available, no matter what. Even modern devops and continuous delivery practices can threaten the reliability and consistent performance of your web service.
Unpredictability or inconsistent performance is not something you can afford. But how can we eliminate these downsides? In most cases a proper load balancing solution will do the job. And today I will show you how to set up HTTP load balancer using HAProxy.

What is HTTP load balancing?

HTTP load balancing is a networking solution responsible for distributing incoming HTTP or HTTPS traffic among servers hosting the same application content. By balancing application requests across multiple available servers, a load balancer prevents any application server from becoming a single point of failure, thus improving overall application availability and responsiveness. It also allows you to easily scale in/out an application deployment by adding or removing extra application servers with changing workloads.

Where and when to use load balancing?

As load balancers improve server utilization and maximize availability, you should use it whenever your servers start to be under high loads. Or if you are just planning your architecture for a bigger project, it's a good habit to plan usage of load balancer upfront. It will prove itself useful in the future when you need to scale your environment.

What is HAProxy?

HAProxy is a popular open-source load balancer and proxy for TCP/HTTP servers on GNU/Linux platforms. Designed in a single-threaded event-driven architecture, HAproxy is capable of handling 10G NIC line rate easily, and is being extensively used in many production environments. Its features include automatic health checks, customizable load balancing algorithms, HTTPS/SSL support, session rate limiting, etc.

What are we going to achieve in this tutorial?

In this tutorial, we will go through the process of configuring a HAProxy-based load balancer for HTTP web servers.

Prerequisites

You will need at least one, or preferably two web servers to verify functionality of your load balancer. We assume that backend HTTP web servers are already up and running.

Install HAProxy on Linux

For most distributions, we can install HAProxy using your distribution's package manager.

Install HAProxy on Debian

In Debian we need to add backports for Wheezy. To do that, please create a new file called "backports.list" in /etc/apt/sources.list.d, with the following content:
1
deb http://cdn.debian.net/debian wheezy­backports main
Refresh your repository data and install HAProxy.
# apt­ get update
# apt ­get install haproxy

Install HAProxy on Ubuntu

# apt ­get install haproxy

Install HAProxy on CentOS and RHEL

# yum install haproxy

Configure HAProxy

In this tutorial, we assume that there are two HTTP web servers up and running with IP addresses 192.168.100.2 and 192.168.100.3. We also assume that the load balancer will be configured at a server with IP address 192.168.100.4.
To make HAProxy functional, you need to change a number of items in /etc/haproxy/haproxy.cfg. These changes are described in this section. In case some configuration differs for different GNU/Linux distributions, it will be noted in the paragraph.

1. Configure Logging

One of the first things you should do is to set up proper logging for your HAProxy, which will be useful for future debugging. Log configuration can be found in the global section of /etc/haproxy/haproxy.cfg. The following are distro-specific instructions for configuring logging for HAProxy.
CentOS or RHEL:
To enable logging on CentOS/RHEL, replace:
1
log         127.0.0.1 local2
with:
1
log         127.0.0.1 local0
The next step is to set up separate log files for HAProxy in /var/log. For that, we need to modify our current rsyslog configuration. To make the configuration simple and clear, we will create a new file called haproxy.conf in /etc/rsyslog.d/ with the following content.
1
2
3
4
5
6
$ModLoad imudp
$UDPServerRun 514 
$template Haproxy,"%msg%\n"
local0.=info ­/var/log/haproxy.log;Haproxy
local0.notice ­/var/log/haproxy­status.log;Haproxy
local0.* ~
This configuration will separate all HAProxy messages based on the $template to log files in /var/log. Now restart rsyslog to apply the changes.
# service rsyslog restart
Debian or Ubuntu:
To enable logging for HAProxy on Debian or Ubuntu, replace:
1
2
log /dev/log        local0
log /dev/log        local1 notice
with:
1
log         127.0.0.1 local0
Next, to configure separate log files for HAProxy, edit a file called haproxy.conf (or 49-haproxy.conf in Debian) in /etc/rsyslog.d/ with the following content.
1
2
3
4
5
6
$ModLoad imudp
$UDPServerRun 514 
$template Haproxy,"%msg%\n"
local0.=info ­/var/log/haproxy.log;Haproxy
local0.notice ­/var/log/haproxy­status.log;Haproxy
local0.* ~
This configuration will separate all HAProxy messages based on the $template to log files in /var/log. Now restart rsyslog to apply the changes.
# service rsyslog restart

2. Setting Defaults

The next step is to set default variables for HAProxy. Find the defaults section in /etc/haproxy/haproxy.cfg, and replace it with the following configuration.
1
2
3
4
5
6
7
8
9
10
11
defaults
log     global
mode    http
option  httplog
option  dontlognull
retries 3
option redispatch
maxconn 20000
contimeout      5000
clitimeout      50000
srvtimeout      50000
The configuration stated above is recommended for HTTP load balancer use, but it may not be the optimal solution for your environment. In that case, feel free to explore HAProxy man pages to tweak it.

3. Webfarm Configuration

Webfarm configuration defines the pool of available HTTP servers. Most of the settings for our load balancer will be placed here. Now we will create some basic configuration, where our nodes will be defined. Replace all of the configuration from frontend section until the end of file with the following code:
1
2
3
4
5
6
7
8
9
10
11
12
listen webfarm *:80
       mode http
       stats enable
       stats uri /haproxy?stats
       stats realm Haproxy\ Statistics
       stats auth haproxy:stats
       balance roundrobin
       cookie LBN insert indirect nocache
       option httpclose
       option forwardfor
       server web01 192.168.100.2:80 cookie node1 check
       server web02 192.168.100.3:80 cookie node2 check
The line "listen webfarm *:80" defines on which interfaces our load balancer will listen. For the sake of the tutorial, I've set that to "*" which makes the load balancer listen on all our interfaces. In a real world scenario, this might be undesirable and should be replaced with an interface that is accessible from the internet.

Linux Terminal: An lsof Primer

$
0
0
http://linuxaria.com/howto/linux-terminal-an-lsof-primer


tux-terminal.jpg

lsof is the sysadmin/securityüber-tool. I use it most for getting network connection related information from a system, but that’s just the beginning for this powerful and too-little-known application. The tool is aptly called lsof because it “lists openfiles“. And remember, in UNIX just about everything (including a network socket) is a file.
Interestingly, lsof is also the Linux/Unix command with the most switches. It has so many it has to use both minuses andpluses.
usage: [-?abhlnNoOPRstUvV] [+|-c c] [+|-d s] [+D D] [+|-f[cgG]]
[-F [f]] [-g [s]] [-i [i]] [+|-L [l]] [+|-M] [-o [o]]
[-p s] [+|-r [t]] [-S [t]] [-T [t]] [-u s] [+|-w] [-x [fl]] [--] [names]
As you can see, lsof has a truly staggering number of options. You can use it to get information about devices on your system, what a given user is touching at any given point, or even what files or network connectivity a process is using.
For me, lsof replaces both netstat and ps entirely. It has everything I get from those tools and much, much more. So let’s look at some of its primary capabilities:


Key Options

It’s important to understand a few key things about how lsofworks. Most importantly, when you’re passing options to it, the default behavior is to OR the results. So if you are pulling a list of ports with -i and also a process list with -p you’re by default going to get both results.
Here are a few others like that to keep in mind:
  • default : without options, lsof lists all open files for active processes
  • grouping : it’s possible to group options, e.g. -abC, but you have to watch for which options take parameters
  • -a : AND the results (instead of OR)
  • -l : show the userID instead of the username in the output
  • -h : get help
  • -t : get process IDs only
  • -U : get the UNIX socket address
  • -F : the output is ready for another command, which can be formatted in various ways, e.g. -F pcfn (for process id, command name, file descriptor, and file name, with a null terminator)

Getting Information About the Network

As I said, one of my main usecases for lsof is getting information about how my system is interacting with the network. Here are some staples for getting this info:

Show all connections with -i

Some like to use netstat to get network connections, but I much prefer using lsof for this. The display shows things in a format that’s intuitive to me, and I like knowing that from there I can simply change my syntax and get more information using the same command.
# lsof -i
COMMAND  PID USER   FD   TYPE DEVICE SIZE NODE NAME
dhcpcd 6061 root 4u IPv4 4510 UDP *:bootpc
sshd 7703 root 3u IPv6 6499 TCP *:ssh (LISTEN)
sshd 7892 root 3u IPv6 6757 TCP 10.10.1.5:ssh->192.168.1.5:49901 (ESTABLISHED)

Get only IPv6 traffic with -i 6

# lsof -i 6

Show only TCP connections (works the same for UDP)

You can also show only TCP or UDP connections by providing the protocol right after the -i.
# lsof -iTCP
COMMAND  PID USER   FD   TYPE DEVICE SIZE NODE NAME
sshd 7703 root 3u IPv6 6499 TCP *:ssh (LISTEN)
sshd 7892 root 3u IPv6 6757 TCP 10.10.1.5:ssh->192.168.1.5:49901 (ESTABLISHED)

Show networking related to a given port using -i :port

Or you can search by port instead, which is great for figuring out what’s preventing another app from binding to a given port.
# lsof -i:22
COMMAND  PID USER   FD   TYPE DEVICE SIZE NODE NAME
sshd 7703 root 3u IPv6 6499 TCP *:ssh (LISTEN)
sshd 7892 root 3u IPv6 6757 TCP 10.10.1.5:ssh->192.168.1.5:49901 (ESTABLISHED)

Show connections to a specific host using @host

This is quite useful when you’re looking into whether you have open connections with a given host on the network or on the internet.
# lsof -i@172.16.12.5
sshd 7892 root 3u IPv6 6757 TCP 10.10.1.5:ssh->172.16.12.5:49901 (ESTABLISHED)

Show connections based on the host and the port using@host:port

You can also combine the display of host and port.
# lsof -i@172.16.12.5:22
sshd 7892 root 3u IPv6 6757 TCP 10.10.1.5:ssh->192.168.1.5:49901 (ESTABLISHED)

Find listening ports

Find ports that are awaiting connections.
# lsof -i -sTCP:LISTEN
You can also do this by grepping for “LISTEN” as well.
# lsof -i | grep -i LISTEN
iTunes     400 daniel   16u  IPv4 0x4575228  0t0 TCP *:daap (LISTEN)

Find established connections

You can also show any connections that are already pinned up.
# lsof -i -sTCP:ESTABLISHED
You can also do this just by searching for “ESTABLISHED” in the output via grep.
# lsof -i | grep -i ESTABLISHED
firefox-b 169 daniel  49u IPv4 0t0 TCP 1.2.3.3:1863->1.2.3.4:http (ESTABLISHED)

User Information

You can also get information on various users and what they’re doing on the system, including their activity on the network, their interactions with files, etc.

Show what a given user has open using -u

# lsof -u daniel
-- snipped --
Dock 155 daniel txt REG 14,2 2798436 823208 /usr/lib/libicucore.A.dylib
Dock 155 daniel txt REG 14,2 1580212 823126 /usr/lib/libobjc.A.dylib
Dock 155 daniel txt REG 14,2 2934184 823498 /usr/lib/libstdc++.6.0.4.dylib
Dock 155 daniel txt REG 14,2 132008 823505 /usr/lib/libgcc_s.1.dylib
Dock 155 daniel txt REG 14,2 212160 823214 /usr/lib/libauto.dylib
-- snipped --

Show what all users are doing except a certain user using-u ^user

# lsof -u ^daniel
-- snipped --
Dock 155 jim txt REG 14,2 2798436 823208 /usr/lib/libicucore.A.dylib
Dock 155 jim txt REG 14,2 1580212 823126 /usr/lib/libobjc.A.dylib
Dock 155 jim txt REG 14,2 2934184 823498 /usr/lib/libstdc++.6.0.4.dylib
Dock 155 jim txt REG 14,2 132008 823505 /usr/lib/libgcc_s.1.dylib
Dock 155 jim txt REG 14,2 212160 823214 /usr/lib/libauto.dylib
-- snipped --


Kill everything a given user is doing

It’s nice to be able to nuke everything being run by a given user.
# kill -9 `lsof -t -u daniel`

Commands and Processes

It’s often useful to be able to see what a given program or process is up to, and with lsof you can do this by name or by process ID. Here are a few options:

See what files and network connections a named command is using with -c

# lsof -c syslog-ng
COMMAND    PID USER   FD   TYPE     DEVICE    SIZE       NODE NAME
syslog-ng 7547 root cwd DIR 3,3 4096 2 /
syslog-ng 7547 root rtd DIR 3,3 4096 2 /
syslog-ng 7547 root txt REG 3,3 113524 1064970 /usr/sbin/syslog-ng
-- snipped --

See what a given process ID has open using -p

# lsof -p 10075
-- snipped --
sshd 10068 root mem REG 3,3 34808 850407 /lib/libnss_files-2.4.so
sshd 10068 root mem REG 3,3 34924 850409 /lib/libnss_nis-2.4.so
sshd 10068 root mem REG 3,3 26596 850405 /lib/libnss_compat-2.4.so
sshd 10068 root mem REG 3,3 200152 509940 /usr/lib/libssl.so.0.9.7
sshd 10068 root mem REG 3,3 46216 510014 /usr/lib/liblber-2.3
sshd 10068 root mem REG 3,3 59868 850413 /lib/libresolv-2.4.so
sshd 10068 root mem REG 3,3 1197180 850396 /lib/libc-2.4.so
sshd 10068 root mem REG 3,3 22168 850398 /lib/libcrypt-2.4.so
sshd 10068 root mem REG 3,3 72784 850404 /lib/libnsl-2.4.so
sshd 10068 root mem REG 3,3 70632 850417 /lib/libz.so.1.2.3
sshd 10068 root mem REG 3,3 9992 850416 /lib/libutil-2.4.so
-- snipped --

The -t option returns just a PID

# lsof -t -c Mail
350

Files and Directories

By looking at a given file or directory you can see what all on the system is interacting with it–including users, processes, etc.

Show everything interacting with a given directory

# lsof /var/log/messages/
COMMAND    PID USER   FD   TYPE DEVICE   SIZE   NODE NAME
syslog-ng 7547 root 4w REG 3,3 217309 834024 /var/log/messages

Show everything interacting with a given file

# lsof /home/daniel/firewall_whitelist.txt

Advanced Usage

Similar to tcpdump, the power really shows itself when you start combining queries.

Show me everything daniel is doing connected to 1.1.1.1

# lsof -u daniel -i @1.1.1.1
bkdr   1893 daniel 3u  IPv6 3456 TCP 10.10.1.10:1234->1.1.1.1:31337 (ESTABLISHED)

Using the -t and -c options together to HUP processes

# kill -HUP `lsof -t -c sshd`

lsof +L1 shows you all open files that have a link count less than 1

This is often (but not always) indicative of an attacker trying to hide file content by unlinking it.
# lsof +L1
(hopefully nothing)

Show open connections with a port range

# lsof -i @fw.google.com:2150=2180

Conclusion

This primer just scratches the surface of lsof‘s functionality. For a full reference, run man lsof or check out the online version. I hope this has been useful to you, and as always,comments and corrections are welcomed.

Resources

Take control of Android app permissions on a per-app basis with XPrivacy

$
0
0
http://www.androidtipsandhacks.com/root/control-android-app-permissions-xprivacy-xposed

Android app permission requests are getting out of control. More and more apps want access to your data, your location and other identifiable and highly valuable information. Fortunately, if you have rooted your phone or tablet, you can bring permissions under control.
In this tutorial we’ll show you:
  • Why you need to know about Android app permissions
  • How to install and set up XPrivacy
  • Three ways to block or control permissions

What are app permissions?

Whenever you install an Android app you’ll be shown a list of all the permissions it requires. A permission enables the app to access a part of your phone—it could be a specific hardware feature like the camera or GPS, or it could be your data such as your address book or social networking accounts.
Lots of permissions
In most cases this is fine. A web browser obviously needs permission to access the internet; an image editor needs read and write access to your internal storage so that it can open and save the images you’re working with; a weather apps needs to know your location.
Yet often it isn’t clear what permissions are for, and why a particular app needs them. And the problem is, there’s nothing you can do about it.
When you’re shown the list of permissions before you install an app you can even accept them all, or cancel the installation. You cannot reject permissions on a case by case basis.
Signs are that there will be some level of permissions control in Android L, but many existing devices won’t be updated to that version of the OS.

How to set up XPrivacy

The alternative, then, is to take the root option. With the app XPrivacy you can block specific permissions entirely, for only certain apps, or on case by case basis whenever an app tries to use them.
Best of all, it doesn’t break the functionality of apps, because in many cases instead of simply blocking or ignoring a permission request it returns either blank or fake data so that the app thinks the request has been granted.
Of course, if you block internet access or camera access, or other hardware features, then this may prevent an app from running if that function is essential to the app.
XPrivacy is an incredibly powerful app that enables you to take control of your phone, your data and your privacy.
To use XPrivacy you need:
Install XPrivacy Installer and launch the app. You’ll be prompted to check that your device is rooted—when the grant root privileges box opens tick the Grant box.
Grant xprivacy
Next, you’ll need to tick the box labelled I have made a full backup. It’s a good idea to make that backup before you proceed, by the way.
Ensure you’ve enabled Unknown sources, and tick that box.
Now you’ll see the Xposed check list. You should already have Xposed installed, so that will be checked already. Now tick I have enabled Xposed.
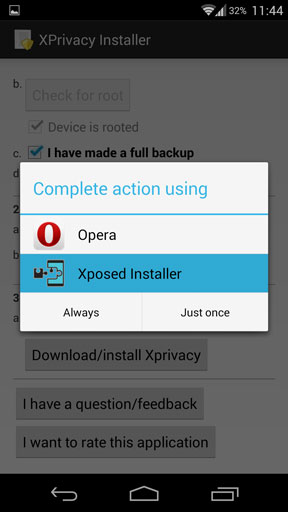
Finally, tap the Download/install Xprivacy button. Launch the Xposed Installer when prompted, swipe to Versions and tap Download. Complete the installation and reboot your phone.
Install xprivacy

Blocking permissions with XPrivacy

Launch XPrivacy from the app drawer. It will do a quick scan of your phone and list all of the apps installed. By default it will be filtered to show only the user-installed apps, and not the system ones. There’s no reason to change this, as restricting permissions for built-in apps can cause problems.
If an app’s name is listed in bold italic text that means the app has requested use of a permission.
For more information on an app tap its icon. You’ll see every Android permission listed—the ones with a green key icon are the permissions that this app wants to use; if they have a yellow warning icon next to them it shows the app has recently used this permission.

Block a specific permission

There are three main approaches to controlling permissions in XPrivacy. In all instances an app will need to be closed and restarted for the changes to take effect.
First is to block or control a single permission across all apps.
Tap the filter permissions drop down and pick a permission you want to control. For example, Contacts.
Xprivacy specific
You’ll now see all the apps installed that have permission to access your Contacts. If you want to prevent an app from having this permission tap the box to the right of it. Next time the app wants to access your address book it will be sent a empty list instead of your actual addresses.
Work through the key permissions you want to restrict, adding as many apps as you need.
Xprivacy contacts
This method is perfect if you simply want to prevent access to certain features or functions, such as your address book or location for privacy reasons, or to prevent certain apps from going online.

Block all permissions for an app

The next method for controlling permissions is to block them all for a specific app.
Select All from the permissions drop down again to view all your apps.
Alongside each app are two boxes. Tapping the left-most one will selectively block all permissions for that app. It does it selectively as some permissions are not safe to block, but the important ones will be controlled.
Xprivacy block
Tap the app’s icon for more information on what exactly has been blocked, and deselect any permissions you want to allow.
If you untick the block all permissions box a question mark will appear in the right-most box. This means you will be prompted each time the app tries to use a permission. Which leads us to the final method.
Xpriavcy question

Prompt for each permission request

By ticking the right-most box next to an app you will be prompted each time an app wants to use a permission.
This sounds like the best option, but in fact for a while you will be overloaded by prompt requests each time you launch an app.
By default your choice will be remembered so you’ll only be prompted once for each app.
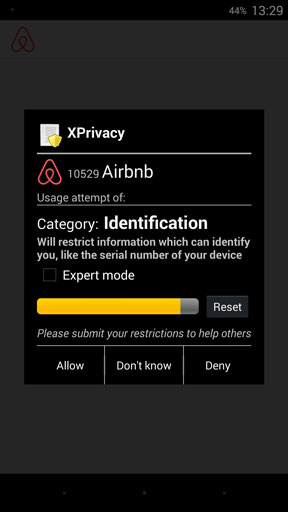
Xprivacy prompt
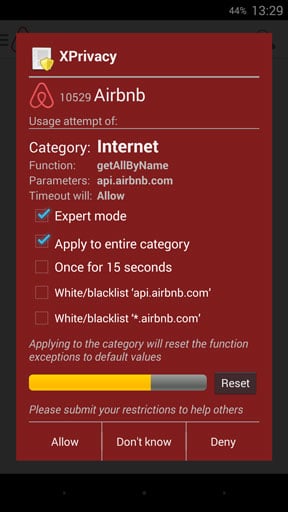
Alternatively you can tap Expert mode for more options. Here you can enable your choice to be allowed for only 15 seconds, which means you will be prompted next time the permission is used by that app.
Note that if you deny permission it may have adverse effects on how the app functions, although there will be no warning that it is your XPrivacy setting that is causing the problem. If an app starts behaving in expected ways, or stops working, you should always clear your XPrivacy settings for that app when you try to solve the problem.
Also note that when you’re prompted about permissions, the ones with a red background should always be allowed, as these are vital to the functioning of the app.
Xprivacy red

XPrivacy templates and more

By default XPrivacy will apply a template to all new apps you install, which means you will prompted to grant or deny permission requests the first time you launch the app.
You can also set up your own custom templates through the menuoption. These templates can then be applied to any app—open the app by tapping the icon from the main XPrivacy screen, then select Apply template from the menu.
In order for XPrivacy to continue working you will need to keep it and Xposed installed and activated at all times. If you uninstall either, or unroot your phone, the permissions controls will no longer apply.

How to manage configurations in Linux with Puppet and Augeas

$
0
0
http://xmodulo.com/manage-configurations-linux-puppet-augeas.html

Although Puppet is a really unique and useful tool, there are situations where you could use a bit of a different approach. Situations like modification of configuration files which are already present on several of your servers and are unique on each one of them at the same time. Folks from Puppet labs realized this as well, and integrated a great tool called Augeas that is designed exactly for this usage.
Augeas can be best thought of as filling for the gaps in Puppet's capabilities where an object­specific resource type (such as the host resource to manipulate /etc/hosts entries) is not yet available. In this howto, you will learn how to use Augeas to ease your configuration file management.

What is Augeas?

Augeas is basically a configuration editing tool. It parses configuration files in their native formats and transforms them into a tree. Configuration changes are made by manipulating this tree and saving it back into native config files.

What are we going to achieve in this tutorial?

We will install and configure the Augeas tool for use with our previously built Puppet server. We will create and test several different configurations with this tool, and learn how to properly use it to manage our system configurations.

Prerequisites

We will need a working Puppet server and client setup. If you don't have it, please follow my previous tutorial.
Augeas package can be found in our standard CentOS/RHEL repositories. Unfortunately, Puppet uses Augeas ruby wrapper which is only available in the puppetlabs repository (or EPEL). If you don't have this repository in your system already, add it using following command:
On CentOS/RHEL 6.5:
# rpm -­ivh https://yum.puppetlabs.com/el/6.5/products/x86_64/puppetlabs­release­6­10.noarch.rpm
On CentOS/RHEL 7:
# rpm -­ivh https://yum.puppetlabs.com/el/7/products/x86_64/puppetlabs­release­7­10.noarch.rpm
After you have successfully added this repository, install Ruby­Augeas in your system:
# yum install ruby­augeas
Or if you are continuing from my last tutorial, install this package using the Puppet way. Modify your custom_utils class inside of your /etc/puppet/manifests/site.pp to contain "ruby­augeas" inside of the packages array:
1
2
3
4
5
6
class custom_utils {
        package { ["nmap","telnet","vim­enhanced","traceroute","ruby­augeas"]:
                ensure => latest,
                allow_virtual => false,
        }
}

Augeas without Puppet

As it was said in the beginning, Augeas is not originally from Puppet Labs, which means we can still use it even without Puppet itself. This approach can be useful for verifying your modifications and ideas before applying them in your Puppet environment. To make this possible, you need to install one additional package in your system. To do so, please execute following command:
# yum install augeas

Puppet Augeas Examples

For demonstration, here are a few example Augeas use cases.

Management of /etc/sudoers file

1. Add sudo rights to wheel group
This example will show you how to add simple sudo rights for group %wheel in your GNU/Linux system.
1
2
3
4
5
6
7
8
9
10
11
12
13
14
15
16
# Install sudo package
package { 'sudo':
    ensure => installed, # ensure sudo package installed
}
  
# Allow users belonging to wheel group to use sudo
augeas { 'sudo_wheel':
    context => '/files/etc/sudoers', # The target file is /etc/sudoers
    changes => [
        # allow wheel users to use sudo
        'set spec[user = "%wheel"]/user %wheel',
        'set spec[user = "%wheel"]/host_group/host ALL',
        'set spec[user = "%wheel"]/host_group/command ALL',
        'set spec[user = "%wheel"]/host_group/command/runas_user ALL',
    ]
}
Now let's explain what the code does: spec defines the user section in /etc/sudoers, [user] defines given user from the array, and all definitions behind slash ( / ) are subparts of this user. So in typical configuration this would be represented as:
1
user host_group/hosthost_group/commandhost_group/command/runas_user
Which is translated into this line of /etc/sudoers:
1
%wheel ALL = (ALL) ALL
2. Add command alias
The following part will show you how to define command alias which you can use inside your sudoers file.
1
2
3
4
5
6
7
8
9
10
11
# Create new alias SERVICES which contains some basic privileged commands
augeas { 'sudo_cmdalias':
    context => '/files/etc/sudoers', # The target file is /etc/sudoers
    changes => [
      "set Cmnd_Alias[alias/name = 'SERVICES']/alias/name SERVICES",
      "set Cmnd_Alias[alias/name = 'SERVICES']/alias/command[1] /sbin/service",
      "set Cmnd_Alias[alias/name = 'SERVICES']/alias/command[2] /sbin/chkconfig",
      "set Cmnd_Alias[alias/name = 'SERVICES']/alias/command[3] /bin/hostname",
      "set Cmnd_Alias[alias/name = 'SERVICES']/alias/command[4] /sbin/shutdown",
    ]
}
Syntax of sudo command aliases is pretty simple: Cmnd_Alias defines the section of command aliases, [alias/name] binds all to given alias name, /alias/name SERVICES defines the actual alias name and alias/command is the array of all the commands that should be part of this alias. The output of this command will be following:
1
Cmnd_Alias SERVICES = /sbin/service, /sbin/chkconfig, /bin/hostname, /sbin/shutdown
For more information about /etc/sudoers, visit the official documentation.

Adding users to a group

To add users to groups using Augeas, you might want to add the new user either after the gid field or after the last user. We'll use group SVN for the sake of this example. This can be achieved by using the following command:
In Puppet:
1
2
3
4
5
6
7
augeas { 'augeas_mod_group:
    context => '/files/etc/group', # The target file is /etc/group
    changes => [
        "ins user after svn/*[self::gid or self::user][last()]",
        "set svn/user[last()] john",
    ]
}
Using augtool:
augtool> ins user after /files/etc/group/svn/*[self::gid or self::user][last()] augtool> set /files/etc/group/svn/user[last()] john

Summary

By now, you should have a good idea on how to use Augeas in your Puppet projects. Feel free to experiment with it and definitely go through the official Augeas documentation. It will help you get the idea how to use Augeas properly in your own projects, and it will show you how much time you can actually save by using it.
If you have any questions feel free to post them in the comments and I will do my best to answer them and advise you.

Useful Links


5 New Enterprise Open Source Projects to Watch

$
0
0
http://www.linux.com/news/software/applications/789241--5-new-enterprise-open-source-projects-to-watch


datacenter operating system
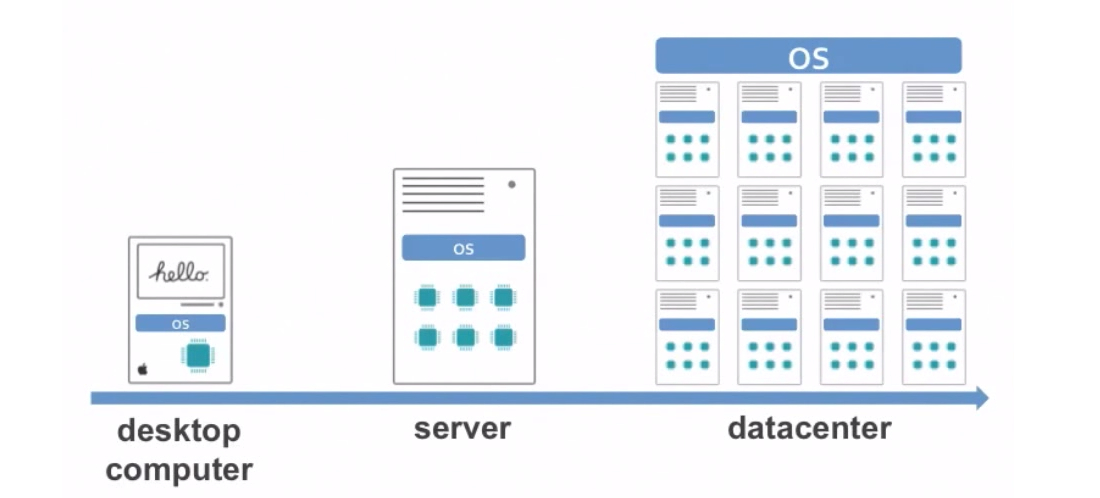
Apache Mesos aims to be an operating system for the data center. Source: Twitter.
The open source software community is nothing if not prolific, and exciting new projects arrive on the scene practically every day. Keeping up with it all can be a formidable challenge; on the other hand, failing to do so could mean you miss out on something great. Nowhere is that more true than in enterprises, where upstart new contenders can change the way business is done almost overnight. Take Docker, for example. Though it only just launched last year, the container technology tool has taken the enterprise world by storm, becoming a fundamental part of the way many businesses work.
With that in mind, we recently took a stroll through Open Hub and reached out to several open source watchers in the hopes of highlighting a few of the latest up-and-comers in this space. What, we asked, are the most exciting open source projects to launch recently with a focus on enterprises?

1. Mesos

Since Docker launched in 2013, it has become "the basis of an ecosystem and market that is taking shape as rapidly as anything we have ever seen in enterprise IT," Jay Lyman, a senior analyst for enterprise software with 451 Research, told Linux.com. Accordingly, Mesos is one of Lyman's favorite new projects.
Mesos is a cluster management tool that also serves as the basis of running and managing Docker containers. "We are seeing more and more Docker development and management tools emerge," Lyman noted, but Mesos was among the first to serve as a "sort of stripped-down runtime environment for Docker."
For more on Mesos, see the YouTube playlist of MesosCon 2014 presentations.

2. Sysdig

Launched early this year, Sysdig is an open source system exploration and troubleshooting tool from Draios, whose founder -- Loris Degioanni -- also created the popular Wireshark tool for network professionals. "What makes Sysdig interesting is that it’s designed with a Lua wrapper on top of the tool, allowing for chisels to be applied," Jonah Kowall, a research vice president in Gartner's IT Operations Research group, told Linux.com.
"You can do interesting combinatory analysis using process data (lsof), system calls (log or other system calls), wire data (packets)," Kowall explained. "This allows for more complex combinations of data going across data sources with a single open source tool."

3. Open Mirage

Mirage is an open source operating system for constructing secure, high-performance and reliable network applications across a variety of cloud computing and mobile platforms. It's also a good representation of the trend toward microkernels, which is rapidly gaining momentum.
Using Mirage, code can be developed on a normal operating system such as Linux or MacOS X, for example, before compiling into a stand-alone, specialized OS kernel that runs under the Xen hypervisor. As the Mirage team notes, "since Xen powers most public cloud computing infrastructure such as Amazon EC2, this lets your servers elastically scale up massively with little effort on your part."

4. Kubernetes

Another contender riding the Docker wave is Kubernetes, a container cluster manager from Google that was singled out as notable by the team at Black Duck Software, operator of the Open Hub (previously Ohloh) site.
Though it just launched this summer and is still in pre-production beta, this open source implementation of container cluster management is designed to be able to run anywhere. A stable, production-ready product is expected to arrive in the coming year. The video below from Google I/O 2014 describes the premise in more detail.

5. OpenPOWER

Though it's not so much a single project, IBM's OpenPOWER Foundation was launched in late 2013 as an open development community focused on data center innovation, and "it really started taking off this year," Charles King, principal analyst with Pund-IT, told Linux.com.
"The core strategy revolves around IBM licensing its POWER processor architecture in an open source model, allowing licensees to change/alter the core architecture for their own individual or commercial purposes," King explained. "The initial five companies that signed on included a couple of luminaries -- Google, NVIDIA and Tyan -- that lent the effort more gravity than it might have had otherwise. Since then, 50+ other companies have joined and are leveraging the POWER architecture across numerous projects."
Overall, King added, IBM's goal "is to capture for POWER Systems the kind of commercial advantages that Linux delivered to IBM's mainframe systems." 

An introduction to systemd for CentOS 7

$
0
0
http://linuxaria.com/article/an-introduction-to-systemd-for-centos-7

With Red Hat Enterprise Linux 7 released and CentOS version 7 newly unveiled, now is a good time to cover systemd, the replacement for legacy System V (SysV) startup scripts and runlevels. Red Hat-based distributions are migrating to systemd because it provides more efficient ways of managing services and quicker startup times. With systemd there are fewer files to edit, and all the services are compartmentalized and stand separate from each other. This means that should you screw up one config file, it won’t automatically take out other services.
Systemd has been the default system and services manager in Red Hat Fedora since the release of Fedora 15, so it is extensively field-tested. It provides more consistency and troubleshooting ability than SysV – for instance, it will report if a service has failed, is suspended, or is in error. Perhaps the biggest reason for the move to systemd is that it allows multiple services to start up at the same time, in parallel, making machine boot times quicker than they would be with legacy runlevels.


Under systemd, services are now defined in what are termed unit files, which are text files that contain all the configuration information a service needs to start, including its dependencies. Service files are located in /usr/lib/systemd/system/. Many but not all files in that directory will end in .service; systemd also manages sockets and devices.
No longer do you directly modify scripts to configure runlevels. Within systemd, runlevels have been replaced by the concept of states. States can be described as “best efforts” to get a host into a desired configuration, whether it be single-user mode, networking non-graphical mode, or something else. Systemd has some predefined states created to coincide with legacy runlevels. They are essentially aliases, designed to mimic runlevels by using systemd.
States require additional components above and beyond services. Therefore, systemd uses unit files not only to configure services, but also mounts, sockets, and devices. These units’ names end in .sockets, .devices, and so on.
Targets, meanwhile, are logical groups of units that provide a set of services. Think of a target as a wrapper in which you can place multiple units, making a tidy bundle to work with.
Unit files are built from several configurable sections, including unit descriptions and dependencies. Systemd also allows administrators to explicitly define a service’s dependencies and load them before the given service starts by editing the unit files. Each unit file has a line that starts After= that can be used to define what service is required before the current service can start. WantedBy=lines specify that a target requires a given unit.
Targets have more meaningful names than those used in SysV-based systems. A name like graphical.target gives admins an idea of what a file will provide! To see the current target at which the system is residing, use the command systemctl get-default. To set the default target, use the command systemctl set-default targetname.target. targetname can be, among others:
  • rescue.target
  • multi-user.target
  • graphical.target
  • reboot.target
Looking at the above it becomes obvious that although there is no direct mapping between runlevels and targets, systemd provides what could loosely be termed equivalent levels.
Another important feature systemd implements is cgroups, short for control groups, which provide security and manageability for the resources a system can use and control. With cgroups, services that use the same range of underlying operating system calls are grouped together. These control groups then manage the resources they control. This grouping performs two functions: it allows administrators to manage the amount of resources a group of services gets, and it provides additional security in that a service in a certain cgroup can’t jump outside of cgroups control, preventing it for example from getting access to other resources controlled by other cgroups.
Cgroups existed in the old SysV model, but were not really implemented well. systemd attempts to fix this issue.

First steps in systemd

Under systemd you can still use the service and chkconfig commands to manage those additional legacy services, such as Apache, that have not yet been moved over to systemd management. You can also use service command to manage systemd-enabled services. However, several monitoring and logging services, including cron and syslog, have been rewritten to use the functionality that is available in systemd, in part because scheduling and some of the cron functionality is now provided by systemd.
How can you start managing systemd services? Now that Centos 7 is out of the starting gate we can start to experiment with systemd and understand its operation. To begin, as the root user in a terminal, type chkconfig. The output shows all the legacy services running. As you can see by the big disclaimer, most of the other services that one would expect to be present are absent, because they have been migrated to systemd management.
Red Hat-based OSes no longer use the old /etc/initab file, but instead use a system.default configuration file. You can symlink a desired target to the system.default in order to have that target start up when the system boots. To configure the target to start a typical multi-user system, for example, run the command below:
ln -sf /lib/systemd/system/multi-user.target /etc/systemd/system/default.target
After you make the symlink, run systemctl, the replacement for chkconfig. Several pages of output display, listing all the services available:
systemd screenshot
  • Unit – the service name
  • Load – gives status of the service (such as Loaded, Failed, etc.)
  • Active – indicates whether the status of the service is Active
  • Description – textual description of the unit
The key commands and arguments in systemctl are similar to the legacy ones found in chkconfig – for example, systemctl start postfix.service.
In the same vein, use systemctl stop and systemctl status to stop services or view information. This syntax similarity to chkconfig arguments is by design, to make the transition to systemd as smooth as possible.
To see all the services you can start using systemctl and their statuses, use the command
systemctl list-unit-files --type=service

services-resized-600
While you can no longer enable a runlevel for a service using chkconfig --level, under systemd you can enable or disable a service when it boots. Use systemctl enable service to enable a service, and systemctl disable service to keep it from starting at boot. Get a service’s current status (enabled or disabled) with the command systemctl is-enabled service.

Final thoughts on systemd

It may take you some time to get used to systemd, but you should plan to use it now before it becomes a requirement and management through legacy tools is no longer available. You should find that systemd makes managing services easier than it used to be with SysV.

Understanding and Using Systemd

$
0
0
http://www.linux.com/learn/tutorials/788613-understanding-and-using-systemd

Systemd components graphic
Image courtesy Wikimedia Commons, CC BY-SA 3.0
Like it or not, systemd is here to stay, so we might as well know what to do with it.
systemd is controversial for several reasons: It's a replacement for something that a lot of Linux users don't think needs to be replaced, and the antics of the systemd developers have not won hearts and minds. But rather the opposite, as evidenced in this famous LKML thread where Linus Torvalds banned systemd dev Kay Sievers from the Linux kernel.
It's tempting to let personalities get in the way. As fun as it is to rant and rail and emit colorful epithets, it's beside the point. For lo so many years Linux was content with SysVInit and BSD init. Then came add-on service managers like the service and chkconfig commands. Which were supposed to make service management easier, but for me were just more things to learn that didn't make the tasks any easier, but rather more cluttery.
Then came Upstart and systemd, with all kinds of convoluted addons to maintain SysVInit compatibility. Which is a nice thing to do, but good luck understanding it. Now Upstart is being retired in favor of systemd, probably in Ubuntu 14.10, and you'll find a ton of systemd libs and tools in 14.04. Just for giggles, look at the list of files in the systemd-services package in Ubuntu 14.04:
$ dpkg -L systemd-services
Check out the man pages to see what all of this stuff does.
It's always scary when developers start monkeying around with key Linux subsystems, because we're pretty much stuck with whatever they foist on us. If we don't like a particular software application, or desktop environment, or command there are multiple alternatives and it is easy to use something else. But essential subsystems have deep hooks in the kernel, all manner of management scripts, and software package dependencies, so replacing one is not a trivial task.
So the moral is things change, computers are inevitably getting more complex, and it all works out in the end. Or not, but absent the ability to shape events to our own liking we have to deal with it.

First systemd Steps

Red Hat is the inventor and primary booster of systemd, so the best distros for playing with it are Red Hat Enterprise Linux, RHEL clones like CentOS and Scientific Linux, and of course good ole Fedora Linux, which always ships with the latest, greatest, and bleeding-edgiest. My examples are from CentOS 7.
Experienced RH users can still use service and chkconfig in RH 7, but it's long past time to dump them in favor of native systemd utilities. systemd has outpaced them, and service and chkconfig do not support native systemd services.
Our beloved /etc/inittab is no more. Instead, we have a /etc/systemd/system/ directory chock-full of symlinks to files in /usr/lib/systemd/system//usr/lib/systemd/system/ contains init scripts; to start a service at boot it must be linked to /etc/systemd/system/. The systemctl command does this for you when you enable a new service, like this example for ClamAV:
# systemctl enable clamd@scan.service
ln -s '/usr/lib/systemd/system/clamd@scan.service''/etc/systemd/system/multi-user.target.wants/clamd@scan.service'
How do you know the name of the init script, and where does it come from? On Centos7 they're broken out into separate packages. Many servers (for example Apache) have not caught up tosystemd and do not have systemd init scripts. ClamAV offers both systemd and SysVInit init scripts, so you can install the one you prefer:
$ yum search clamav
clamav-server-sysvinit.noarch
clamav-server-systemd.noarch
So what's inside these init scripts? We can see for ourselves:
$ less /usr/lib/systemd/system/clamd@scan.service
.include /lib/systemd/system/clamd@.service
[Unit]
Description = Generic clamav scanner daemon
[Install]
WantedBy = multi-user.target
Now you can see how systemctl knows where to install the symlink, and this init script also includes a dependency on another service, clamd@.service.
systemctl displays the status of all installed services that have init scripts:
$ systemctl list-unit-files --type=service
UNIT FILE STATE
[...]
chronyd.service enabled
clamd@.service static
clamd@scan.service disabled
There are three possible states for a service: enabled or disabled, and static. Enabled means it has a symlink in a .wants directory. Disabled means it does not. Static means the service is missing the [Install] section in its init script, so you cannot enable or disable it. Static services are usually dependencies of other services, and are controlled automatically. You can see this in the ClamAV example, as clamd@.service is a dependency of clamd@scan.service, and it runs only when clamd@scan.service runs.
None of these states tell you if a service is running. The ps command will tell you, or use systemctl to get more detailed information:
$ systemctl status bluetooth.service
bluetooth.service - Bluetooth service
Loaded: loaded (/usr/lib.systemd/system/bluetooth.service; enabled)
Active: active (running) since Thu 2014-09-14 6:40:11 PDT
Main PID: 4964 (bluetoothd)
CGroup: /system.slice/bluetooth.service
|_4964 /usr/bin/bluetoothd -n
systemctl tells you everything you want to know, if you know how to ask.

Cheatsheet

These are the commands you're probably going to use the most:
# systemctl start [name.service]
# systemctl stop [name.service]
# systemctl restart [name.service]
# systemctl reload [name.service]
$ systemctl status [name.service]
# systemctl is-active [name.service]
$ systemctl list-units --type service --all
systemd has 12 unit types. .service is system services, and when you're running any of the above commands you can leave off the .service extension, because systemd assumes a service unit if you don't specify something else. The other unit types are:

  • Target: group of units
  • Automount: filesystem auto-mountpoint
  • Device: kernel device names, which you can see in sysfs and udev
  • Mount: filesystem mountpoint
  • Path: file or directory
  • Scope: external processes not started by systemd
  • Slice: a management unit of processes
  • Snapshot: systemd saved state
  • Socket: IPC (inter-process communication) socket
  • Swap: swap file
  • Timer: systemd timer.

It is unlikely that you'll ever need to do anything to these other units, but it's good to know they exist and what they're for. You can look at them:
$ systemctl list-units --type [unit name]

Blame Game

For whatever reason, it seems that the proponents of SysVInit replacements are obsessed with boot times. My systemd systems, like CentOS 7, don't boot up all that much faster than the others. It's not something I particularly care about in any case, since most boot speed measurements only measure reaching the login prompt, and not how long it takes for the system to completely start and be usable. Microsoft Windows has long been the champion offender in this regards, reaching a login prompt fairly quickly, and then taking several more minutes to load and run nagware, commercialware, spyware, and pretty much everything except what you want. (I swear if I see one more stupid Oracle Java updater nag screen I am going to turn violent.)
Even so, for anyone who does care about boot times you can run a command to see how long every program and service takes to start up:
$ systemd-analyze blame
5.728s firewalld.service
5.111s plymouth-quit-wait.service
4.046s tuned.service
3.550s accounts.daemon.service
[...]
And several dozens more. Well that's all for today, folks. systemd is already a hugely complex beast; consult the References section to learn more.

References

Freedesktop.org systemd System and Service Manager
Here We Go Again, Another Linux Init: Intro to systemd

Linus Torvalds and others on Linux's systemd

$
0
0
http://www.zdnet.com/linus-torvalds-and-others-on-linuxs-systemd-7000033847

Summary: Systemd has been widely adopted by Linux distributions, but many developers hate it. 
 
If you're not a Linux or Unix developer, you've never heard of systemd, the new Linux-specific system and service manager. In Linux developer circles, however, nothing else ticks off many programmers more than this replacement for the Unix and Linux's traditional sysvinit daemon.
Systemd Components
Many Linux developers think systemd tries to do way, way too much for an init program.
Systemd provides a standard process for controlling what programs run when a Linux system boots up. While systemd is compatible with SysV and Linux Standard Base (LSB) init scripts, systemd is meant to be a drop-in replacement for these older ways of getting a Linux system running.
Systemd, which was created by Red Hat's Lennart Poettering and Kay Sievers, does more than start the core programs running. It also starts a journal of system activity, the network stack, a cron-style job scheduler, user logins, and many other jobs. That may sound good to you, but some developers hate it.
On the site Boycott Systemd, the authors lash out at systemd stating:
"Systemd flies in the face of the Unix philosophy: 'do one thing and do it well,' representing a complex collection of dozens of tightly coupled binaries1. Its responsibilities grossly exceed that of an init system, as it goes on to handle power management, device management, mount points, cron, disk encryption, socket API/inetd, syslog, network configuration, login/session management, readahead, GPT partition discovery, container registration, hostname/locale/time management, and other things. Keep it simple, stupid.”
Because systemd puts so many of a program's eggs in one system basket, systemd's critics argue that "there are tons of scenarios in which it can crash and bring down the whole system. But in addition, this means that plenty of non-kernel system upgrades will now require a reboot. Enjoy your new Windows 9 Linux system!”
They go on to argue that systemd's journal files, which are stored in a binary format, are potentially corruptible. In addition, they find that systemd is incompatible with other members of the Unix operating system family. They also flaw it for its "monolithic, heavily desktop-oriented,” design, which makes it a poor choice for many Linux use cases
Poettering has addressed these concerns many times since systemd appeared but the criticisms keep coming. What makes all this arguing over systemd especially odd is that, despite all this hate, it's been widely adopted. The GNOME 3.8 desktop and newer now requires systemd. Fedora, Red Hat's community Linux, was the first major distribution to start using it as a default. Since then, Debian Linux, openSUSE, and Ubuntu have all adopted systemd.
So what do Linux's leaders think of all this? I asked them and this is what they told me.
Linus Torvalds said:
"I don't actually have any particularly strong opinions on systemd itself. I've had issues with some of the core developers that I think are much too cavalier about bugs and compatibility, and I think some of the design details are insane (I dislike the binary logs, for example), but those are details, not big issues."
Theodore "Ted" Ts'o, a leading Linux kernel developer and a Google engineer, sees systemd as potentially being more of a problem. "The bottom line is that they are trying to solve some real problems that matter in some use cases. And, [that] sometimes that will break assumptions made in other parts of the system.”
Another concern that Ts'o made — which I've heard from many other developers — is that the systemd move was made too quickly: "The problem is sometimes what they break are in other parts of the software stack, and so long as it works for GNOME, they don't necessarily consider it their responsibility to fix the rest of the Linux ecosystem.”
This, as Ts'o sees it, feeds into another problem:
"Systemd problems might not have mattered that much, except that GNOME has a similar attitude; they only care for a small subset of the Linux desktop users, and they have historically abandoned some ways of interacting the Desktop in the interest of supporting touchscreen devices and to try to attract less technically sophisticated users. If you don't fall in the demographic of what GNOME supports, you're sadly out of luck.  (Or you become a second class citizen, being told that you have to rely on GNOME extensions that may break on every single new version of GNOME.)”
Ts'o has an excellent point. GNOME 3.x has alienated both users and developers. He continued, "As a result, many traditional GNOME users have moved over to Cinnamon, XFCE, KDE, etc. But as systemd starts subsuming new functions, components like network-manager will only work on systemd or other components that are forced to be used due to a network of interlocking dependencies; and it may simply not be possible for these alternate desktops to continue to function, because there is [no] viable alternative to systemd supported by more and more distributions."
Of course, Ts'o continued, "None of these nightmare scenarios have happened yet. The people who are most stridently objecting to systemd are people who are convinced that the nightmare scenario is inevitable so long as we continue on the same course and altitude.”
Ts'o is "not entirely certain it's going to happen, but he's afraid it will.
What I find puzzling about all this is that even though everyone admits that sysvinit needed replacing and many people dislike systemd, the distributions keep adopting it. Only a few distributions, including Slackware, Gentoo, PCLinuxOS, and Chrome OS, haven't adopted it.
It's not like there aren't alternatives. These include Upstart, runit, and OpenRC.
If systemd really does turn out to be as bad as some developers fear, there are plenty of replacements waiting in the wings. Indeed, rather than hear so much about how awful systemd is, I'd rather see developers spending their time working on an alternative.

Workload deployment tools for OpenStack

$
0
0
http://opensource.com/business/14/9/open-source-tools-openstack-workload-deployment

This is the second part in a series of three articles surveying automation projects within OpenStack, explaining what they do, how they do it, and where they stand in development readiness and field usage. Previously, in part one, I covered cloud deployment tools that enable you to install/update OpenStack cloud on bare metal. Next week, in the final article, I will cover automating "day 2 management"—tools to keep the cloud and workloads up and running.
The second class of automation products deals with deploying the workloads—virtual instances, virtual environments, applications, and services. The OpenStack projects in this category are Heat, Solum, and Murano.

Heat

Heat is an "orchestration service to launch multiple composite cloud applications using templates."
The user of Heat defines virtual infrastructure ‘stacks' as a template, a simple YAML file describing resources and their relations—servers, volumes, floating IPs, networks, security groups, users, etc. Using this template, Heat "orchestrates" the full lifecycle of a complete stack. Heat provisions the infrastructure, making all the calls to create the underlying parts and to wire them together. To make changes, the user modifies the template and updates the existing stack, and Heat makes the right changes. When the stack is decommissioned, Heat deletes all the allocated resources.
Heat supports auto-scaling, so a user can define a scaling group and a scaling policy. A monitoring event (e.g. Ceilometer alert) triggers the scaling policy, and Heat provisions extra instances into the auto-scaling group.
Since Icehouse, Heat also supports the provisioning and managing of software; to utilize this capability, a user defines what software should be installed on the instance, and Heat weaves deploying and configuring it into the instance lifecycle. It is also possible to integrate Heat with configuration management tools like Puppet and Chef so that Heat is called by these tools.
Heat is similar to AWS Cloud Formation. In fact, Heat started as an implementation AWS Cloud Formation templates on OpenStack and Cloud Formation compatibility is part of the Heat mission. Heat also serves as a platform component for other OpenStack services and is used as a deployment orchestration service by TripleO and Solum.
Heat is officially integrated into the OpenStack project. It is a hot project in OpenStack automation with a large, strong community. According to an OpenStack survey, Heat has about ten percent of deployment in the field.

Murano

Murano is an OpenStack self-service application catalog which targets cloud end-users (including less technically-inclined ones). Murano provides a way for developers to compose and publish high-level applications—anything from a simple single virtual machine to a complex multi-tier app with auto-scaling and self-healing. Murano uses a YAML based language to define an application, and the API and UI (user interface) to publish it to the service catalog. End users browse a categorized catalog of applications through the self-service portal, and get their apps provisioned and ready-to use with a "push-of-a-button." Murano is similar to traditional enterprise service catalog apps, like VMware vCAC or IBM Tivoli Service Request Manager.
Murano is an "OpenStack-related" project, likely to apply to "Incubating" in the Juno release cycle, and is primarily developed by Mirantis. Murano has been already used in the field, typically introduced and customized by Mirantis professional services. It seems to especially fit customers with Windows-based environments.

Solum

Solum is designed to make cloud services easier to consume and integrate into your application development process. It is just like Heroku or CloudFoundry (in fact it supports Heroku and CloudFoundry artifacts!) but is natively designed for OpenStack, within OpenStack.
Solum deploys an application from a public git repository to an OpenStack cloud, to a variety of language run-times via pluggable 'language packs.' App topology and runtime is described in a YAML "plan" file. A service add-on framework will provide services, like MongoDB, MemCache, NewRelic, etc. for the app to use.
Solum pushes an application through Continuous Integration pipeline from the source code up to the final deployment to production via a Heat template.
In the future, Solum plans to guide and support developers through the dev/test/release cycle. It will support rollbacks to previous versions, as well as, monitoring, manual and auto-scaling and other goodies being developed.
Solum's implementation leverages many OpenStack projects including Heat, Nova, Glance, Keystone, Neutron, and Mistral.
Solum is still in its infancy and most of the noted features are on the roadmap for 2015. However, it is a well-run community project with a strong team and solid support from Rackspace, Red Hat, and a few significant others.
Solum as a native PaaS looks promising if it is able to establish and differentiate itself sufficiently from existing PaaS frameworks.

Summary

When it comes to virtual infrastructure deployment, the OpenStack community has converged on Heat. Notably, Heat is a preferred way for Docker integration with OpenStack. Field adoption, while growing, still remains at about twenty percent, leaving the rest to general tools and custom solutions.
The common field patterns for application deployment are either using CloudFoundry, or custom orchestration solutions on top of masterless Puppet or Chef solo. A large number of vendors' products for cross-cloud and hybrid deployment may be at play here, too.

Shellshock: How to protect your Unix, Linux and Mac servers

$
0
0
http://www.zdnet.com/shellshock-how-to-protect-your-unix-linux-and-mac-servers-7000034072

Summary: The Unix/Linux Bash security hole can be deadly to your servers. Here's what you need to worry about, how to see if you can be attacked, and what to do if your shields are down. 
 
The only thing you have to fear with Shellshock, the Unix/Linux Bash security hole, is fear itself. Yes, Shellshock can serve as a highway for worms and malware to hit your Unix, Linux, and Mac servers, but you can defend against it.
Cybersecurity
If you don't patch and defend yourself against Shellshock today, you may have lost control of your servers by tomorrow.
However, Shellshock is not as bad as HeartBleed. Not yet, anyway.
While it's true that the Bash shell is the default command interpreter on most Unix and Linux systems and all Macs — the majority of Web servers — for an attacker to get to your system, there has to be a way for him or her to actually get to the shell remotely. So, if you're running a PC without ssh, rlogin, or another remote desktop program, you're probably safe enough.
A more serious problem is faced by devices that use embedded Linux — such as routers, switches, and appliances. If you're running an older, no longer supported model, it may be close to impossible to patch it and will likely be vulnerable to attacks. If that's the case, you should replace as soon as possible.
The real and present danger is for servers. According to the National Institute of Standards (NIST), Shellshock scores a perfect 10 for potential impact and exploitability. Red Hat reports that the most common attack vectors are:
  • httpd (Your Web server): CGI [Common-Gateway Interface] scripts are likely affected by this issue: when a CGI script is run by the web server, it uses environment variables to pass data to the script. These environment variables can be controlled by the attacker. If the CGI script calls Bash, the script could execute arbitrary code as the httpd user. mod_php, mod_perl, and mod_python do not use environment variables and we believe they are not affected.
  • Secure Shell (SSH): It is not uncommon to restrict remote commands that a user can run via SSH, such as rsync or git. In these instances, this issue can be used to execute any command, not just the restricted command.
  • dhclient: The Dynamic Host Configuration Protocol Client (dhclient) is used to automatically obtain network configuration information via DHCP. This client uses various environment variables and runs Bash to configure the network interface. Connecting to a malicious DHCP server could allow an attacker to run arbitrary code on the client machine.
  • CUPS (Linux, Unix and Mac OS X's print server): It is believed that CUPS is affected by this issue. Various user-supplied values are stored in environment variables when cups filters are executed.
  • sudo: Commands run via sudo are not affected by this issue. Sudo specifically looks for environment variables that are also functions. It could still be possible for the running command to set an environment variable that could cause a Bash child process to execute arbitrary code.
  • Firefox: We do not believe Firefox can be forced to set an environment variable in a manner that would allow Bash to run arbitrary commands. It is still advisable to upgrade Bash as it is common to install various plug-ins and extensions that could allow this behavior.
  • PostfixThe Postfix [mail] server will replace various characters with a ?. While the Postfix server does call Bash in a variety of ways, we do not believe an arbitrary environment variable can be set by the server. It is however possible that a filter could set environment variables.
So much for Red Hat's thoughts. Of these, the Web servers and SSH are the ones that worry me the most. The DHCP client is also troublesome, especially if, as it the case with small businesses, your external router doubles as your Internet gateway and DHCP server.
Of these, Web server attacks seem to be the most common by far. As Florian Weimer, a Red Hat security engineer, wrote: "HTTP requests to CGI scripts have been identified as the major attack vector." Attacks are being made against systems running both Linux and Mac OS X.
Jaime Blasco, labs director at AlienVault, a security management services company, ran a honeypot looking for attackers and found "several machines trying to exploit the Bash vulnerability. The majority of them are only probing to check if systems are vulnerable. On the other hand, we found two worms that are actively exploiting the vulnerability and installing a piece of malware on the system."
Other security researchers have found that the malware is the usual sort. They typically try to plant distributed denial of service (DDoS) IRC bots and attempt to guess system logins and passwords using a list of poor passwords such as 'root', 'admin', 'user', 'login', and '123456.'
So, how do you know if your servers can be attacked? First, you need to check to see if you're running a vulnerable version of Bash. To do that, run the following command from a Bash shell:
env x='() { :;}; echo vulnerable' bash -c "echo this is a test"
If you get the result:
vulnerable this is a test
Bad news, your version of Bash can be hacked. If you see:
bash: warning: x: ignoring function definition attempt bash: error importing function definition for `x' this is a test
You're good. Well, to be more exact, you're as protected as you can be at the moment.

Special Feature

Why business leaders must be security leaders
Why do many boards leave IT security primarily to security technicians, and why can’t techies convince their boards to spend scarce cash on protecting stakeholder information? We offer guidance on how to close the IT security governance gap.
While all major Linux distributors have released patches that stop most attacks — Apple has not released a patch yet — it has been discovered that "patches shipped for this issue are incomplete. An attacker can provide specially-crafted environment variables containing arbitrary commands that will be executed on vulnerable systems under certain conditions." While it's unclear if these attacks can be used to hack into a system, it is clear that they can be used to crash them, thanks to a null-pointer exception.
Patches to fill-in the last of the Shellshock security hole are being worked on now. In the meantime, you should update your servers as soon as possible with the available patches and keep an eye open for the next, fuller ones.
In the meantime, if, as is likely, you're running the Apache Web server, there are some Mod_Security rules that can stop attempts to exploit Shellshock. These rules, created by Red Hat, are:
Request Header values:
SecRule REQUEST_HEADERS "^\(\) {""phase:1,deny,id:1000000,t:urlDecode,status:400,log,msg:'CVE-2014-6271 - Bash Attack'"
SERVER_PROTOCOL values:
SecRule REQUEST_LINE "\(\) {""phase:1,deny,id:1000001,status:400,log,msg:'CVE-2014-6271 - Bash Attack'"
GET/POST names:
SecRule ARGS_NAMES "^\(\) {""phase:2,deny,id:1000002,t:urlDecode,t:urlDecodeUni,status:400,log,msg:'CVE-2014-6271 - Bash Attack'"
GET/POST values:
SecRule ARGS "^\(\) {""phase:2,deny,id:1000003,t:urlDecode,t:urlDecodeUni,status:400,log,msg:'CVE-2014-6271 - Bash Attack'"
File names for uploads:
SecRule FILES_NAMES "^\(\) {""phase:2,deny,id:1000004,t:urlDecode,t:urlDecodeUni,status:400,log,msg:'CVE-2014-6271 - Bash Attack'"
It is vital that you patch your servers as soon as possible, even with the current, incomplete ones, and to set up defenses around your Web servers. If you don't, you could come to work tomorrow to find your computers completely compromised. So get out there and start patching!

Linux/UNIX xargs command examples

$
0
0
http://www.linuxtechi.com/xargs-command-with-examples

xargs is a command in UNIX like System that reads items from the standard input, delimited by blanks (which can be protected with double or single quotes or a backslash) or newlines, and executes the command (default is /bin/echo) one or more times with any initial-arguments followed by items read from standard input. Blank lines on the standard input are ignored.
xargs command is very handy when combined with other commands. By default it expects input from STDIN.xargs is basically used to enhance the output of the initial command and utilize the output for performing numerous operations.
In this post we will discuss 10 practical examples of xargs command :

Example:1 Basic Usage of xargs

Type xargs , it will expect an input from us , start typing with enter for next line and then do a ctrl+d to see the output as below.
linuxtechi@mail:~$ xargs
hello
john
this is me ( ctrl+d)
hello john this is me
linuxtechi@mail:~$home/Downloads#

Eample:2 Use of Delimiters

Here we specify a delimiter using the option -d , with \n as the delimiter. It echoes the string back to the screen when we press the ctrl+d
linuxtechi@mail:~$ xargs -d\n
Hi
Welcome here
Now press Ctrl+D

linuxtechi@mail:~$ xargs -d\n
Hi
Welcome hereHi
Welcome here
Now press Ctrl+D
linuxtechi@mail:~$

Example:3 Limiting output per line

We can limit the output as per requirement using -n option in xargs command, for example to display only 2 items per line ,
linuxtechi@mail:~$ echo a1 b2 c3 d4 e45
a1 b2 c3 d4 e5
linuxtechi@mail:~$ echo a1 b2 c3 d4 e5 | xargs -n 2
a1 b2
c3 d4
e5
linuxtechi@mail:~$

Example:4 Enable User Prompt before execution

Using the option -p in xargs command , user will be prompted before the execution with y (means yes) and n (means no) options.
linuxtechi@mail:~$ echo a1 b2 c3 d4 e5 | xargs -p -n 2
/bin/echo a1 b2 ?…y
/bin/echo c3 d4 ?…a1 b2
y
/bin/echo e5 ?…c3 d4
n

linuxtechi@mail:~$ echo a1 b2 c3 d4 e5 | xargs -p -n 2
/bin/echo a1 b2 ?…y
/bin/echo c3 d4 ?…a1 b2
y
/bin/echo e5 ?…c3 d4
y
e5
linuxtechi@mail:~$

Example:5 Deleting files using find and xargs

linuxtechi@mail:~$ find /tmp -name 'abc.txt' | xargs rm

Example:6 Using grep to query files

we can use the grep command with xargs to filter the particular search from the result of find command. An example is shown below :
linuxtechi@mail:~$ find . -name "stamp" | xargs grep "country"
country_name
linuxtechi@mail:~$

Example:7 Handle space in file names

xargs can also handle spaces in files by using print0 and xargs -0 arguments to find command.
linuxtechi@mail:~$ find /tmp -name "*.txt" -print0 | xargs -0 ls
/tmp/abcd asd.txt /tmp/asdasd asdasd.txt /tmp/cdef.txt
linuxtechi@mail:~$ find /tmp -name "*.txt" -print0 | xargs -0 rm
linuxtechi@mail:~$

Example:8 Use xargs with cut command

First create a cars.txt with below conetnts :
linuxtechi@mail:~$ cat cars.txt
Hundai,Santro
Honda,Mobilio
Maruti,Ertiga
Skoda,Fabia

To display data in first column as shown below.
linuxtechi@mail:~$ cut -d, -f1 cars.txt | sort | xargs
Honda Hundai Maruti Skoda
linuxtechi@mail:~$

Example:9 Count the number of lines in each file.

linuxtechi@mail:~$ ls -1 *.txt | xargs wc -l
4 cars.txt
13 trucks.txt
17 total
linuxtechi@mail:~$

Example:10 Move files to a different location

linuxtechi@mail:~$ pwd
/home/linuxtechi
linuxtechi@mail:~$ ls -l *.sh
-rw-rw-r– 1 linuxtechi linuxtechi 0 Sep 15 22:53 abcde.sh
-rw-rw-r– 1 linuxtechi linuxtechi 0 Sep 15 22:53 abcd.sh
-rw-rw-r– 1 linuxtechi linuxtechi 0 Sep 15 22:53 fg.sh

linuxtechi@mail:~$ sudo find . -name "*.sh" -print0 | xargs -0 -I {} mv {} backup/
linuxtechi@mail:~$ ls -ltr backup/

total 0
-rw-rw-r– 1 linuxtechi linuxtechi 0 Sep 15 22:53 abcd.sh
-rw-rw-r– 1 linuxtechi linuxtechi 0 Sep 15 22:53 abcde.sh
-rw-rw-r– 1 linuxtechi linuxtechi 0 Sep 15 22:53 fg.sh
linuxtechi@mail:~$


How to create a cloud-based encrypted file system on Linux

$
0
0
http://xmodulo.com/create-cloud-based-encrypted-file-system-linux.html

Commercial cloud storage services such as Amazon S3 and Google Cloud Storage offer highly available, scalable, infinite-capacity object store at affordable costs. To accelerate wide adoption of their cloud offerings, these providers are fostering rich developer ecosystems around their products based on well-defined APIs and SDKs. Cloud-backed file systems are one popular by-product of such active developer communities, for which several open-source implementations exist.
S3QL is one of the most popular open-source cloud-based file systems. It is a FUSE-based file system backed by several commercial or open-source cloud storages, such as Amazon S3, Google Cloud Storage, Rackspace CloudFiles, or OpenStack. As a full featured file system, S3QL boasts of a number of powerful capabilities, such as unlimited capacity, up to 2TB file sizes, compression, UNIX attributes, encryption, snapshots with copy-on-write, immutable trees, de-duplication, hardlink/symlink support, etc. Any bytes written to an S3QL file system are compressed/encrypted locally before being transmitted to cloud backend. When you attempt to read contents stored in an S3QL file system, the corresponding objects are downloaded from cloud (if not in the local cache), and decrypted/uncompressed on the fly.
To be clear, S3QL does have limitations. For example, you cannot mount the same S3FS file system on several computers simultaneously, but only once at a time. Also, no ACL (access control list) support is available.
In this tutorial, I am going to describe how to set up an encrypted file system on top of Amazon S3, using S3QL. As an example use case, I will also demonstrate how to run rsync backup tool on top of a mounted S3QL file system.

Preparation

To use this tutorial, you will need to create an Amazon AWS account (sign up is free, but requires a valid credit card).
If you haven't done so, first create an AWS access key (access key ID and secret access key) which is needed to authorize S3QL to access your AWS account.
Now, go to AWS S3 via AWS management console, and create a new empty bucket for S3QL.

For best performance, choose a region which is geographically closest to you.

Install S3QL on Linux

S3QL is available as a pre-built package on most Linux distros.
On Debian, Ubuntu or Linux Mint:
$ sudo apt-get install s3ql
On Fedora:
$ sudo yum install s3ql
On Arch Linux, use AUR.

Configure S3QL for the First Time

Create authinfo2 file in ~/.s3ql directory, which is a default S3QL configuration file. This file contains information about a required AWS access key, S3 bucket name and encryption passphrase. The encryption passphrase is used to encrypt the randomly-generated master encryption key. This master key is then used to encrypt actual S3QL file system data.
$ mkdir ~/.s3ql
$ vi ~/.s3ql/authinfo2
1
2
3
4
5
[s3]
storage-url: s3://[bucket-name]
backend-login: [your-access-key-id]
backend-password: [your-secret-access-key]
fs-passphrase: [your-encryption-passphrase]
The AWS S3 bucket that you specify should be created via AWS management console beforehand.
Make the authinfo2 file readable to you only for security.
$ chmod 600 ~/.s3ql/authinfo2

Create an S3QL File System

You are now ready to create an S3QL file system on top of AWS S3.
Use mkfs.s3ql command to create a new S3QL file system. The bucket name you supply with the command should be matched with the one in authinfo2 file. The "--ssl" option forces you to use SSL to connect to backend storage servers. By default, the mkfs.s3ql command will enable compression and encryption in the S3QL file system.
$ mkfs.s3ql s3://[bucket-name] --ssl
You will be asked to enter an encryption passphrase. Type the same passphrase as you defined in ~/.s3ql/autoinfo2 (under "fs-passphrase").
If a new file system was created successfully, you will see the following output.

Mount an S3QL File System

Once you created an S3QL file system, the next step is to mount it.
First, create a local mount point, and then use mount.s3ql command to mount an S3QL file system.
$ mkdir ~/mnt_s3ql
$ mount.s3ql s3://[bucket-name] ~/mnt_s3ql
You do not need privileged access to mount an S3QL file system. Just make sure that you have write access to the local mount point.
Optionally, you can specify a compression algorithm to use (e.g., lzma, bzip2, zlib) with "--compress" option. Without it, lzma algorithm is used by default. Note that when you specify a custom compression algorithm, it will apply to newly created data objects, not existing ones.
$ mount.s3ql --compress bzip2 s3://[bucket-name] ~/mnt_s3ql
For performance reason, an S3QL file system maintains a local file cache, which stores recently accessed (partial or full) files. You can customize the file cache size using "--cachesize" and "--max-cache-entries" options.
To allow other users than you to access a mounted S3QL file system, use "--allow-other" option.
If you want to export a mounted S3QL file system to other machines over NFS, use "--nfs" option.
After running mount.s3ql, check if the S3QL file system is successfully mounted:
$ df ~/mnt_s3ql
$ mount | grep s3ql

Unmount an S3QL File System

To unmount an S3QL file system (with potentially uncommitted data) safely, use umount.s3ql command. It will wait until all data (including the one in local file system cache) has been successfully transferred and written to backend servers. Depending on the amount of write-pending data, this process can take some time.
$ umount.s3ql ~/mnt_s3ql

View S3QL File System Statistics and Repair an S3QL File System

To view S3QL file system statistics, you can use s3qlstat command, which shows information such as total data/metadata size, de-duplication and compression ratio.
$ s3qlstat ~/mnt_s3ql

You can check and repair an S3QL file system with fsck.s3ql command. Similar to fsck command, the file system being checked needs to be unmounted first.
$ fsck.s3ql s3://[bucket-name]

S3QL Use Case: Rsync Backup

Let me conclude this tutorial with one popular use case of S3QL: local file system backup. For this, I recommend using rsync incremental backup tool especially because S3QL comes with a rsync wrapper script (/usr/lib/s3ql/pcp.py). This script allows you to recursively copy a source tree to a S3QL destination using multiple rsync processes.
$ /usr/lib/s3ql/pcp.py -h

The following command will back up everything in ~/Documents to an S3QL file system via four concurrent rsync connections.
$ /usr/lib/s3ql/pcp.py -a --quiet --processes=4 ~/Documents ~/mnt_s3ql
The files will first be copied to the local file cache, and then gradually flushed to the backend servers over time in the background.
For more information about S3QL such as automatic mounting, snapshotting, immuntable trees, I strongly recommend checking out the official user's guide. Let me know what you think of S3QL. Share your experience with any other tools.

Six of the Best Open Source Data Mining Tools

$
0
0
http://thenewstack.io/six-of-the-best-open-source-data-mining-tools

Cloud Market
It is rightfully said that data is money in today’s world.
Along with the transition to an app-based world comes the exponential growth of data. However, most of the data is unstructured and hence it takes a process and method to extract useful information from the data and transform it into understandable and usable form. This is where data mining comes into picture. Plenty of tools are available for data mining tasks using artificial intelligence, machine learning and other techniques to extract data.
Here are six powerful open source data mining tools available:

RapidMiner (formerly known as YALE)

rapidminer
Written in the Java Programming language, this tool offers advanced analytics through template-based frameworks. A bonus: Users hardly have to write any code. Offered as a service, rather than a piece of local software, this tool holds top position on the list of data mining tools.
 In addition to data mining, RapidMiner also provides functionality like data preprocessing and visualization, predictive analytics and statistical modeling, evaluation, and deployment. What makes it even more powerful is that it provides learning schemes, models and algorithms from WEKA and R scripts.
RapidMiner is distributed under the AGPL open source licence and can be downloaded from SourceForge where it is rated the number one business analytics software. 

WEKA

The original non-Java version of WEKA primarily was developed for analyzing data from the agricultural domain. With the Java-based version, the tool is very sophisticated and used in many different applications including visualization and algorithms for data analysis and predictive modeling. Its free under the GNU General Public License, which is a big plus compared to RapidMiner, because users can customize it however they please.
weka
WEKA supports several standard data mining tasks, including data preprocessing, clustering, classification, regression, visualization and feature selection.
WEKA would be more powerful with the addition of sequence modeling, which currently is not included.

 R-Programming

R

What if I tell you that Project R, a GNU project, is written in R itself? It’s primarily written in C and Fortran. And a lot of its modules are written in R itself. It’s a free software programming language and software environment for statistical computing and graphics. The R language is widely used among data miners for developing statistical software and data analysis. Ease of use and extensibility has raised R’s popularity substantially in recent years.
Besides data mining it provides statistical and graphical techniques, including linear and nonlinear modeling, classical statistical tests, time-series analysis, classification, clustering, and others.

Orange

orange
Python is picking up in popularity because it’s simple and easy to learn yet powerful. Hence, when it comes to looking for a tool for your work and you are a Python developer, look no further than Orange, a Python-based, powerful and open source tool for both novices and experts.

You will fall in love with this tool’s visual programming and Python scripting. It also has components for machine learning, add-ons for bioinformatics and text mining. It’s packed with features for data analytics.

KNIME

KNIME
Data preprocessing has three main components:  extraction, transformation and loading. KNIME does all three. It gives you a graphical user interface to allow for the assembly of nodes for data processing. It is an open source data analytics, reporting and integration platform. KNIME also integrates various components for machine learning and data mining through its modular data pipelining concept and has caught the eye of business intelligence and financial data analysis.
 Written in Java and based on Eclipse, KNIME is easy to extend and to add plugins. Additional functionalities can be added on the go. Plenty of data integration modules are already included in the core version.

NLTK

NLTK
When it comes to language processing tasks, nothing can beat NLTK. NLTK provides a pool of language processing tools including data mining, machine learning, data scraping, sentiment analysis and other various language processing tasks. All you need to do is install NLTK, pull a package for your favorite task and you are ready to go. Because it’s written in Python, you can build applications on top if it, customizing it for small tasks.


Red Hat Storage Server 3: Not your usual software-defined storage

$
0
0
http://www.zdnet.com/red-hat-storage-server-3-not-your-usual-software-defined-storage-7000034299

Summary: Red Hat's new storage server does more than just help you get a handle on your enterprise storage. It also gives you what you need to manage big data and ready-to-run partner storage solutions.
Remember when gigabyte drives were big? Recall when a terabyte of storage was enormous? Those days are long gone when your business is moving to petabytes. To manage that kind of storage you need a program that can handle "scale-out" file storage. For your colossal storage needs, Red Hat has a new open source, software-defined storage manager: Red Hat Storage Server 3 (RHSS).
RHS_Architecture
Want to manage petabytes of storage? Consider using Red Hat Storage Server 3.
This new RHSS can run on your commerical off-the-shelf (COTS) x86 servers, and on OpenStack or Amazon Web Services (AWS) cloud. It's based on open source Red Hat's GlusterFS 3.6 file system and Red Hat Enterprise Linux (RHEL) 6. Red Hat claims that RHSS 3 can "easily scale to support petabytes of data and offer granular control of your storage environment while lowering the overall cost of storage."
Its new features include:
  • Increased scale and capacity by more than three times with support for up to 60 drives per server, up from 36, and 128 servers per cluster, up from 64, providing a usable capacity of up to 19 petabytes per cluster.
  • Improved data protection and operational control of storage clusters, including volume snapshots for point-in-time copy of critical data and comprehensive monitoring of the storage cluster using open, industry standard frameworks, such as Nagios and SNMP.
  • Easy integration with emerging big data analytics environments with support for a Hadoop File System Plug-In that enables running Apache Hadoop workloads on the storage server, as well as tight integration with Apache Ambari for management and monitoring of Hadoop and underlying storage.
  • More hardware choice and flexibility, including support for SSD for low latency workloads, and a significantly expanded hardware compatibility list (HCL) for greater choice in hardware platforms.
  • Rapid deployment with an RPM-based distribution option offering maximum deployment flexibility to existing RHEL users. Customers can now easily add Red Hat Storage Server to existing pre-installed RHEL deployments.
Red Hat recommends RHSS 3 for the following workloads:
  • Cold Storage for Splunk Analytics Workloads
  • Hadoop Compatible File System for running Hadoop Analytics
  • ownCloud File Sync n' Share
  • Digital multi-media (video, audio, pictures) serving (e.g., content delivery networks, online radio)
  • Disaster Recovery using Geo-replication
  • Live virtual machine image store for Red Hat Enterprise Virtualization 
  • Large File and Object Store (using either NFS, SMB or FUSE client)
  • Active archiving and near-line storage
  • Backup target for Commvault Simpana  
  • Enterprise NAS dropbox & object Store/Cloud Storage for service providers
The company also comes right out and admits that RHSS is not for every file system job. How refreshing! The workloads to avoid are those that are:
  • Highly transactional like a database
  • IOPS (Input/Output Operations Per Second) intensive
  • Write-mostly and involve a lot of contention
  • Involve a lot of directory based operations and small files
The net result of all this, according to a statement by 451 Research's storage research VP Simon Robinson, is that since enterprises now want their IT stack to look and act like a cloud, "the storage infrastructure must support this change. Within many enterprise IT departments, this is prompting a fundamental rethink of storage strategy. Red Hat's software-defined storage portfolio offers an open-source alternative to proprietary technology stacks to address mounting challenges around the growth of enterprise data."
This is more than just a product release. Red Hat also announced that it's partnered with Splunk, Hortonworks, and ownCloud to create RHSS 3-based enterprise programs for log and cyber-security analytics, Apache Hadoop, and enterprise file sharing and collaboration programs, respectively.
OwnCloud, an open source cloud company, which is using RHSS3 to integrate with its own private Infrastructure-as-a-Service (IaaS) cloud, is a living example of Robinson's point. Together, ownCloud and Red Hat enables you to leverage your existing straphe infrastructure, with such local server standards as LDAP/AD, SAML, Database, NFS, CIFS, while being able to scale out to RHSS storage.
In a study run on HP ProLiant SL4540 servers, the two companies found that their paired storage options with 40,000 concurrent users saw excellent cost of ownership (TCO) improvement by converging the application server and storage server tiers onto the same servers, compared to traditional solutions with separate storage server appliances.
Want to see it for yourself? The companies have published a reference architecture so you can try deploying ownCloud Enterprise Edition and Red Hat Storage Server 3 for yourself.
So, if you're interested in serious storage management, I recommend giving RHSS 3 a long, hard look. It will be worth your time and attention.
Related Stories:

Deploying Apache Virtual Hosts using Puppet on CentOS 6

$
0
0
http://funwithlinux.net/2014/10/deploying-apache-virtual-hosts-using-puppet-on-centos-6

Scaling a website to serve thousands or even tens of thousands of users simultaneously is a challenge often best tackled by horizontal scaling – distributing workloads across dozens or even hundreds of servers. As a tool for preparing servers for that task, Puppet offers low deployment costs, ease of use, and automated configuration management.
After a successful deployment of a new hardware farm, how can you assure a static configuration across your entire environment? Puppet addresses that problem. Let’s see how to install Puppet and use it to deploy, as an example, an Apache web server virtual host on CentOS 6. This tutorial shows how to deploy virtual hosts on only one server, but the same steps can be replicated to manage many servers. I’ll assume you’re familiar with the Linux command line, basic networking concepts, and using Apache.

Install the Puppet Master

First, some terminology. The Puppet Master is the node in charge of reviewing the state and configuration of Puppet agents on managed nodes. For our purposes, one CentOS server, pup1, will be the Puppet Master, while another, pup2, will be a node.
Pre-compiled Puppet packages are available for most popular distros. We’ll use the open source version of Puppet though packages available in the EPEL repository[, which should be set up in your sources.lst file]. The commands to set up the Puppet repos for x86_64 and i386 architectures are
sudo rpm -ivh https://yum.puppetlabs.com/el/6/products/x86_64/puppetlabs-release-6-7.noarch.rpm
and
sudo rpm -ivh https://yum.puppetlabs.com/el/6/products/i386/puppetlabs-release-6-7.noarch.rpm
Once the repository is set up, you can install the puppet-server package, which enables a server to be a Puppet Master, with the command
yum install puppet-server. This will install both the Puppet Master service (puppetmaster) as well as the Puppet client agent and service (puppet)
Puppet Masters need to be able to receive incoming TCP connections on port 8140, so open that port in your firewall:
1
iptables -I INPUT -p tcp --dport 8140 -j ACCEPT && service iptables save
All of the servers need to know which server is the Puppet Master, including the Master itself. Add the following line to /etc/hosts:
1
127.0.0.1  puppet
To test that Puppet is running correctly, create the file /etc/puppet/manifests/site.pp:
1
2
3
4
5
6
7
#site.pp
file {'testfile':
      path    => '/tmp/testfile',
      ensure  => present,
      mode    => 0640,
      content => "I'm a test file.",
}
The above file is important; it’s the default manifest file for all of the Puppet nodes. This file contains defines all resources that will be managed by the Puppet Master. Currently, the manifest is very simple, just one static file resource, similar to a ‘hello world’ program. The first line defines the resource type, and the name of the resource as it will be referenced by Puppet. Path is the fully qualified pathname of the file, as CentOS will refer to it. The ensure attribute tells Puppet the file’s requested state, in this case, present. Mode are the Linux file system permissions, and content is what will actually be inside this file.
Edit /etc/puppet/puppet.conf and add server = pup1 in the [agent] section. This tells the Puppet Master service that the hostname of the server that the service is running on is pup1
Now start Puppet and the Puppet Master service with the commands service puppet start && service puppetmaster start.
To configure the services to start automatically, run chkconfig puppet on && chkconfig puppetmaster on.
If everything went well, you should see a /tmp/testfile that Puppet created as defined by the site manifest file.

Install the Puppet agent on nodes

Now that the Puppet Master is working properly, you can install the Puppet agents on other nodes. On pup2, install the Puppet repo using the same command as above, and the puppet package with yum install puppet.
Add the IP address of the Puppet Master server to the /etc/hosts on each node, along with the names “puppet” and “pup1.” In this example, our Puppet Master server is on the local LAN IP 192.168.1.1. Please edit for your configuration:
192.168.1.1  puppet pup1
Edit /etc/puppet/puppet.conf and add server = pup1 in the [agent] section, then start the Puppet agent service and add it to the list of services to start at boot time: service puppet start && chkconfig puppet on.
After the Puppet agent starts for the first time, you need to approve a certificate-signing request on the host so the new agent can talk to the server. On pup1, run puppet cert --list. That command should display the hostname “pup2″ with a certificate string. Run puppet cert sign --all to sign all pending cert requests.
Now restart the agent on pup2. If everything went well, you should see /tmp/testfile created on the node, just as it was on the master server.

Create a Puppet module

Typically, Puppet agents receive their instructions from modules, which contain the manifests you wish to apply to a host or group of hosts.
For this example, create a module called webserver. First create a directory structure in the correct path: mkdir -p /etc/puppet/modules/webserver/manifests. Then create the init.pp manifest file in that directory:
1
2
3
4
5
6
7
8
9
10
11
12
13
14
15
16
17
18
19
20
21
22
23
24
25
26
27
28
29
30
31
32
33
34
35
36
37
38
39
40
41
42
43
44
45
46
47
48
49
50
51
52
53
54
#/etc/puppet/modules/webserver/manifests/init.pp
class webserver {
    package { 'httpd':
        ensure => installed,
    }
    file { 'www1.conf':
        path => '/etc/httpd/conf.d/www1.conf',
        ensure => file,
        require => [Package['httpd'], File['www1.index']],
        source => "puppet:///modules/webserver/www1.conf",
    }
    file { 'www1.index':
        path => '/var/www/index.html',
        ensure => file,
        source => "puppet:///modules/webserver/index1.html",
        require => Package['httpd'],
    }
    file { 'www2.index':
        path => '/var/www2/index.html',
        ensure => file,
        require => File['www2.docroot'],
        source => "puppet:///modules/webserver/index2.html",
        seltype => 'httpd_sys_content_t',
    }
    file { 'www2.conf':
        path => '/etc/httpd/conf.d/www2.conf',
        ensure => file,
        require => [Package['httpd'], File['www2.index']],
        source => "puppet:///modules/webserver/www2.conf",
    }
    file { 'www2.docroot':
        path => '/var/www2',
        ensure => directory,
        seltype => 'httpd_sys_content_t',
    }
    service { 'httpd':
        name => 'httpd',
        ensure => running,
        enable => true,
        subscribe => [File['www1.conf'], File['www2.conf']],
    }
    service { 'iptables':
        name => 'iptables',
        ensure => running,
        enable => true,
        subscribe => File['iptables.conf'],
    }
    file { 'iptables.conf':
        path => '/etc/sysconfig/iptables',
        ensure => file,
        source => "puppet:///modules/webserver/iptables.conf",
    }
 
}
In this manifest, we defined a class ‘webserver’. This class defines numerous resources within, and can be referenced by external manifests using this class name. Some new resource types have been introduced since our example site.pp manifest file, which are covered here.
The first new resource type is ‘package’. A package resource is referred to directly by the name of the package in available repositories. Since Apache2 Webserver is referred to as httpd in the CentOS repositories, that is the name that must be used here. The ensure attribute instructs Puppet to ensure that the package is installed.
The next resource is file ‘www1.conf’. This file’s source is defined in an external file, which is part of the webserver module. This file and its contents will be described later. This file resource also has the ‘require’ attribute. The order in which Puppet manifests are applied, and the resources defined therein, is not guaranteed. Often times, in order for software to work properly, dependencies must be met. You must manually declare dependencies using the require attribute for each resource that depends on packages, files, or folders. The file ‘www1.conf’ depends on the package ‘httpd’ as well as the file ‘www1.index’, which has not been defined yet. The ensure attribute will instruct Puppet to make those other resources available before processing file ‘www1.index’.
The final new resource type is ‘service’. The name of the service refers directly to the system service installed by a package. The service ‘httpd’ is the Apache2 Webserver in CentOS, and thus is what is referenced by Puppet. The attribute ‘enable’ refers to the service starting at system boot, and the ‘ensure’ attribute tells Puppet the run state of the service. A special attribute for the service type is ‘subscribe’. This instructs Puppet to restart the service whenever the files www1.conf or www2.conf change their contents.
Puppet manifests require careful planning. For instance, you don’t want to create a www1.conf file until the httpd package is installed because the necessary /etc/httpd/ directories will not have been created yet. Trying to create a file in a nonexistent directory will cause Puppet to fail. Therefor, we ‘require’ the httpd package be installed before creating the www1.conf file. Puppet will also fail if it encounters any circular dependencies, so be sure your resources are planned logically.
Since we have declared a number of dependencies which include .conf files, we need to create the files themselves to be included in the module so the Puppet agent can write them to the local file system of the nodes. Place these files in /etc/puppet/modules/webserver/files/ on the Puppet Master, pup1:
index1.html:
1
2
3
4
5
<html>
<body>
I'm in /var/www
</body>
</html>
index2.html:
1
2
3
4
5
<html>
<body>
I'm in /var/www2
</body>
</html>
iptables.conf:
1
2
3
4
5
6
7
8
9
10
11
12
13
*filter
:INPUT ACCEPT [0:0]
:FORWARD ACCEPT [0:0]
:OUTPUT ACCEPT [50:4712]
-A INPUT -p tcp -m tcp --dport 80 -j ACCEPT
-A INPUT -p tcp -m tcp --dport 8140 -j ACCEPT
-A INPUT -m state --state RELATED,ESTABLISHED -j ACCEPT
-A INPUT -p icmp -j ACCEPT
-A INPUT -i lo -j ACCEPT
-A INPUT -p tcp -m state --state NEW -m tcp --dport 22 -j ACCEPT
-A INPUT -j REJECT --reject-with icmp-host-prohibited
-A FORWARD -j REJECT --reject-with icmp-host-prohibited
COMMIT
www1.conf:
1
2
3
4
5
NameVirtualHost *:80
<VirtualHost *:80>
  DocumentRoot /var/www
  ServerName www2.example.com
</VirtualHost>
www2.conf:
1
2
3
4
5
NameVirtualHost *:80
<VirtualHost *:80>
  DocumentRoot /var/www2
  ServerName www2.example.com
</VirtualHost>
That’s everything you need for this Puppet module. You now need to include it in the site manifest file. To apply this module to all registered nodes, add an include statement to the manifest file. Since it is unlikely that every server in an environment will have the exact same configuration applied to it, you can utilize the node statement to apply a given module only to a given system. If you have more than one server, you can use a regular expression in place of the string for host names instead of listing them one by one. Important: If you define one node in the site’s manifest file, then you must define either all nodes, or define a default node statement for any remaining hosts.
1
2
3
4
5
6
7
8
9
10
#site.pp
file {'testfile':
      path    => '/tmp/testfile',
      ensure  => present,
      mode    => 0640,
      content => "I'm a test file.",
}
node 'pup2' {
      include webserver
}
The Puppet Agent on pup2 will automatically apply the new configuration (also referred to as the catalog) during the next runinterval, which is how often the Puppet Agent applies the catalog; this is every 30 minutes by default and is configurable in your node’s puppet.conf file. You can also apply the catalog immediately and see any debugging output by running puppet agent --test.
After applying the new catalog, you should be able to view both of your new sites on pup2 by editing your workstation’s host file to include the new domains mapped to pup2′s IP address. If you were deploying these new nodes in a production setting, the (many) nodes would most likely be behind a software or hardware load balancer (such as HAProxy, Amazon Elastic Load Balancing, or an F5), with DNS entries pointing to the Virtual IP of the load balancer.
This brief tutorial should give you an idea of how easy it is to get up and running with Puppet. While we created a simple VirtualHost by hand, Puppet also has a huge variety of plugins available to further refine control of VirtualHosts by Puppet directly.

How to Control Your Linux System Just with Your Head and a Webcam

$
0
0
http://news.softpedia.com/news/How-to-Control-Your-Linux-System-Just-with-Your-Head-and-a-Webcam-462086.shtml

An open source application will provide all the necessary options to control all the functions of the PC
 
Controlling the operating system without a mouse and keyboard might sound difficult, but it's actually easier than you think. All you need is a webcam and the Enable Viacam free application.

There are many people out there who can't use the mouse and keyboard in order to control their system, but that should not stop them from using their PC. This can be done very easily with an app called Enable Viacam, which tracks head movement and translates them to the mouse.

As you can imagine, this is possible with the help of a webcam and it doesn't have to be a really high-end model, although the better the camera, the better the results.

What you can expect from Enable Viacam

The application is very easy to use and the default settings should be more than enough for most people. Even so, there are a number of parameters that can be tweaked from the interface, like double clicking, some motion settings, sensitivity, and so on.

"Enable Viacam (eViacam) is a mouse replacement software that moves the pointer as you move your head. It works on standard PC equipped with a webcam. No additional hardware is required. It's completely free, open source and easy to use!" reads the official website.

The developers also present some of the features of Enable Viacam, like the ability to change the pointer speed, the dwelling time, motion acceleration. The software also provides a complete experience right after installation and no further assistance is required.

How to install it

The developers provide a source package for the application, so it should be quite easy to install on all Linux operating systems. If you are an Ubuntu user, you also have the opportunity to use a PPA, which is much easier to deal with than the source archive.

In order to add the PPA to your system, you will need to open a terminal and enter a few commands. It's painless and fast, but you must have root access in order to make it work:

code
sudo add-apt-repository ppa:cesar-crea-si/eviacam
sudo apt-get update
sudo apt-get install eviacam

After the installation has been completed, all you have to do is to start the application and follow the wizard. You can find more details about this software solution on the official website, along with the instructions on how to compile it. Keep in mind that this is a free application.
Viewing all 1407 articles
Browse latest View live