Quantcast
Channel: Sameh Attia
Viewing all 1407 articles
Browse latest View live

How To Create SSH Secure Communication Channel with Putty

$
0
0
http://www.howopensource.com/2014/10/creare-secure-communication-putty

Imagine you are connected to public wireless network and want to check some admin panel that does not support HTTPS. Then you are in trouble and you need some simple trick to do the job. In this case you can create SSH tunnel to remote host and traffic to this host will be encrypted and there is nothing to worry about. Your real connection goes over SSH tunnel and its purpose is to allow traffic to pass securely through that tunnel to a remote host.
SSH tunneling is very handy in following situations:
– Accessing sensitive web resources via encrypted channel;
– Bypassing ISP/Corporate network restrictions. For example you can bypass some ports or hosts.
But first you need to check one setting in your SSH server configuration and if it is missing you have to add it. We are talking about PermitTunnel yes in file SSH daemon configuration file /etc/ssh/sshd_config.
cd /etc/ssh
grep PermitTunnel sshd_config
If grep command returns nothing or “PermitTunnel no” then you need to edit SSH daemon configuration file.
sudo vi sshd_config
When you open sshd_config file at the end add the following option.
PermitTunnel yes
Then you need to restart SSH service.
sudo service ssh restart
If this option is present in your configuration file there is nothing to do. Just ignore above section.
To connection from Windows to your Linux host you need PuTTY. Most probably you are already familiar with PuTTY. It is a open source SSH client, terminal emulator and network file transfer application. It supports major network protocols, such as SCP, SSH, Telnet and rlogin. PuTTY was originally written only for Windows, but now it has ports to various other OSes. You can download it from here.
Here are the steps to perform to achieve task:
1. Open PuTTY.
2. Navigate to Connection -> SSH -> Tunnels.
3. In field Source port enter port to which to connect your program (in my test scenario it will be a browser).
4. In field Destination enter destination host and port where you want to connect.
5. Click Add button.
It should look something like that.
secure communication with putty
putty ssh tunneling
Then you need to return to main PuTTY window and to enter host to which you want to connect and actually to connect to it.
ssh secure tunneling
Next step is to login to that Linux host with your user name and password.
ssh secure communication tunnel
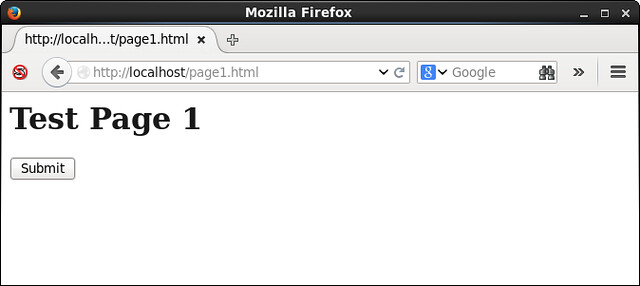
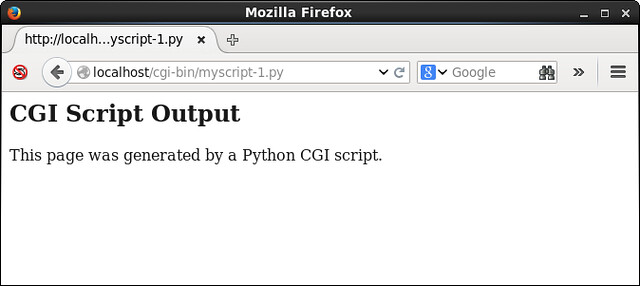
When you login you just open your browser and point to localhost:8080 and then you will see output from where it points – in our scenario to remote host Apache web server.
putty tunneling
Basically what happens is that we connect to localhost and port which we specify in field “Source port”. Then connection goes from our computer to remote host which we connected and all traffic is encrypted (so nothing to worry about). Then SSH daemon redirects traffic to destination which we specify in corresponding field. This could be very useful to do VNC connections over SSH which I will write very soon.

How To Configure SSL In Tomcat

$
0
0
http://website-security.info/tomcat-java-ssl

To secure the communication and increase the level of privacy to and from your Tomcat servlet container you should use SSL. Usually there's an Apache or Nginx in front of Tomcat to serve external clients' request and this web front server is also supposed to provide SSL connectivity.

However, this is not always the case and Tomcat may be accessed by clients directly so the SSL should be installed on Tomcat.

Furthermore, even if there's a dedicated frontend, the communication between that frontend and Tomcat should be also secured with an SSL, especially if the two servers are in two different networks and there is a chance of network sniffing. The latter is not only a good security practice but often a requirement such as for the PCI SSC Data Security Standards.

Once you have decided to enable SSL for a Tomcat connector here is the best way to do it. First, you need a Java SSL keystore. To avoid confusion with other Java applications you can use a dedicated keystore. If you don't already have a dedicated, it will be created when you create your first private key.

Here is how to create a private key for example.org with minimum details:
/usr/bin/keytool -genkey -alias'server'-dname "CN=example.org, O=Default, C=US"
 
-keyalg RSA -keystore /var/local/keystore1.jks
While you create the private key, and possibly the keystore, you will be asked for the password. By default, all Java keystores have password changeit. You are encouraged to use a stronger one, of course. Note the alias parameter – server. This alias must be always specified when you deal with the certificate for example.org.

Once you have the private key you can create the CSR (Certificate Signing Request) for your CA (Certificate Authority). A CA can be any SSL provider and you could even create your own CA but this is a different topic.

So to create the CSR for example.org based on the previously stored private key run the command:
/usr/bin/keytool -certreq -keyalg RSA -alias server -file /root/example.org.csr
 
-keystore /var/local/keystore1.jks

The above command creates the CSR in the file /root/example.org.csr with the RSA algorithm. Provide this file or its text content to the CA in order to be issued an SSL certificate.

Once the SSL is issued by the CA you have to import it in the same keystore with the same alias. Try to obtain the certificate in p7c binary format to ensure there are no compatibility issues when the time to import it comes. Most CAs offer this format.

Then run the command:
/usr/bin/keytool  -import-alias server -file /root/path_to_the_file/example.org.p7c
 
-keystore /var/local/keystore1.jks

To confirm the SSL has been properly imported list the available SSLs in your keystore with the command:
/usr/bin/keytoolkeytool -list -keystore /var/local/keystore1.jks

After you confirm the SSL is in the keystore, you can start using it such as for your Tomcat connectors. Here is an example configuration for a connector:

   
protocol="HTTP/1.1"
   
port="10443"maxThreads="400"
   
scheme="https"secure="true"SSLEnabled="true"keyAlias="server"
   
keystoreFile="/var/local/keystore1.jks"keystorePass="changeit"
   
clientAuth="false"sslProtocol="TLS"/>

The above configures a new http connector on TCP port 10443 with the key alias server and etc. If you don't specify explicitly keyAlias then the first certificate in your keystore will be used.
This is how easy and straight-forward configuring SSL for Tomcat is. SSL will not only help you improve the security for your Tomcat and your website but it will also help you with your page ranking and public trust.

How to monitor and troubleshoot a Linux server using sysdig

$
0
0
http://xmodulo.com/monitor-troubleshoot-linux-server-sysdig.html

What is the first thing that comes to mind when you need to track system calls made and received by a process? You'll probably think of strace, and you are right. What tool would you use to monitor raw network traffic from the command line? If you thought about tcpdump, you made an excellent choice again. And if you ever run into the need to having to keep track of open files (in the Unix sense of the word: everything is a file), chances are you'll use lsof.

strace, tcpdump, and lsof are indeed great utilities that should be part of every sysadmin's toolset, and that is precisely the reason why you will love sysdig, a powerful open source tool for system-level exploration and troubleshooting, introduced by its creators as "strace + tcpdump + lsof + awesome sauce with a little Lua cherry on top." Humor aside, one of the great features of sysdig resides in its ability not only to analyze the "live" state of a Linux system, but also to save the state in a dump file for offline inspection. What's more, you can customize sysdig's behavior or even enhance its capabilities by using built-in (or writing your own) small scripts called chisels. Individual chisels are used to analyze sysdig-captured event streams in various script-specific fashions.

In this tutorial we'll explore the installation and basic usage of sysdig to perform system monitoring and troubleshooting on Linux.

Installing Sysdig

For this tutorial, we will choose to use the automatic installation process described in the official website for the sake of simplicity, brevity, and distribution agnosticity. In the automatic process, the installation script automatically detects the operating system and installs all the necessary dependencies.

Run the following command as root to install sysdig from the official apt/yum repository:
# curl -s https://s3.amazonaws.com/download.draios.com/stable/install-sysdig | bash


Once the installation is complete, we can invoke sysdig as follows to get a feel for it:
# sysdig

Our screen will be immediately filled with all that is going on in our system, not allowing us to do much more with that information. For that reason, we will run:
# sysdig -cl | less
to see a list of available chisels.


The following categories are available by default, each of which is populated by multiple built-in chisels.
  • CPU Usage
  • Errors
  • I/O
  • Logs
  • Misc
  • Net
  • Performance
  • Security
  • System State
To display information (including detailed command-line usage) on a particular chisel, run:
# sysdig -cl [chisel_name]

For example, we can check information about spy_port chisel under "Net" category by running:
# sysdig -i spy_port

Chisels can be combined with filters (which can be applied to both live data or a trace file) to obtain more useful output.
Filters follow a "class.field" structure. For example:
  • fd.cip: client IP address.
  • evt.dir: event direction can be either '>' for enter events or '<' for exit events.
The complete filter list can be displayed with:
# sysdig -l

In the rest of the tutorial, I will demonstrate several use cases of sysdig.

Sysdig Example: Troubleshooting Server Performance

Suppose your server is experiencing performance issues (e.g., unresponsiveness or significant delays in responding). You can use the bottlenecks chisel to display a list of the 10 slowest systems calls at the moment.
Use the following command to check up on a live server in real time. The "-c" flag followed by a chisel name tells sysdig to run the specified chisel.
# sysdig -c bottlenecks
Alternatively, you can conduct a server performance analysis offline. In that case, you can save a complete sysdig trace to a file, and run the bottlenecks chisel against the trace as follows.
First, save a sysdig trace (use Ctrl+c to stop the collection):
# sysdig -w trace.scap
Once the trace is collected, you can check the slowest systems calls that were performed during the capture interval by running:
# sysdig -r trace.scap -c bottlenecks

You want to pay attention fo columns #2, #3, and #4, which indicate execution time, process name, and PID, respectively.

Sysdig Example: Monitoring Interactive User Activities

Suppose you as a sysadmin want to monitor interactive user activities in a system (e.g., what command a user typed from the command line, and what directories the user went to). That is when spy_user chisel comes in handy.
Let's first collect a sysdig trace with a couple of extra options.
# sysdig -s 4096 -z -w /mnt/sysdig/$(hostname).scap.gz
  • "-s 4096" tells sysdig to capture up to 4096 bytes of each event.
  • "-z" (used with "-w") enables compression for a trace file.
  • "-w " saves sysdig traces to a specified file.
In the above, we customize the name of the compressed trace file on a per-host basis. Remember that you can interrupt the execution of sysdig at any moment by pressing Ctrl + c.
Once we've collected a reasonable amount of data, we can view interactive activities of every user in a system by running:
# sysdig -r /mnt/sysdig/debian.scap.gz -c spy_users

The first column in the above output indicates the PID of the process associated with a given user's activity.
What if you want to target a specific user, and monitor the user's activities only? You can filter the results of the spy_users chisel by username:
# sysdig -r /mnt/sysdig/debian.scap.gz -c spy_users "user.name=xmodulo"

Sysdig Example: Monitoring File I/O

We can customize the output format of sysdig traces with "-p" flag, and indicate desired fields (e.g., user name, process name, and file or socket name) enclosed inside double quotes. In this example, we will create a trace file that will only contain writing events in home directories (which we can inspect later with "sysdig -r writetrace.scap.gz").
# sysdig -p "%user.name %proc.name %fd.name""evt.type=write and fd.name contains /home/" -z -w writetrace.scap.gz

Sysdig Example: Monitoring Network I/O

As part of server troubleshooting, you may want to snoop on network traffic, which is typically done with tcpdump. With sysdig, traffic sniffing can be done as easily, but in more user friendly fashions.
For example, you can inspect data (in ASCII) that has been exchanged with a particular IP address, served by a particular process (e.g., apache2):
# sysdig -s 4096 -A -c echo_fds fd.cip=192.168.0.100 -r /mnt/sysdig/debian.scap.gz proc.name=apache2
If you want to monitor raw data transfer (in binary) instead, replace "-A" with "-X":
# sysdig -s 4096 -X -c echo_fds fd.cip=192.168.0.100 -r /mnt/sysdig/debian.scap.gz proc.name=apache2
For more information, examples, and case studies, you can check out the project website. Believe me, the possibilities are limitless. But don't just take my word for it. Install sysdig and start digging today!

Nginx, SSL & php5-fpm on Debian Wheezy

$
0
0
http://www.iodigitalsec.com/nginx-ssl-php5-fpm-on-debian-wheezy

I decided to take a break from my love affair with Apache and set up a recent development project on Nginx. I’ve seen nothing but good things in terms of speed and performance from Nginx. I decided to set up a LEMP server (Linux, Nginx, MySQL, PHP), minus the MySQL as it’s already installed on my VM host server, and plus SSL. Here’s the full setup tutorial on Debian Wheezy:

Step #1 – Installing the packages

1
2
apt-get install nginx-extras mysql-client
apt-get install php5-fpm php5-gd php5-mysql php-apc php-pear php5-cli php5-common php5-curl php5-mcrypt php5-cgi php5-memcached
MySQL can be installed into the mix with a simple:
1
apt-get install mysql-server

Step #2 – Configure php5-fpm

Open /etc/php5/fpm/php.ini and set:
1
cgi.fix_pathinfo=0
Now edit /etc/php5/fpm/pool.d/www.conf and ensure that the listen directive is set as follows:
1
listen = /var/run/php5-fpm.sock
This is already the case on Debian Wheezy, however may be set to 127.0.0.1 or other values on other versions. Lastly, restart php5-fpm with:
1
/etc/init.d/php5-fpm restart

Step #3 – Configure Nginx and SSL

First, create a web content directory:
1
mkdir /var/www
Next, edit /etc/nginx/sites-available/default to set the first site’s configuration. The directives are reasonably self explanatory:
1
2
3
4
5
6
7
8
9
10
11
12
13
14
15
16
17
18
19
20
21
22
server {
        listen 80;
        root /var/www;
        index index.php index.html index.htm;
        server_name my.test.server.com;
        location / {
                try_files $uri $uri/ /index.html;
        }
        error_page 404 /404.html;
        error_page 500 502 503 504 /50x.html;
        location = /50x.html {
              root /var/www;
        }
        # pass the PHP scripts to FastCGI server listening on the php-fpm socket
        location ~ \.php$ {
                try_files $uri =404;
                fastcgi_pass unix:/var/run/php5-fpm.sock;
                fastcgi_index index.php;
                fastcgi_param SCRIPT_FILENAME $document_root$fastcgi_script_name;
                include fastcgi_params;
        }
}
I’ve extended this configuration to meet my requirements. My configuration is intended to:
  • Redirect all port HTTP requests to HTTPS
  • Serve HTTPS with a reasonable secure configuration and cipher suite
  • Enable the .php file extension, and pass PHP scripts to php5-fpm
1
2
3
4
5
6
7
8
9
10
11
12
13
14
15
16
17
18
19
20
21
22
23
24
25
26
27
28
29
30
31
32
33
34
35
36
server {
       listen         80;
       server_name    my.test.server.com;
       return         301 https://$server_name$request_uri;
}
 
# HTTPS server
server {
        listen 443;
        root /var/www;
        index index.php index.html index.htm;
        server_name my.test.server.com;
        location / {
                try_files $uri $uri/ /index.html;
        }
        error_page 404 /404.html;
        error_page 500 502 503 504 /50x.html;
        location = /50x.html {
              root /var/www;
        }
        # pass PHP to php5-fpm
        location ~ \.php$ {
                try_files $uri =404;
                fastcgi_pass unix:/var/run/php5-fpm.sock;
                fastcgi_index index.php;
                fastcgi_param SCRIPT_FILENAME $document_root$fastcgi_script_name;
                include fastcgi_params;
        }
        ssl on;
        ssl_certificate /etc/ssl/test.chain.crt;
        ssl_certificate_key /etc/ssl/test.key;
        ssl_session_timeout 5m;
        ssl_protocols TLSv1 TLSv1.1 TLSv1.2;
        ssl_ciphers 'ECDHE-RSA-AES128-GCM-SHA256:ECDHE-ECDSA-AES128-GCM-SHA256:ECDHE-RSA-AES256-GCM-SHA384:ECDHE-ECDSA-AES256-GCM-SHA384:kEDH+AESGCM:ECDHE-RSA-AES128-SHA256:ECDHE-ECDSA-AES128-SHA256:ECDHE-RSA-AES128-SHA:ECDHE-ECDSA-AES128-SHA:ECDHE-RSA-AES256-SHA384:ECDHE-ECDSA-AES256-SHA384:ECDHE-RSA-AES256-SHA:ECDHE-ECDSA-AES256-SHA:DHE-RSA-AES128-SHA256:DHE-RSA-AES128-SHA:DHE-RSA-AES256-SHA256:DHE-DSS-AES256-SHA:AES128-GCM-SHA256:AES256-GCM-SHA384:ECDHE-RSA-RC4-SHA:ECDHE-ECDSA-RC4-SHA:RC4-SHA:HIGH:!aNULL:!eNULL:!EXPORT:!DES:!3DES:!MD5:!PSK';
        ssl_prefer_server_ciphers on;
}
Now whereas Apache2 has a SSLCertificateChainFile directive for specifying a certificate chain, Nginx does not. In this case, the server certificate and any chained certificates are all placed into a single file, starting with my server certificate, and followed by two certificates in the chain:
1
2
3
4
5
6
7
8
9
10
11
12
-----BEGIN CERTIFICATE-----
MIIFejCCBGKgAwIBAgIQTHWks9xOahzb+5+AyIO3jjANBgkqhkiG9w0BAQsFADCB
(...)
-----END CERTIFICATE-----
-----BEGIN CERTIFICATE-----
MIIFdDCCBFygAwIBAgIQJ2buVutJ846r13Ci/ITeIjANBgkqhkiG9w0BAQwFADBv
(...)
-----END CERTIFICATE-----
-----BEGIN CERTIFICATE-----
MIIGCDCCA/CgAwIBAgIQKy5u6tl1NmwUim7bo3yMBzANBgkqhkiG9w0BAQwFADCB
(...)
-----END CERTIFICATE-----
An in depth SSL tester is provided by Qualys here: https://www.ssllabs.com/ssltest/
Now test the configuration and assuming no errors, restart Nginx:
1
2
/etc/init.d/nginx configtest
/etc/init.d/nginx restart

Lastly, test that PHP is functioning as expected by editing /var/www/index.php:
1
2
3
$a= 5; $b= 10;
echo"$a + $b = ". ($a+$b) . "
\n"
;
?>
Then access index.php. In my case, I’ve used curl to verify. If the code is interpreted and evaluated successfully, the output will show:
nginx-php-success
If PHP has not been installed correctly, the script may be delivered as-is:
nginx-php-fail
In this case, go back and verify the installation and configuration as above, ensuring that Nginx and php5-fpm were both restarted after configuration changes were made.

How to check hard disk health on Linux using smartmontools

$
0
0
http://xmodulo.com/check-hard-disk-health-linux-smartmontools.html

If there is something that you never want to happen on your Linux system, that is having hard drives die on you without any warning. Backups and storage technologies such as RAID can get you back on your feet in no time, but the cost associated with a sudden loss of a hardware device can take a considerable toll on your budget, especially if you haven't planned ahead of time what to do in such circumstances.
To avoid running into this kind of setbacks, you can try smartmontools which is a software package that manages and monitors storage hardware by using Self-Monitoring, Analysis and Reporting Technology (S.M.A.R.T. or just SMART). Most modern ATA/SATA, SCSI/SAS, and solid-state hard disks nowadays come with the SMART system built-in. The purpose of SMART is to monitor the reliability of the hard drive, to predict drive failures, and to carry out different types of drive self-tests. The smartmontools consists of two utility programs called smartctl and smartd. Together, they will provide advanced warnings of disk degradation and failure on Linux platforms.
This tutorial will provide installation and configuration guide for smartmontools on Linux.

Installing Smartmontools

Installation of smartmontools is straightforward as it available in base repositories of most Linux distros.

Debian and derivatives:

# aptitude install smartmontools

Red Hat-based distributions:

# yum install smartmontools

Checking Hard Drive Health with Smartctl

First off, list the hard drives connected to your system with the following command:
# ls -l /dev | grep -E 'sd|hd'
The output should be similar to:

where sdx indicate device names assigned to the hard drives installed on your machine.
To display information about a particular hard disk (e.g., device model, S/N, firmware version, size, ATA version/revision, availability and status of SMART capability), run smartctl with "--info" flag, and specify the hard drive's device name as follows.
In this example, we will choose /dev/sda.
# smartctl --info /dev/sda

Although the ATA version information may seem to go unnoticed at first, it is one of the most important factors when looking for a replacement part. Each ATA version is backward compatible with the previous versions. For example, older ATA-1 or ATA-2 devices work fine on ATA-6 and ATA-7 interfaces, but unfortunately, that is not true for the other way around. In cases where the device version and interface version don't match, they work together at the capabilities of the lesser of the two. That being said, an ATA-7 hard drive is the safest choice for a replacement part in this case.
You can examine the health status of a particular hard drive with:
# smartctl -s on -a /dev/sda
In this command, "-s on" flag enables SMART on the specified device. You can ommit it if SMART support is already enabled for /dev/sda.
The SMART information for a disk consists of several sections. Among other things, "READ SMART DATA" section shows the overall health status of the drive.
=== START OF READ SMART DATA SECTION ===
SMART overall-health self-assessment rest result: PASSED
The result of this test can be either PASSED or FAILED. In the latter case, a hardware failure is imminent, so you may want to start backing up your important data from that drive!
The next thing you will want to look at is the SMART attribute table, as shown below.

Basically, SMART attribute table lists values of a number of attributes defined for a particular drive by its manufacturer, as well as failure threshold for these attributes. This table is automatically populated and updated by drive firmware.
  • ID#: attribute ID, usually a decimal (or hex) number between 1 and 255.
  • ATTRIBUTE_NAME: attribute names defined by a drive manufacturer.
  • FLAG: attribute handling flag (we can ignore it).
  • VALUE: this is one of the most important information in the table, indicating a "normalized" value of a given attribute, whose range is between 1 and 253. 253 means the best condition, while 1 means the worse condition. Depending on attributes and manufacturers, an initial VALUE can be set to either 100 or 200.
  • WORST: the lowest VALUE ever recorded.
  • THRESH: the lowest value that WORST should ever be allowed to fall to, before reporting a given hard drive as FAILED.
  • TYPE: the type of attribute (either Pre-fail or Old_age). A Pre-fail attribute is considered a critical attribute; one that participates in the overall SMART health assessment (PASSED/FAILED) of the drive. If any Pre-fail attribute fails, then the drive is considered "about to fail." On the other hand, an Old_age attribute is considered (for SMART purposes) a non-critical attribute (e.g., normal wear and tear); one that does not fail the drive per se.
  • UPDATED: indicates how often an attribute is updated. Offline represents the case when offline tests are being performed on the drive.
  • WHEN_FAILED: this will be set to "FAILING_NOW" (if VALUE is less than or equal to THRESH), or "In_the_past" (if WORST is less than equal to THRESH), or "-" (if none of the above). In case of "FAILING_NOW", back up your important files ASAP, especially if the attribute is of TYPE Pre-fail. "In_the_past" means that the attribute has failed before, but that it's OK at the time of running the test. "-" indicates that this attribute has never failed.
  • RAW_VALUE: a manufacturer-defined raw value, from which VALUE is derived.
At this point you may be thinking, "Yes, smartctl seems like a nice tool. but I would like to avoid the hassle of having to run it manually." Wouldn't it be nice if it could be run at specified intervals, and at the same time inform me of the testsresults?
Fortunately, the answer is yes. And that's when smartd comes in.

Configuring Smartctl and Smartd for Live Monitoring

First, edit smartctl's configuration file (/etc/default/smartmontools) to tell it to start smartd at system startup, and to specify check intervals in seconds (e.g., 7200 = 2 hours).
1
2
start_smartd=yes
smartd_opts="--interval=7200"
Next, edit smartd's configuration file (/etc/smartd.conf) to add the followign line.
1
/dev/sda -m myemail@mydomain.com -M test
  • -m : specifies an email address to send test reports to. This can be a system user such as root, or an email address such as myemail@mydomain.com if the server is configured to relay emails to the outside of your system.
  • -M : specifies the desired type of delivery for an email report.
    • once: sends only one warning email for each type of disk problem detected.
    • daily: sends additional warning reminder emails, once per day, for each type of disk problem detected.
    • diminishing: sends additional warning reminder emails, after a one-day interval, then a two-day interval, then a four-day interval, and so on for each type of disk problem detected. Each interval is twice as long as the previous interval.
    • test: sends a single test email immediately upon smartd startup.
    • exec PATH: runs the executable PATH instead of the default mail command. PATH must point to an executable binary file or script. This allows to specify a desired action (beep the console, shutdown the system, and so on) when a problem is detected.
Save the changes and restart smartd.
You should expect this kind of email sent by smartd.

Luckily for us, no error was detected. Had it not been so, the errors would have appeared below the line "The following warning/error was logged by the smartd daemon."
Finally, you can schedule tests at your preferred schedule using the "-s" flag and the regular expression in the form of "T/MM/DD/d/HH", where:
T in the regular expression indicates the kind of test:
  • L: long test
  • S: short test
  • C: Conveyance test (ATA only)
  • O: Offline (ATA only)
and the remaining characters represent the date and time when the test should be performed:
  • MM is the month of the year.
  • DD is the day of the month.
  • HH is the hour of day.
  • d is the day of the week (ranging from 1=Monday through 7=Sunday).
  • MM, DD, and HH are expressed with two decimal digits.
A dot in any of these places indicates all possible values. An expression inside parentheses such as ‘(A|B|C)’ denotes any one of the three possibilities A, B, or C. An expression inside square brackets such as [1-5] denotes a range (1 through 5 inclusive).
For example, to perform a long test every business day at 1 pm for all disks, add the following line to /etc/smartd.conf. Make sure to restart smartd.
1
DEVICESCAN -s (L/../../[1-5]/13)

Conclusion

Whether you want to quickly check the electrical and mechanical performance of a disk, or perform a longer and more thorough test scans the entire disk surface, do not let yourself get so caught up in your day-to-day responsibilities as to forget to regularly check on the health of your disks. You will thank yourself later!

What is good reference management software on Linux

$
0
0
http://xmodulo.com/reference-management-software-linux.html

Have you ever written a paper so long that you thought you would never see the end of it? If so, you know that the worst part is not dedicating hours on it, but rather that once you are done, you still have to order and format your references into a structured convention-following bibliography. Hopefully for you, Linux has the solution: bibliography/reference management tools. Using the power of BibTex, these programs can help you import your citation sources, and spit out a structured bibliography. Here is a non-exhaustive list of open-source reference management software on Linux.

1. Zotero


Surely the most famous tool for collecting references, Zotero is known for being a browser extension. However, there also exists a convenient Linux stand alone program. Among its biggest advantages, Zotero is easy to use, and can be coupled with LibreOffice or other text editors to manage the bibliography of documents. I personally appreciate the interface and the plugin manager. However, Zotero is quickly limited if you have a lot of needs about your bibliography.

2. JabRef


JabRef is one of the most advanced tools out there for citation management. You can import from a plethora of format, lookup entries from external databases (like Google Scholar), and export straight to your favorite editor. JabRef integrates your environment nicely, and can even support plugins. And as a final touch, JabRef can connect to your own SQL database. The only downside to all of this is of course the learning curve.

3. KBibTex


For KDE adepts, the desktop environment has its own dedicated bibliography manager called KBibTex. And as you might expect from a program of this caliber, the promised quality is delivered. The software is highly customizable, from the shortcuts to the behavior and appearance. It is easy to find duplicates, to preview the results, and to export directly to a LaTeX editor. But the best feature in my opinion is the integration of Bibsonomy, Google Scholar, and even your Zotero account. The only downside is that the interface seems a bit cluttered at first. Hopefully spending enough time in the settings should fix that.

4. Bibfilex


Capable of running in both Gtk and Qt environment, Bibfilex is a user friendly bibliography management tool based on Biblatex. Less advanced than JabRef or KBibTex, it is fast and lightweight. Definitely a smart choice for making a bibliography quickly without thinking too much. The interface is slick and reflects just the necessary functions. I give it extra credits for the complete manual that you can get from the official download page

5. Pybliographer


As indicated by its name, Pybliographer is a non-graphical tool for bibliography management written in Python. I personally like to use Pybliographic as the graphical front-end. The interface is extremely clear and minimalist. If you just have a few references to export and don't really have time to learn how to use an extensive piece of software, Pybliographer is the place to go. A bit like Bibfilex, the intent is on user-friendliness and quick use.

6. Referencer


Probably my biggest surprise when doing this list, Referencer is really appealing to the eye. Capable of integrating itself perfectly with Gnome, it can find and import your documents, look up their reference on the web, and export to LyX, while being sexy and really well designed. The few shortcuts and plugins are a good bonus along with the library style interface.
To conclude, thanks to these tools, you will not have to worry about long papers anymore, or at least not about the reference section. What did we miss? Is there a bibliography management tool that you prefer? Let us know in the comments.

How to verify the authenticity and integrity of a downloaded file on Linux

$
0
0
http://xmodulo.com/verify-authenticity-integrity-downloaded-file.html

When you download a file (e.g., an installer, an ISO image, or a compressed archive) from the web, the file can be corrupted under a variety of error conditions, e.g., due to transmission errors on the wire, interrupted download, faulty storage hardware, file system errors, etc. Such failure cases aside, a file can also be deliberately tampered with by determined attackers during or before download. For example, an attacker with a compromised certificate authority could mount a man-in-the-middle (MITM) attack, tricking you into downloading a malware-ridden file from a bogus HTTPS website.
To protect yourself against these kinds of problems, it is often recommended that you verify the authenticity and integrity of a file when you download it from the web. Especially when you downloaded rather sensitive files (e.g., OS images, application binaries, executable installers, etc), blindly trusting downloaded files is not a good habit.
One quick and easy way to verify the integrity of a downloaded file is to use various checksum tools (e.g., md5sum, sha256sum, cksum) to compute and compare checksums (e.g., MD5, SHA or CRC). However, checksums are vulnerable to collision attacks, and also cannot be used to verify the authenticity (i.e., owner) of a file.
If you would like to verify both authenticity (owner) and integrity (content) of a downloaded file, you need to rely on cryptographic signatures instead. In this tutorial, I am going to describe how to check file authenticity and integrity by using GnuPG (GNU Privacy Guard).
In this example, I am going to verify a disk image file available for download from https://onionshare.org. In this website, the publisher offers their official public key, as well as its fingerprint for key verification purpose.

As for a file to download, the publisher offers its corresponding PGP signature as well.

Install GnuPG and Generate a Key Pair

Let's start by installing GnuPG on your Linux system.
On Debian, Ubuntu, and other Debian-derivatives:
$ sudo apt-get install gnupg
On Fedora, CentOS or RHEL:
$ sudo yum install gnupg
After installation, generate a key pair which you will be using in this tutorial.
$ gpg --gen-key

During key generation, you will be asked to provide your name and email address, as well as a passphrase to protect your private key. You can also choose when the key pair will expire (no expiration by default). Depending on keysize you choose (between 1024 to 4096 bits), the key generation process can take a couple of minutes or more, as it requires collecting a sufficient amount of random data, which come from your desktop activities (e.g., keyboard typing, mouse movement, disk access).
After key generation is finished, a public and a private key will be stored in ~/.gnupg directory for use.

Establish Trust with a File Owner

The first step in verifying a downloaded file is to establish trust with whoever is offering the file for download. For this purpose, we download the public key of a file owner, and verify that the owner of the public key is who he or she claims to be.
After downloading the public key of a file owner:
$ wget https://onionshare.org/signing-key.asc
go ahead and import the public key into your keyring with gpg command:
$ gpg --import signing-key.asc

Once the public key of the owner is imported, it will print out a key ID (e.g., "EBA34B1C") as shown above. Make a note of this key ID.
Now, check the fingerprint of the imported public key by running:
$ gpg --fingerprint EBA34B1C

You will see the fingerprint string of the key. Compare this string with the fingerprint displayed in the website. If they match, you may choose to trust the file owner's public key.
Once you decided to trust the public key, you can mark that so explicitly, by editing the key:
$ gpg --edit-key EBA34B1C
This command will show you GPG prompt:

Type "trust" at GPG prompt, which will allow you to choose the trust level of this key from 1 to 5.

In this case, I decided to assign trust "4". After that, sign it with your own private key by typing "sign", and then finalize by typing "save" at GPG prompt:

Note that this way of explicitly assigning a trust to a public key is not required, and implicit trust by simply importing the key is often sufficient.
The implication of assigning a "full" trust to the key is that if another key X is signed with this fully trusted key, the key X will be also considered valid by you. In general, key validation relies on a sophisticated mechanism known as "web of trust".
Coming back to the tutorial, now let's check a list of imported keys.
$ gpg --list-keys

You should see at least two keys: one key with depth 0 and ultimate trust ("1u"), which is your own key, and the other key with depth 1 and full trust ("1f"), which is the key signed by yourself earlier.

Verify the Authenticity/Integrity of a File

Once you have established a trust relationship with a file owner using his/her public key, we are now ready to verify the authenticity and integrity of a file that you downloaded from the owner.
In our example, the file owner publishes a file and a corresponding PGP signature (*.asc) separately. The role of the signature is to certify and put a timestamp on the file.
A typical signature (*.asc) looks like the following.
-----BEGIN PGP SIGNATURE-----

iQIcBAABCgAGBQJUJGhsAAoJEP1yCtnro0sc1jUP/ixNY/lKdrcMIAUoqlWKNE8f
sj4SFiwREMew76w66GASDF03fa5zPX6EsS2kucgx8ZsfEiSmN5T0y2P/aSaXwZqF
kywZVEzirKtca5AJ4DBzu6qrt9GgSw6JBJVv1oBJCMNyO+eAj341paR3MudvnyQz
H/N5tc4Qcilzy6M184opGIzy4ipEmMXfLHsd7WJpAyn+tO/z3uhh9NkNuygZpaFr
olpSWPE8revdDJyfMfSmb3ZrFmhLn7FCEltOi+a7SluvrMclizfnbec9rgLJtjo0
CPDZY7tsWmmL0DA3VvpMVqGvkg/Dyhpn2IIDrNaLAlvGQ5aovf+4tjad5IHvyaWx
4Gds93G6Hqvv5RwGx7OR3hgt2o0Y+qFsVDxVnPxerGhXeJXHzSDwLQMpdj9IoSU
Ae/53XXnxqSN6POZcwHiHvbsv0pdlg0Ea0dDAAN0ZeINNyZf1R0tLjWkcgpvGCtv
qkJuYFF9W9cWHraPY2ov5Hs/JZzPcG0eVpnDdzfOOH1gDKADq9A5D2X5QJCulsh9
WwU3X+E43OqIsoRzBucItD9HhZbEH7t8Q0xAqnAkgU3hriZp3dN4cnMfhM6I9hli
EmpSpLKCceMexu2o9QgzGXVm+AGZJe4QkuwAhRIccp5JDMVny61UlKTasjy6co8h
5GBhhYybPEFM+G1BODMd
=c9wo
-----END PGP SIGNATURE-----
Let's download both the file and its signature:
$ wget https://onionshare.org/files/0.6/OnionShare.dmg
$ wget https://onionshare.org/files/0.6/OnionShare.dmg.asc
Now verify the PGP signature of the downloaded file.
$ gpg --verify OnionShare.dmg.asc OnionShare.dmg

If the output of the command contains "Good signature from ", the downloaded .dmg file has been successfully authenticated and verified. If the downloaded file were tampered with in any way after the signature has been generated, the verification would fail.
At this point you can be rest assured and trust the downloaded file.

How to create and use Python CGI scripts

$
0
0
http://xmodulo.com/create-use-python-cgi-scripts.html

Have you ever wanted to create a webpage or process user input from a web-based form using Python? These tasks can be accomplished through the use of Python CGI (Common Gateway Interface) scripts with an Apache web server. CGI scripts are called by a web server when a user requests a particular URL or interacts with the webpage (such as clicking a "Submit" button). After the CGI script is called and finishes executing, the output is used by the web server to create a webpage displayed to the user.

Configuring the Apache web server to run CGI scripts

In this tutorial we assume that an Apache web server is already set up and running. This tutorial uses an Apache web server (version 2.2.15 on CentOS release 6.5) that is hosted at the localhost (127.0.0.1) and is listening on port 80, as specified by the following Apache directives:
1
2
ServerName 127.0.0.1:80
Listen 80
HTML files used in the upcoming examples are located in /var/www/html on the web server. This is specified via the DocumentRoot directive (specifies the directory that webpages are located in):
1
DocumentRoot "/var/www/html"
Consider a request for the URL: http://localhost/page1.html
This will return the contents of the following file on the web server:
/var/www/html/page1.html
To enable use of CGI scripts, we must specify where CGI scripts are located on the web server. To do this, we use the ScriptAlias directive:
1
ScriptAlias /cgi-bin/ "/var/www/cgi-bin/"
The above directive indicates that CGI scripts are contained in the /var/www/cgi-bin directory on the web server and that inclusion of /cgi-bin/ in the requested URL will search this directory for the CGI script of interest.
We must also explicitly permit the execution of CGI scripts in the /var/www/cgi-bin directory and specify the file extensions of CGI scripts. To do this, we use the following directives:
1
2
3
4
    Options +ExecCGI
    AddHandler cgi-script .py
Consider a request for the URL: http://localhost/cgi-bin/myscript-1.py
This will call the following script on the web server:
/var/www/cgi-bin/myscript-1.py

Creating a CGI script

Before creating a Python CGI script, you will need to confirm that you have Python installed (this is generally installed by default, however the installed version may vary). Scripts in this tutorial are created using Python version 2.6.6. You can check your version of Python from the command line by entering either of the following commands (the -V and --version options display the version of Python that is installed):
$ python -V
$ python --version
If your Python CGI script will be used to process user-entered data (from a web-based input form), then you will need to import the Python cgi module. This module provides functionality for accessing data that users have entered into web-based input forms. You can import this module via the following statement in your script:
1
import cgi
You must also change the execute permissions for the Python CGI script so that it can be called by the web server. Add execute permissions for others via the following command:
# chmod o+x myscript-1.py

Python CGI Examples

Two scenarios involving Python CGI scripts will be considered in this tutorial:
  1. Create a webpage using a Python script
  2. Read and display user-entered data and display results in a webpage
Note that the Python cgi module is required for Scenario 2 because this involves accessing user-entered data from web-based input forms.

Example 1: Create a webpage using a Python script

For this scenario, we will start by creating a webpage /var/www/html/page1.html with a single submit button:
1
2
3
4
5
6
<html>
<h1>Test Page 1</h1>
<formname="input"action="/cgi-bin/myscript-1.py"method="get">
<inputtype="submit"value="Submit">
</form>
</html>
When the "Submit" button is clicked, the /var/www/cgi-bin/myscript-1.py script is called (specified by the action parameter). A "GET" request is specified by setting the method parameter equal to "get". This requests that the web server return the specified webpage. An image of /var/www/html/page1.html as viewed from within a web browser is shown below:

The contents of /var/www/cgi-bin/myscript-1.py are:
1
2
3
4
5
6
7
#!/usr/bin/python
print"Content-Type: text/html"
print""
print""
print"

CGI Script Output

"
print"This page was generated by a Python CGI script.
"
print"
" The first statement indicates that this is a Python script to be run with the /usr/bin/python command. The print "Content-Type: text/html" statement is required so that the web server knows what type of output it is receiving from the CGI script. The remaining statements are used to print the text of the webpage in HTML format.
When the "Submit" button is clicked in the above webpage, the following webpage is returned:

The take-home point with this example is that you have the freedom to decide what information is returned by the CGI script. This could include the contents of log files, a list of users currently logged on, or today's date. The possibilities are endless given that you have the entire Python library at your disposal.

Example 2: Read and display user-entered data and display results in a webpage

For this scenario, we will start by creating a webpage /var/www/html/page2.html with three input fields and a submit button:
1
2
3
4
5
6
7
8
9
<html>
<h1>Test Page 2</h1>
<formname="input"action="/cgi-bin/myscript-2.py"method="get">
First Name: <inputtype="text"name="firstName"><br>
Last Name: <inputtype="text"name="lastName"><br>
Position: <inputtype="text"name="position"><br>
<inputtype="submit"value="Submit">
</form>
</html>
When the "Submit" button is clicked, the /var/www/cgi-bin/myscript-2.py script is called (specified by the action parameter). An image of /var/www/html/page2.html as viewed from within a web browser is shown below (note that the three input fields have already been filled in):

The contents of /var/www/cgi-bin/myscript-2.py are:
1
2
3
4
5
6
7
8
9
10
11
12
13
14
#!/usr/bin/python
importcgi
form =cgi.FieldStorage()
print"Content-Type: text/html"
print""
print""
print"

CGI Script Output

"
print""
print"The user entered data are:
"
print"First Name:"+form["firstName"].value +"
"
print"Last Name:"+form["lastName"].value +"
"
print"Position:"+form["position"].value +"
"
print"
"
print"
" As mentioned previously, the import cgi statement is needed to enable functionality for accessing user-entered data from web-based input forms. The web-based input form is encapsulated in the form object, which is a cgi.FieldStorage object. Once again, the "Content-Type: text/html" line is required so that the web server knows what type of output it is receiving from the CGI script. The data entered by the user are accessed in the statements that contain form["firstName"].value, form["lastName"].value, and form["position"].value. The names in the square brackets correspond to the values of the name parameters defined in the text input fields in /var/www/html/page2.html.
When the "Submit" button is clicked in the above webpage, the following webpage is returned:

The take-home point with this example is that you can easily read and display user-entered data from web-based input forms. In addition to processing data as strings, you can also use Python to convert user-entered data to numbers that can be used in numerical calculations.

Summary

This tutorial demonstrates how Python CGI scripts are useful for creating webpages and for processing user-entered data from web-based input forms. More information about Apache CGI scripts can be found here and more information about the Python cgi module can be found here.

How to monitor a log file on Linux with logwatch

$
0
0
http://xmodulo.com/monitor-log-file-linux-logwatch.html

Linux operating system and many applications create special files commonly referred to as "logs" to record their operational events. These system logs or application-specific log files are an essential tool when it comes to understanding and troubleshooting the behavior of the operating system and third-party applications. However, log files are not precisely what you would call "light" or "easy" reading, and analyzing raw log files by hand is often time-consuming and tedious. For that reason, any utility that can convert raw log files into a more user-friendly log digest is a great boon for sysadmins.
logwatch is an open-source log parser and analyzer written in Perl, which can parse and convert raw log files into a structured format, making a customizable report based on your use cases and requirements. In logwatch, the focus is on producing more easily consumable log summary, not on real-time log processing and monitoring. As such, logwatch is typically invoked as an automated cron task with desired time and frequency, or manually from the command line whenever log processing is needed. Once a log report is generated, logwatch can email the report to you, save it to a file, or display it on the screen.
A logwatch report is fully customizable in terms of verbosity and processing coverage. The log processing engine of logwatch is extensible, in a sense that if you want to enable logwatch for a new application, you can write a log processing script (in Perl) for the application's log file, and plug it under logwatch.
One downside of logwatch is that it does not include in its report detailed timestamp information available in original log files. You will only know that a particular event was logged in a requested range of time, and you will have to access original log files to get exact timing information.

Installing Logwatch

On Debian and derivatives:
# aptitude install logwatch
On Red Hat-based distributions:
# yum install logwatch

Configuring Logwatch

During installation, the main configuration file (logwatch.conf) is placed in /etc/logwatch/conf. Configuration options defined in this file override system-wide settings defined in /usr/share/logwatch/default.conf/logwatch.conf.
If logwatch is launched from the command line without any arguments, the custom options defined in /etc/logwatch/conf/logwatch.conf will be used. However, if any command-line arguments are specified with logwatch command, those arguments in turn override any default/custom settings in /etc/logwatch/conf/logwatch.conf.
In this article, we will customize several default settings of logwatch by editing /etc/logwatch/conf/logwatch.conf file.
1
Detail =
"Detail" directive controls the verbosity of a logwatch report. It can be a positive integer, or High, Med, Low, which correspond to 10, 5, and 0, respectively.
1
MailTo = youremailaddress@yourdomain.com
"MailTo" directive is used if you want to have a logwatch report emailed to you. To send a logwatch report to multiple recipients, you can specify their email addresses separated with a space. To be able to use this directive, however, you will need to configure a local mail transfer agent (MTA) such as sendmail or Postfix on the server where logwatch is running.
1
Range =
"Range" directive specifies the time duration of a logwatch report. Common values for this directive are Yesterday, Today or All. When "Range = All" is used, "Archive = yes" directive is also needed, so that all archived versions of a given log file (e.g., /var/log/maillog, /var/log/maillog.X, or /var/log/maillog.X.gz) are processed.
Besides such common range values, you can also use more complex range options such as the following.
  • Range = "2 hours ago for that hour"
  • Range = "-5 days"
  • Range = "between -7 days and -3 days"
  • Range = "since September 15, 2014"
  • Range = "first Friday in October"
  • Range = "2014/10/15 12:50:15 for that second"
To be able to use such free-form range examples, you need to install Date::Manip Perl module from CPAN. Refer to this post for CPAN module installation instructions.
1
2
3
Service =
Service =
. . .
"Service" option specifies one or more services to monitor using logwath. All available services are listed in /usr/share/logwatch/scripts/services, which cover essential system services (e.g., pam, secure, iptables, syslogd), as well as popular application services such as sudo, sshd, http, fail2ban, samba. If you want to add a new service to the list, you will have to write a corresponding log processing Perl script, and place it in this directory.
If this option is used to select specific services, you need to comment out the line "Service = All" in /usr/share/logwatch/default.conf/logwatch.conf.

1
Format =
"Format" directive specifies the format (e.g., text or HTML) of a logwatch report.
1
Output =
"Output" directive indicates where a logwatch report should be sent. It can be saved to a file (file), emailed (mail), or shown to screen (stdout).

Analyzing Log Files with Logwatch

To understand how to analyze log files using logwatch, consider the following logwatch.conf example:
1
2
3
4
5
6
7
8
Detail = High
MailTo = youremailaddress@yourdomain.com
Range = Today
Service = http
Service = postfix
Service = zz-disk_space
Format = html
Output = mail
Under these settings, logwatch will process log files generated by three services (http, postfix and zz-disk_space) today, produce an HTML report with high verbosity, and email it to you.
If you do not want to customize /etc/logwatch/conf/logwatch.conf, you can leave the default configuration file unchanged, and instead run logwatch from the command line as follows. It will achieve the same outcome.
# logwatch --detail 10 --mailto youremailaddress@yourdomain.com --range today --service http --service postfix --service zz-disk_space --format html --output mail
The emailed report looks like the following.

The email header includes links to navigate the report sections, one per each selected service, and also "Back to top" links.
You will want to use the email report option when the list of recipients is small. Otherwise, you can have logwatch save a generated HTML report within a network share that can be accessed by all the individuals who need to see the report. To do so, make the following modifications in our previous example:
1
2
3
4
5
6
7
8
Detail = High
Range = Today
Service = http
Service = postfix
Service = zz-disk_space
Format = html
Output = file
Filename = /var/www/html/logs/dev1.html
Equivalently, run logwatch from the command line as follows.
# logwatch --detail 10 --range today --service http --service postfix --service zz-disk_space --format html --output file --filename /var/www/html/logs/dev1.html
Finally, let's configure logwatch to be executed by cron on your desired schedules. The following example will run a logwatchcron job every business day at 12:15 pm:
# crontab -e
15 12 * * 1,2,3,4,5 /sbin/logwatch
Hope this helps. Feel free to comment to share your own tips and ideas with the community!


What is a good command-line calculator on Linux

$
0
0
http://xmodulo.com/command-line-calculator-linux.html

Every modern Linux desktop distribution comes with a default GUI-based calculator app. On the other hand, if your workspace is full of terminal windows, and you would rather crunch some numbers within one of those terminals quickly, you are probably looking for a command-line calculator. In this category, GNU bc (short for "basic calculator") is a hard to beat one. While there are many command-line calculators available on Linux, I think GNU bc is hands-down the most powerful and useful.
Predating the GNU era, bc is actually a historically famous arbitrary precision calculator language, with its first implementation dating back to the old Unix days in 1970s. Initially bc was a better known as a programming language whose syntax is similar to C language. Over time the original bc evolved into POSIX bc, and then finally GNU bc of today.

Features of GNU bc

Today's GNU bc is a result of many enhancements of earlier implementations of bc, and now it comes standard on all major GNU/Linux distros. It supports standard arithmetic operators with arbitrary precision numbers, and multiple numeric base (e.g., binary, decimal hexadecimal) of input and output.
If you are familiar with C language, you will see that the same or similar mathematical operators are used in bc. Some of supported operators include arithmetic (+,-,*,/,%,++,--), comparison (<,>,==,!=,<=,>=), logical (!,&&,||), bitwise (&,|,^,~,<<,>>), compound assignment (+=,-=,*=,/=,%=,&=,|=,^=,&&=,||=,<<=,>>=) operators. bc comes with many useful built-in functions such as square root, sine, cosine, arctangent, natural logarithm, exponential, etc.

How to Use GNU bc

As a command-line calculator, possible use cases of GNU bc are virtually limitless. In this tutorial, I am going to describe a few popular features of bc command. For a complete manual, refer to the official source.
Unless you have a pre-written bc script, you typically run bc in interactive mode, where any typed statement or expression terminated with a newline is interpreted and executed on the spot. Simply type the following to enter an interactive bc session. To quit a session, type 'quit' and press Enter.
$ bc

The examples presented in the rest of the tutorial are supposed to be typed inside a bc session.

Type expressions

To calculate an arithmatic expression, simply type the expression at the blinking cursor, and press Enter. If you want, you can store an intermediate result to a variable, then access the variable in other expressions.

Within a given session, bc maintains a unlimited history of previously typed lines. Simply use UP arrow key to retrieve previously typed lines. If you want to limit the number of lines to keep in the history, assign that number to a special variable named history. By default the variable is set to -1, meaning "unlimited."

Switch input/output base

Often times you want to type input expressions and display results in binary or hexadecimal formats. For that, bc allows you switch the numeric base of input or output numbers. Input and output bases are stored in ibase and obase, respectively. The default value of these special variables is 10, and valid values are 2 through 16 (or the value of BC_BASE_MAX environment variable in case of obase). To switch numeric base, all you have to do is to change the values of ibase and obase. For example, here are examples of summing up two hexadecimal/binary numbers:

Note that I specify obase=16 before ibase=16, not vice versa. That is because if I specified ibase=16 first, the subsequent obase=16 statement would be interpreted as assigning 16 in base 16 to obase (i.e., 22 in decimal), which is not what we want.

Adjust precision

In bc, the precision of numbers is stored in a special variable named scale. This variable represents the number of decimal digits after the decimal point. By default, scale is set to 0, which means that all numbers and results and truncated/stored in integers. To adjust the default precision, all you have to do is to change the value of scale variable.
scale=4

Use built-in functions

Beyond simple arithmatic operations, GNU bc offers a wide range of advanced mathematical functions built-in, via an external math library. To use those functions, launch bc with "-l" option from the command line.
Some of these built-in functions are illustrated here.
Square root of N:
sqrt(N)
Sine of X (X is in radians):
s(X)
Cosine of X (X is in radian):
c(X)
Arctangent of X (The returned value is in radian):
a(X)
Natural logarithm of X:
l(X)
Exponential function of X:
e(X)

Other goodies as a language

As a full-blow calculator language, GNU bc supports simple statements (e.g., variable assignment, break, return), compound statements (e.g., if, while, for loop), and custom function definitions. I am not going to cover the details of these features, but you can easily learn how to use them from the official manual. Here is a very simple function definition example:
define dummy(x){
return(x * x);
}
dummy(9)
81
dummy(4)
16

Use GNU bc Non-interactively

So far we have used bc within an interactive session. However, quite popular use cases of bc in fact involve running bc within a shell script non-interactively. In this case, you can send input to bc using echo through a pipe. For example:
$ echo "40*5" | bc
$ echo "scale=4; 10/3" | bc
$ echo "obase=16; ibase=2; 11101101101100010" | bc

To conclude, GNU bc is a powerful and versatile command-line calculator that really lives up to your expectation. Preloaded on all modern Linux distributions, bc can make your number crunching tasks much easy to handle without leaving your terminals. For that, GNU bc should definitely be in your productivity toolset.

Programming by Voice: Staying Productive without Harming Yourself

$
0
0
http://www.extrahop.com/post/blog/programming-by-voice-staying-productive-without-harming-yourself

One of the reasons I love working at ExtraHop is the lack of meetings and abundance of uninterrupted development time. However, I quickly found after starting that I was unaccustomed to coding for such long periods. A few weeks after I started at ExtraHop, I began to develop discomfort in my wrists and forearms. I have had intermittent trouble with this in the past, but limiting my computer usage at home in the evenings had always been enough to previously solve it. This time, however, was different.
As a very recent college graduate, I was concerned that my daily work activities could be causing permanent injury. I started looking into ergonomic keyboards and mice, hoping to find a cure-all solution. As you might have guessed, I did not find a magical solution, and my situation worsened with each passing week.
While the discomfort was frustrating, I was much more concerned that the injury was preventing me from being able to quickly and easily create and communicate at work and at home.

An Introduction to a Solution

After trying and abandoning several other solutions, a coworker of mine at ExtraHop showed me a PyCon talk by Tavis Rudd, a developer who programs by using his voice. At first, I was skeptical that this solution would be reliable and productive. However, after watching the video, I was convinced that voice input was a compelling option for programmers. Rudd suffered from a similar injury, and he had gone through all of the same investigations that I had, finally determining that a fancy keyboard wasn’t enough to fix it.
That night, I scoured the Internet for people who programmed by voice, looking for tips or tutorials. They were few and far between, and many people claimed that it was impossible. Not easily deterred, I started to piece together a toolkit that would allow me to program by voice on a Linux machine.

Configuration: The Hard Part

It was immediately clear that Dragon NaturallySpeaking was the only option for dictation software. Their product was miles ahead of others in voice recognition, but it only ran on Windows or Mac. Unfortunately I was never successful running Dragon NaturallySpeaking in Wine and had to settle for running in a Windows VM and proxying the commands to the Linux host.
I will leave out some of the configuration steps that I went through in this post. You can find detailed instructions on how to get everything up and running on my GitHub repo.
If you are following along with the instructions, you should now be able to send dictation and the example command to your Linux host, but that will not get you very far with programming. I ended up spending most of the next two weeks writing grammars. The majority of the process was:
  1. Attempt to perform a task (programming, switching windows, etc).
  2. Write a command that would let me do this by voice.
  3. Test that command and add related commands.
  4. Repeat.
The process was slow going, I am hopeful that the repository I linked will help you avoid starting from scratch. Even after using this for about a month, I am still tweaking my commands a couple times a day. Tavis Rudd claims to have over 2000 custom commands, which means that I must still have a long way to go.

The Results

Like Rudd explained in his talk, the microphone is a critical link in this setup. A good microphone that hears only you will make a big difference in both accuracy and speed of recognition. I really like the Yeti from Blue that I am using, but I can generally only use it if the office is mostly quiet.
With the commands I have created so far, I can switch between windows, navigate the web (with the help of Vimium), switch between workspaces, and, most importantly, I can program in Python and Go with decent speed. It is not quite as fast as programming with a keyboard, but it is surprisingly efficient once you learn the commands.
The grammars I have shared in the above GitHub repository are specific to what I need in my workflow. I recommend that you use them as a starting point, while keeping in mind that the computer may recognize words differently for you than it does for me. These grammars are also specific to the languages I use most often. Please don’t hesitate to write ones for your favorite languages. And finally, look for my .vimrc file in my dotfiles repository to find the custom shortcuts that the voice commands trigger.
Coding by voice is not perfect, but it has reached a point where it is a practical option. Don’t continue suffering through wrist and arm discomfort when there is an alternative. Feel free to send me a pull request and we can continue making voice programming better for everyone.

SUSE Linux – Zypper Command Examples

$
0
0
http://www.linuxtechi.com/suse-linux-zypper-command-examples

Zypper is command line interface in SuSE Linux which is used to  install, update, remove software, manage repositories, perform various queries, and lot more. In this article we will discuss different examples of zypper command .
Syntax :
# zypper [--global-opts]  [--command-opts] [command-arguments]
The components mentioned in brackets are not required. The simplest way to execute zypper is to type its name followed by the command.

Example:1 List the available global options & commands.

Open the Terminal , type the Zypper command and press enter , it will display all the global options and command that can be used within zypper.
linux-xa3t:~ # zypper

Examples:2 Getting help for Specific zypper Command.

Syntax : zypper help [command]
linux-xa3t:~ # zypper help remove
remove (rm) [options] ...

Remove packages with specified capabilities.
A capability is NAME[.ARCH][OP], where OP is one of <, <=, =, >=, >.

Command options:
-r, --repo Load only the specified repository.
-t, --type Type of package (package, patch, pattern, product).

Default: package.
-n, --name Select packages by plain name, not by capability.
-C, --capability Select packages by capability.
--debug-solver Create solver test case for debugging.
-R, --no-force-resolution Do not force the solver to find solution,let it ask.
--force-resolution Force the solver to find a solution (even an aggressive one).
-u, --clean-deps Automatically remove unneeded dependencies.
-U, --no-clean-deps No automatic removal of unneeded dependencies.
-D, --dry-run Test the removal, do not actually remove.

Example:3 Open Zypper Shell or session

linux-xa3t:~ # zypper sh
zypper>

or

linux-xa3t:~ # zypper shell
zypper>

Example:4 Listing defined Repositories

linux-xa3t:~ # zypper repos
zypper-repos
or
linux-xa3t:~ # zypper lr

4.1) List Repos URI in Table.

zypper-repos-uri

4.2) List Repos by priority

linux-xa3t:~ # zypper lr -p
zypper-repos-priority

Example:5 Refreshing Repositories.

linux-xa3t:~ # zypper ref
Repository 'openSUSE-13.1-Non-Oss' is up to date.
Repository 'openSUSE-13.1-Oss' is up to date.
Repository 'openSUSE-13.1-Update' is up to date.
Repository 'openSUSE-13.1-Update-Non-Oss' is up to date.
All repositories have been refreshed.

Example:6 Modifying Zypper Repositories

zypper repositories can be modified by alias, number, or URI, or by the ‘–all, –remote, –local, –medium-type’ aggregate options.
linux-xa3t:~ # zypper mr -d 6                 #disable repo #6
linux-xa3t:~ # zypper mr -rk -p 70 upd #enable autorefresh and rpm files ‘caching’ for ‘upd’ repo and set its priority to 70
linux-xa3t:~ # zypper mr -Ka               #disable rpm files caching for all repos
linux-xa3t:~ # zypper mr -kt               #enable rpm files caching for remote repos

Example:7 Adding Repository

Syntax : zypper addrepo OR zypper ar
linux-xa3t:~ # zypper ar http://download.opensuse.org/update/13.1/ update
Adding repository 'update' .............................................[done]
Repository 'update' successfully added
Enabled: Yes
Autorefresh: No
GPG check: Yes
URI: http://download.opensuse.org/update/13.1/

Example:8 Removing Repository

Syntax : zypper removerepo
OR
zypper rr
linux-xa3t:~ # zypper rr openSUSE-13.1-1.10 openSUSE-13.1-1.10
Removing repository 'openSUSE-13.1-1.10' ............................[done]
Repository 'openSUSE-13.1-1.10' has been removed.

Example:9 Installing Package

syntax : zypper install   OR  zypper in
linux-xa3t:~ # zypper install vlc

Example:10 Removing a Package

Syntax : zypper remove OR zypper rm
linux-xa3t:~ # zypper remove sqlite

Example:11 Exporting & importing Repository

Syntax of Exporting Repos : zypper repos –export or zypper lr -e
linux-xa3t:~ # zypper lr --export repo-backup/back.repo
Repositories have been successfully exported to repo-backup/back.repo.
Syntax of Importing Repos :
linux-xa3t:~ # zypper ar repo-backup/back.repo

Example:12 Updating a package

Syntax : zypper update OR zypper up
linux-xa3t:~ # zypper update bash

Example:13 Install source Package

Syntax : zypper source-install OR zypper si
linux-xa3t:~ # zypper source-install zypper

Example:14 Install only Build Dependency.

command in example:13 will install & build dependencies of the specified package. If you want to install source package then use, the option -D.
# zypper source-install -D package_name
To install only the build dependencies use -d.
# zypper source-install -d package_name

What are useful Bash aliases and functions

$
0
0
http://xmodulo.com/useful-bash-aliases-functions.html

As a command line adventurer, you probably found yourself repeating the same lengthy commands over and over. If you always ssh into the same machine, if you always chain the same commands together, or if you constantly run a program with the same flags, you might want to save the precious seconds of your life that you spend repeating the same actions over and over.

The solution to achieve that is to use an alias. As you may know, an alias is a way to tell your shell to remember a particular command and give it a new name: an alias. However, an alias is quickly limited as it is just a shortcut for a shell command, without the ability to pass or control the arguments. So to complement, bash also allows you create your own functions, which can be more lengthy and complex, and also accepts any number of arguments.

Naturally, like with soup, when you have a good recipe you share it. So here is a list with some of the most useful bash aliases and functions. Note that "most useful" is loosely defined, and of course the usefulness of an alias is dependent on your everyday usage of the shell.

Before you start experimenting with aliases, here is a handy tip: if you give an alias the same name as a regular command, you can choose to launch the original command and ignore the alias with the trick:
\command

For example, the first alias below replaces the ls command. If you wish to use the regular ls command and not the alias, call it via:
\ls

Productivity

So these aliases are really simple and really short, but they are mostly based on the idea that if you save yourself a fraction of a second every time, it might end up accumulating years at the end. Or maybe not.
alias ls="ls --color=auto"
Simple but vital. Make the ls command output in color.
alias ll = "ls --color -al"
Shortcut to display in color all the files from a directory in a list format.
alias grep='grep --color=auto'
Similarly, put some color in the grep output.
mcd() { mkdir -p "$1"; cd "$1";} 
One of my favorite. Make a directory and cd into it in one command: mcd [name].
cls() { cd "$1"; ls;}
Similar to the previous function, cd into a directory and list its content: cls [name].
backup() { cp "$1"{,.bak};}
Simple way to make a backup of a file: backup [file] will create [file].bak in the same directory.
md5check() { md5sum "$1" | grep "$2";}
Because I hate comparing the md5sum of a file by hand, this function computes it and compares it using grep: md5check [file] [key].

alias makescript="fc -rnl | head -1 >"
Easily make a script out of the last command you ran: makescript [script.sh]
alias genpasswd="strings /dev/urandom | grep -o '[[:alnum:]]' | head -n 30 | tr -d '\n'; echo"
Just to generate a strong password instantly.

alias c="clear"
Cannot do simpler to clean your terminal screen.
alias histg="history | grep"
To quickly search through your command history: histg [keyword]
alias ..='cd ..'
No need to write cd to go up a directory.
alias ...='cd ../..'
Similarly, go up two directories.
extract() { 
if [ -f $1 ] ; then
case $1 in
*.tar.bz2) tar xjf $1 ;;
*.tar.gz) tar xzf $1 ;;
*.bz2) bunzip2 $1 ;;
*.rar) unrar e $1 ;;
*.gz) gunzip $1 ;;
*.tar) tar xf $1 ;;
*.tbz2) tar xjf $1 ;;
*.tgz) tar xzf $1 ;;
*.zip) unzip $1 ;;
*.Z) uncompress $1 ;;
*.7z) 7z x $1 ;;
*) echo "'$1' cannot be extracted via extract()" ;;
esac
else
echo "'$1' is not a valid file"
fi
}
Longest but also the most useful. Extract any kind of archive: extract [archive file]

System Info

Want to know everything about your system as quickly as possible?
alias cmount="mount | column -t"
Format the output of mount into columns.

alias tree="ls -R | grep ":$" | sed -e 's/:$//' -e 's/[^-][^\/]*\//--/g' -e 's/^/   /' -e 's/-/|/'"
Display the directory structure recursively in a tree format.
sbs() { du -b --max-depth 1 | sort -nr | perl -pe 's{([0-9]+)}{sprintf "%.1f%s", $1>=2**30? ($1/2**30, "G"): $1>=2**20? ($1/2**20, "M"): $1>=2**10? ($1/2**10, "K"): ($1, "")}e';} 
"Sort by size" to display in list the files in the current directory, sorted by their size on disk.
alias intercept="sudo strace -ff -e trace=write -e write=1,2 -p"
Intercept the stdout and stderr of a process: intercept [some PID]. Note that you will need strace installed.
alias meminfo='free -m -l -t'
See how much memory you have left.

alias ps? = "ps aux | grep"
Easily find the PID of any process: ps? [name]
alias volume="amixer get Master | sed '1,4 d' | cut -d [ -f 2 | cut -d ] -f 1"
Displays the current sound volume.

Networking

For all the commands that involve the Internet or your local network, there are fancy aliases for them.
alias websiteget="wget --random-wait -r -p -e robots=off -U mozilla"
Download entirely a website: websiteget [URL]
alias listen="lsof -P -i -n"
Show which applications are connecting to the network.

alias port='netstat -tulanp'
Show the active ports
gmail() { curl -u "$1" --silent "https://mail.google.com/mail/feed/atom" | sed -e 's/<\/fullcount.*/\n/' | sed -e 's/.*fullcount>//'}
Rough function to display the number of unread emails in your gmail: gmail [user name]
alias ipinfo="curl ifconfig.me && curl ifconfig.me/host"
Get your public IP address and host.
getlocation() { lynx -dump http://www.ip-adress.com/ip_tracer/?QRY=$1|grep address|egrep 'city|state|country'|awk '{print $3,$4,$5,$6,$7,$8}'|sed 's\ip address flag \\'|sed 's\My\\';} 
Returns your current location based on your IP address.

Useless

So what if some aliases are not all that productive? They can still be fun.
kernelgraph() { lsmod | perl -e 'print "digraph \"lsmod\" {";<>;while(<>){@_=split/\s+/; print "\"$_[0]\" -> \"$_\"\n" for split/,/,$_[3]}print "}"' | dot -Tpng | display -;}
To draw the kernel module dependency graph. Requires image viewer.
alias busy="cat /dev/urandom | hexdump -C | grep "ca fe""
Make you look all busy and fancy in the eyes of non-technical people.

To conclude, a good chunk of these aliases and functions come from my personal .bashrc, and the awesome websites alias.sh and commandlinefu.com which I already presented in my post on the best online tools for Linux. So definitely go check them out, make your own recipes, and if you are so inclined, share your wisdom in the comments.
As a bonus, here is the plain text version of all the aliases and functions I mentioned, ready to be copy pasted in your bashrc.
1
2
3
4
5
6
7
8
9
10
11
12
13
14
15
16
17
18
19
20
21
22
23
24
25
26
27
28
29
30
31
32
33
34
35
36
37
38
39
40
41
42
43
44
45
46
47
48
49
50
51
52
53
54
55
#Productivity
alias ls="ls --color=auto"
alias ll="ls --color -al"
alias grep='grep --color=auto'
mcd() { mkdir -p "$1"; cd "$1";}
cls() { cd "$1"; ls;}
backup() { cp "$1"{,.bak};}
md5check() { md5sum "$1" | grep "$2";}
alias makescript="fc -rnl | head -1 >"
alias genpasswd="strings /dev/urandom | grep -o '[[:alnum:]]' | head -n 30 | tr -d '\n'; echo"
alias c="clear"
alias histg="history | grep"
alias ..='cd ..'
alias ...='cd ../..'
extract() {
    if [ -f $1 ] ; then
      case $1 in
        *.tar.bz2)   tar xjf $1     ;;
        *.tar.gz)    tar xzf $1     ;;
        *.bz2)       bunzip2 $1     ;;
        *.rar)       unrar e $1     ;;
        *.gz)        gunzip $1      ;;
        *.tar)       tar xf $1      ;;
        *.tbz2)      tar xjf $1     ;;
        *.tgz)       tar xzf $1     ;;
        *.zip)       unzip $1       ;;
        *.Z)         uncompress $1  ;;
        *.7z)        7z x $1        ;;
        *)     echo "'$1' cannot be extracted via extract()" ;;
         esac
     else
         echo "'$1' is not a valid file"
     fi
}
  
#System info
alias cmount="mount | column -t"
alias tree="ls -R | grep ":$" | sed -e 's/:$//' -e 's/[^-][^\/]*\//--/g' -e 's/^/   /' -e 's/-/|/'"
sbs(){ du -b --max-depth 1 | sort -nr | perl -pe 's{([0-9]+)}{sprintf "%.1f%s", $1>=2**30? ($1/2**30, "G"): $1>=2**20? ($1/2**20, "M"): $1>=2**10? ($1/2**10, "K"): ($1, "")}e';}
alias intercept="sudo strace -ff -e trace=write -e write=1,2 -p"
alias meminfo='free -m -l -t'
alias ps?="ps aux | grep"
alias volume="amixer get Master | sed '1,4 d' | cut -d [ -f 2 | cut -d ] -f 1"
  
#Network
alias websiteget="wget --random-wait -r -p -e robots=off -U mozilla"
alias listen="lsof -P -i -n"
alias port='netstat -tulanp'
gmail() { curl -u "$1" --silent "https://mail.google.com/mail/feed/atom" | sed -e 's/<\/fullcount.*/\n/' | sed -e 's/.*fullcount>//'}
alias ipinfo="curl ifconfig.me && curl ifconfig.me/host"
getlocation() { lynx -dump http://www.ip-adress.com/ip_tracer/?QRY=$1|grep address|egrep 'city|state|country'|awk '{print $3,$4,$5,$6,$7,$8}'|sed 's\ip address flag \\'|sed 's\My\\';}
  
#Funny
kernelgraph() { lsmod | perl -e 'print "digraph \"lsmod\" {";<>;while(<>){@_=split/\s+/; print "\"$_[0]\" -> \"$_\"\n" for split/,/,$_[3]}print "}"' | dot -Tpng | display -;}
alias busy="cat /dev/urandom | hexdump -C | grep \"ca fe\""

Amazing ! 25 Linux Performance Monitoring Tools

$
0
0
http://linoxide.com/monitoring-2/linux-performance-monitoring-tools

Over the time our website has shown you how to configure various performance tools for Linux and Unix-like operating systems. In this article we have made a list of the most used and most useful tools to monitor the performance for your box. We provided a link for each of them and split them into 2 categories: command lines one and the ones that offer a graphical interface.

Command line performance monitoring tools

1. dstat - Versatile resource statistics tool

A versatile combination of vmstat, iostat and ifstat. It adds new features and functionality allowing you to view all the different resources instantly, allowing you to compare and combine the different resource usage. It uses colors and blocks to help you see the information clearly and easily. It also allows you to export the data in CVS format to review it in a spreadsheet application or import in a database. You can use this application to monitor cpu, memory, eth0 activity related to time.
dstat

2. atop - Improved top with ASCII

A command line tool using ASCII to display a performance monitor that is capable of reporting the activity of all processes. It shows daily logging of system and process activity for long-term analysis and it highlights overloaded system resources by using colors. It includes metrics related to CPU, memory, swap, disks and network layers. All the functions of atop can be accessed by simply running:
# atop
And you will be able to use the interactive interface to display and order data.
atop

3. Nmon - performance monitor for Unix-like systems

Nmon stands for Nigel's Monitor and it's a system monitor tool originally developed for AIX. If features an Online Mode that uses curses for efficient screen handling, which updates the terminal frequently for real-time monitoring and a Capture Mode where the data is saved in a file in CSV format for later processing and graphing.
nmon
 More info in our nmon performance track article.

4. slabtop - information on kernel slab cache

This application will show you how the caching memory allocator manages in the Linux kernel caches various type of objects. The command is a top like command but is focused on showing real-time kernel slab cache information. It displays a listing of the top caches sorted by one of the listed sort criteria. It also displays a statistics header filled with slab layer information. Here are a few examples:
# slabtop --sort=a
# slabtop -s b
# slabtop -s c
# slabtop -s l
# slabtop -s v
# slabtop -s n
# slabtop -s o
More info is available kernel slab cache article

5. sar - performance monitoring and bottlenecks check

The sar command writes to standard output the contents of selected cumulative activity counters in the operating system. The accounting system, based on the values in the count and interval parameters, writes information the specified number of times spaced at the specified intervals in seconds. If the interval parameter is set to zero, the sar command displays the average statistics for the time since the system was started. Useful commands:
# sar -u 2 3
# sar –u –f /var/log/sa/sa05
# sar -P ALL 1 1
# sar -r 1 3
# sar -W 1 3

6. Saidar - simple stats monitor

Saidar is a simple and lightweight tool for system information. It doesn't have major performance reports but it does show the most useful system metrics in a short and nice way. You can easily see the up-time, average load, CPU, memory, processes, disk and network interfaces stats.
Usage: saidar [-d delay] [-c] [-v] [-h]
-d Sets the update time in seconds
-c Enables coloured output
-v Prints version number
-h Displays this help information.
saidar

7. top - The classical Linux task manager

top is one of the best known Linux utilities, it's a task manager found on most Unix-like operating systems. It shows the current list of running processes that the user can order using different criteria. It mainly shows how much CPU and memory is used by the system processes. top is a quick place to go a check what process or processes hangs your system. You can also find here a list of examples of top usage . You can access it by running the top command and entering the interactive mode:
Quick cheat sheet for interactive mode:
  • GLOBAL_Commands: ?, =, A, B, d, G, h, I, k, q, r, s, W, Z
  • SUMMARY_Area_Commands: l, m, t, 1
  • TASK_Area_Commands Appearance: b, x, y, z Content: c, f, H, o, S, u Size: #, i, n Sorting: <, >, F, O, R
  • COLOR_Mapping:, a, B, b, H, M, q, S, T, w, z, 0 - 7
  • COMMANDS_for_Windows:  -, _, =, +, A, a, G, g, w
top

8. Sysdig - Advanced view of system processes

Sysdig is a tool that gives admins and developers unprecedented visibility into the behavior of their systems. The team that develops it wants to improve the way system-level monitoring and troubleshooting is done by offering a unified, coherent, and granular visibility into the storage, processing, network, and memory subsystems making it possible to create trace files for system activity so you can easily analyze it at any time.
Quick examples:
# sysdig proc.name=vim
# sysdig -p"%proc.name %fd.name""evt.type=accept and proc.name!=httpd"
# sysdig evt.type=chdir and user.name=root
# sysdig -l
# sysdig -L
# sysdig -c topprocs_net
# sysdig -c fdcount_by fd.sport "evt.type=accept"
# sysdig -p"%proc.name %fd.name""evt.type=accept and proc.name!=httpd"
# sysdig -c topprocs_file
# sysdig -c fdcount_by proc.name "fd.type=file"
# sysdig -p "%12user.name %6proc.pid %12proc.name %3fd.num %fd.typechar %fd.name" evt.type=open
# sysdig -c topprocs_cpu
# sysdig -c topprocs_cpu evt.cpu=0
# sysdig -p"%evt.arg.path""evt.type=chdir and user.name=root"
# sysdig evt.type=open and fd.name contains /etc
sysdig
More info is available in our article on how to use sysdig for improved system-level monitoring and troubleshooting

9. netstat - Shows open ports and connections

Is the tool Linux administrators use to show various network information, like what ports are open and what network connections are established and what process runs that connection. It also shows various information about the Unix sockets that are open between various programs. It is part of most Linux distributions A lot of the commands are explained in the article on netstat and its various outputs. Most used commands are:
$ netstat | head -20
$ netstat -r
$ netstat -rC
$ netstat -i
$ netstat -ie
$ netstat -s
$ netstat -g
$ netstat -tapn

10. tcpdump - insight on network packets

tcpdump can be used to see the content of the packets on a network connection. It shows various information about the packet content that pass. To make the output useful, it allows you to use various filters to only get the information you wish. A few examples on how you can use it:
# tcpdump -i eth0 not port 22
# tcpdump -c 10 -i eth0
# tcpdump -ni eth0 -c 10 not port 22
# tcpdump -w aloft.cap -s 0
# tcpdump -r aloft.cap
# tcpdump -i eth0 dst port 80
You can find them described in detail in our article on tcpdump and capturing packets

11. vmstat - virtual memory statistics

vmstat stands for virtual memory statistics and it's a memory monitoring tool that collects and displays summary information about memory, processes, interrupts, paging and block I/O. It is an open source program available on most Linux distributions, Solaris and FreeBSD. It is used to diagnose most memory performance problems and much more.
vmstat
More info in our article on vmstat commands.

12. free - memory statistics

Another command line tool that will show to standard output a few stats about memory usage and swap usage. Because it's a simple tool it can be used to either find quick information about memory usage or it can be used in different scripts and applications. You can see that this small application has a lot of uses and almost all system admin use this tool daily :-)
free

13. Htop - friendlier top

Htop is basically an improved version of top showing more stats and in a more colorful way allowing you to sort them in different ways as you can see in our article. It provides a more a more user-friendly interface.
htop
You can find more info in our comparison of htop and top

14. ss - the modern net-tools replacement

ss is part of the iproute2 package. iproute2 is intended to replace an entire suite of standard Unix networking tools that were previously used for the tasks of configuring network interfaces, routing tables, and managing the ARP table. The ss utility is used to dump socket statistics, it allows showing information similar to netstat and its able display more TCP and state information. A few examples:
# ss -tnap
# ss -tnap6
# ss -tnap
# ss -s
# ss -tn -o state established -p

15. lsof - list open files

lsof is a command meaning "list open files", which is used in many Unix-like systems to report a list of all open files and the processes that opened them. It is used by most Linux distributions and other Unix-like operating systems by system administrators to check what files are open by various processes.
# lsof +p process_id
# lsof | less
# lsof –u username
# lsof /etc/passwd
# lsof –i TCP:ftp
# lsof –i TCP:80
You can find more examples in the lsof article

16. iftop - top for your network connections

iftop is yet another top like application that will is based on networking information. It shows various current network connection sorted by bandwidth usage or the amount of data uploaded or downloaded. It also provides various estimations of the time it will take to download them.
iftop
For more info see article on network traffic with iftop

17. iperf - network performance tool

iperf is a network testing tool that can create TCP and UDP data connections and measure the performance of a network that is carrying them. It supports tuning of various parameters related to timing, protocols, and buffers. For each test it reports the bandwidth, loss, and other parameters.
iperf
If you wish to use the tool check out our article on how to install and use iperf

18. Smem - advanced memory reporting

Smem is one of the most advanced tools for Linux command line, it offers information about the actual memory that is used and shared in the system, attempting to provide a more realistic image of the actual memory being used.
$ smem -m
$ smem -m -p | grep firefox
$ smem -u -p
$ smem -w -p
Check out our article on Smem for more examples

GUI or Web based performance tools

19. Icinga - community fork of Nagios

Icinga is free and open source system and network monitoring application. It’s a fork of Nagios retaining most of the existing features of its predecessor and building on them to add many long awaited patches and features requested by the user community.
Icinga
More info about installing and configuring can be found in our Icinga article.

20. Nagios - the most popular monitoring tool.

The most used and popular monitoring solution found on Linux. It has a daemon that collects information about various process and has the ability to collect information from remote hosts. All the information is then provided via a nice and powerful web interface.
nagios
You can find information on how to install Nagios in our article

21. Linux process explorer - procexp for Linux

Linux process explorer is a graphical process explorer for Linux. It shows various process information like the process tree, TCP/IP connections and performance figures for each process. It's a replica of procexp found in Windows and developed by Sysinternals and aims to be more user friendly then top and ps.
Check our linux process explorer article for more info.

22. Collectl - performance monitoring tool

This is a performance monitoring tool that you can use either in an interactive mode or you can have it write reports to disk and access them with a web server. It reports statistics on CPU, disk, memory, network, nfs, process, slabs and more in easy to read and manage format.
collectl
More info in our Collectl article

23. MRTG - the classic graph tool

This is a network traffic monitor that will provide you graphs using the rrdtool. It is one of the oldest tools that provides graphics and is one of the most used on Unix-like operating systems. Check our article on how to use MRTG for information on the installation and configuration process

mrtg

24. Monit - simple and easy to use monitor tool

Monit is an open source small Linux utility designed to monitor processes, system load, filesystems, directories and files. You can have it run automatic maintenance and repair and can execute actions in error situations or send email reports to alert the system administrator. If you wish to use this tool you can check out our how to use Monit article.
monit

25. Munin - monitoring and alerting services for servers

Munin is a networked resource monitoring tool that can help analyze resource trends and see what is the weak point and what caused performance issues. The team that develops it wishes it for it to be very easy to use and user-friendly. The application is written in Perl and uses the rrdtool to generate graphs, which are with the web interface. The developers advertise the application "plug and play" capabilities with about 500 monitoring plugins currently available.

Integrating Trac, Jenkins and Cobbler—Customizing Linux Operating Systems for Organizational Needs

$
0
0
http://www.linuxjournal.com/content/integrating-trac-jenkins-and-cobbler—customizing-linux-operating-systems-organizational-need

Organizations supporting Linux operating systems commonly have a need to build customized software to add or replace packages on production systems. This need comes from timing and policy differences between customers and the upstream distribution maintainers. In practice, bugs and security concerns reported by customers will be prioritized to appropriate levels for the distribution maintainers who are trying to support all their customers. This means that customers often need to support patches to fill the gap, especially for unique needs, until distribution maintainers resolve the bugs.
Customers who desire to fill the support gap internally should choose tools that the distribution maintainers use to build packages whenever possible. However, third-party software packages often present challenges to integrate them into the distribution properly. Often these packages do not follow packaging guidelines and, as a result, do not support all distribution configurations or procedures for administration. These packages often require more generic processes to resolve the improper packaging.
From this point on, the tools and methods discussed in this article are specific to Red Hat Enterprise Linux (RHEL). These tools and methods also work with derivative distributions like Scientific Linux or Community Enterprise OS (CentOS). Some of the tools do include support for distributions based on Debian. However, specifics on implementation of the process focus on integration with RHEL-based systems.
The build phase of the process (described in "A Process for Managing and Customizing HPC Operating Systems" in the April 2014 issue of LJ) requires three pieces of software that can be filled by Trac, Cobbler and Jenkins. However, these pieces of software do not fill all the gaps present from downloading source code to creation of the overlay repository. Further tools and processes are gained by analysis of the upstream distribution's package management process and guidelines.
The application of the Fedora Packaging Guidelines and its counterpart EPEL Packaging Guidelines are good references for how to package software for RHEL-based systems appropriately. These guidelines call out specifics that often are overlooked by first-time packagers. Also, tools used in the process, such as Mock, work well with the software mentioned previously.
Fedora uses other tools to manage building packages and repositories. These tools are very specific to Fedora packaging needs and are not general enough for use in our organization. This is primarily due to technical reasons and features that I go into in the Jenkins section of the article.
The rest of this article focuses on implementing Trac, Cobbler, Jenkins, and the gaps between the three systems. Some of the gaps are filled using native plugins associated with the three systems. However, others are left to be implemented using scripts and processes requiring human interactions. There are points where human interaction is required to facilitate communication between groups, and other points are where the process is missing a well implemented piece of software. I discuss setup, configuration and integration of Trac, Cobbler and Jenkins, along with some requests for community support.

Trac

Trac consists of an issue-tracking system and wiki environment to support software development projects. However, Trac also works well for supporting the maintenance of administrative processes and managing change on production systems. I'm going to discuss the mapping to apply a software development process to the process by which one administers a production system.
I realize that talking about issue tracking and wiki software is a religious topic for some. Everyone has their favorite software, and these two kinds of systems have more than enough open-source options out there from which people can choose. I want to focus on the features that we have found useful at EMSL to support our HPC system and how we use them.
The ticket-tracking system works well for managing small changes on production systems. These small changes may include individual critical updates, configuration changes and requests from users. The purpose of these tickets is to record relevant technical information about the changes for administrators as well as management. This helps all stakeholders understand the cost and priority of the change. These small changes can be aggregated into milestones, which correspond to outage dates. This provides a starting framework to track what change happens and when on production systems.
Trac's wiki has features that are required for the process. The first is the ability to maintain a history of changes to individual pages. This is ideal for storing documents and procedures. Another feature is the ability to reference milestones from within pages. This feature is extremely useful, since by entering a single line in the wiki, it displays all tickets associated with the milestone in one simple line. These two features help maintain the procedures and outage pages in the wiki.
The administrative procedures are documented in the wiki, and they include but are not limited to software configuration, startup, shutdown and re-install. The time required to perform these administrative procedures also should be noted in the page. We also make sure to use the plain-text options for specifying commands that need to be run, as other fonts may confuse readers. In many cases, we have specified the specific command to run in these procedures. For complex systems, creating multiple pages for a particular procedure is prudent. However, cross links between pages should be added to note when one part of the procedure from each page should be followed.
Trac's plugin infrastructure does not have plugins to Jenkins or Cobbler. However, what would be the point of a plugin going from Trac to continuous integration or provisioning? Most software development models keep ticket systems limited to human interaction between the issuer of the ticket and the people resolving it. Some exceptions are when tickets are considered resolved but are waiting for integration testing. Automated tests could be triggered by the ticketing system when the ticket's state is changed. However, mapping these sorts of features to administrative procedures for managing production systems do not apply.

Cobbler

Cobbler works well for synchronizing RPM-based repositories and using those repositories to deploy systems. The RPMs are synchronized daily from Jenkins and distribution maintainers. The other important feature is to exclude certain packages from being synchronized locally. These features provide a platform to deploy systems that have specific customized packages for use in the enterprise.
The initial setup for Cobbler is to copy the primary repositories for the distribution of your choice to "repos" in Cobbler. The included repositories from Scientific Linux are the base operating system, fastbugs and security. Other distributions have similar repository configurations (see the Repositories and Locations sidebar). The other repository to include is EPEL, as it contains Mock and other tools used to build RPMs. There are other repositories that individual organizations should look into, although these four repositories are all that is needed.

Repositories and Locations

  • Extra Packages for Enterprise Linux: http://dl.fedoraproject.org/pub/epel/6/x86_64
  • Scientific Linux 66 Base: http://ftp1.scientificlinux.org/linux/scientific/6/x86_64/os
  • Scientific Linux 6 Security: http://ftp1.scientificlinux.org/linux/scientific/6/x86_64/updates/security
  • Scientific Linux 6 Fastbugs: http://ftp1.scientificlinux.org/linux/scientific/6/x86_64/updates/fastbugs
  • CentOS 6 Base: http://mirror.centos.org/centos/6/os/x86_64
  • CentOS 6 FastTrack: http://mirror.centos.org/centos/6/fasttrack/x86_64
  • CentOS 6 Updates: http://mirror.centos.org/centos/6/updates/x86_64
  • RHEL 6 Server Base: rhel-x86_64-server-6 channel
  • RHEL 6 Server FasTrack: rhel-x86_64-server-fastrack-6 channel
  • RHEL 6 Server Optional: rhel-x86_64-server-optional-6 channel
  • RHEL 6 Server Optional FasTrack: rhel-x86_64-server-optional-fastrack-6 channel
  • RHEL 6 Server Supplementary: rhel-x86_64-server-supplementary-6 channel

    The daily repositories either are downloaded from the Web on a daily basis or synchronized from the local filesystem. The daily repositories get the "keep updated" flag set, while the test and production repositories do not. For daily repositories that synchronize from a local filesystem, the "breed" should be set to rsync, while daily repositories that synchronize from the Web should set their "breed" to yum. This configuration, through experience, has been chosen because some RPMs do not upgrade well with new kernels nor do they have standard update processes normal to Red Hat or Fedora.
    An example of a set of repositories would be as follows:
  • phi-6-x86_64-daily — synchronizes automatically from the local filesystem using rsync once daily.
  • epel-6-x86_64-daily — synchronizes automatically from the Web using reposync once daily.
  • phi-6-x86_64-test — synchronizes manually from phi-6-x86_64-daily using rsync.
  • epel-6-x86_64-test — synchronizes manually from epel-6-x86_64-daily using rsync.
  • phi-6-x86_64-prod — synchronizes manually from phi-6-x86_64-test using rsync.
  • epel-6-x86_64-prod — synchronizes manually from epel-6-x86_64-test using rsync.
To exclude critical packages from the upstream distribution, the "yum options" flags are set on the daily repository to remove them. For example, to exclude the kernel package from from being synchronized, add exclude=kernel*. It's important for administrators to consult both the Cobbler and yum.conf man pages to get the syntax right.
Setting up Cobbler in this way allows administrators to deploy systems using customized critical packages. Cobbler also is used in future phases where the repositories are used to deploy the test and production clusters. The repositories and their relationships are all Cobbler needs to support package building, the test cluster and the production cluster.

Jenkins

Jenkins is a very powerful continuous integration tool used in software development. However, from a system administration view, Jenkins is a mutant cron job on steroids. Jenkins handles periodic source code checkout from source code management (SCM) repositories and downloading of released source code, via HTTP or FTP. It then runs a series of generic jobs that build, test and deploy the resulting software. These generic interfaces work well for building and distributing RPMs to be included by Cobbler.
The use of Jenkins in a software development role is not all that different from building RPMs (see Table 1 for a comparison of the two processes). The first step in the two processes differs in that (hopefully) the software development code required for the build step is in one place. Package developers need to have, at a minimum, two locations to pull code from to continue with the build. The first location is for patches and spec files, normally kept in an SCM. The second is for released source code packages. Source code is released in a single file and usually in some container format (such as tar, rar or zip). These files do not normally belong in an SCM and are more suited to an S3 (http://docs.aws.amazon.com/AmazonS3/latest/API/Welcome.html), swift (http://docs.openstack.org/api/openstack-object-storage/1.0/content) or blob store-like interface.

Table 1. Packaging vs. Development

Software DevelopmentRPM Packaging
Download source code from SCM.Download released source, spec file and patches.
Run the build process.Build the RPMs using Mock.
Run the testing suite.Validate the RPMs using rpmlint.
Publish test results.Save validation output for inspection.
Save source code package to repository.Save built RPMs for later download.
Send notification to pertinent developers.Send notification to pertinent packagers.
Jenkins is built primarily for downloading code from one and only one SCM. However, you can work around this issue by adding another build step. This means that the SCM plugin is used to download the spec file and patches while the first step in the build process downloads the source code package. After these two steps are done, the source code, patches or spec file can be patched with site-specific customization.
The next step is to build RPMs using Mock. This involves several tasks that can be broken up into various build steps (see the Mock Build in Jenkins sidebar). All these steps are done using the Jenkins execute shell build steps. Some of the Jenkins jobs we use are multi-configuration jobs that contain one axis defining the Mock chroot configuration. That chroot configuration should be generated from the daily repositories defined in Cobbler. Following these tasks can get you started on using Mock in Jenkins (Listing 1).

Listing 1. basic-mock-jenkins.sh


#!/bin/bash -xe

# keep in mind DIST is defined in multi-configuration axis
MOCK="/usr/bin/mock -r $DIST"
PKG=${JOB_NAME##*/}
# keep in mind VER could also be a multi-configuration axis
VER=${VER:-1.0}
# if you are ripping apart an RPM might have this one too
REL=${REL:-4.el6}

OUT=$PWD/output

wget -O $PKG-$VER.tar.gz
↪http://www.example.com/sources/$PKG-$VER.tar.gz
rm -f $OUT/*.src.rpm
if ! $MOCK --resultdir=$OUT --buildsrpm --spec=$PKG.spec
↪--sources=$PWD
then
more $OUT/*.log | cat
exit -1
fi

if ! $MOCK --resultdir=$OUT --rebuild $OUT/*.src.rpm
then
more $OUT/*.log | cat
exit -1
fi

rpmlint $OUT/*.rpm > rpmlint.log

Mock Build in Jenkins

  1. Prepare the source and specs.
  2. Run Mock source rpm build.
  3. Run Mock rpm build.
  4. Run rpm validation.

    Once the RPMs are built, it's important to run rpmlint on the resulting RPMs. This output gives useful advice for how to package RPMs properly for the targeted platform. This output should be handled like any other static code analysis tool. The number of warnings and errors should be tracked, counted and graphed over a series of builds. This gives a good indication whether bugs are being resolved or introduced over time.
    The generated RPMs and rpmlint output need to be archived for future use. The archive artifacts plugin works well for capturing these files. There also is an artifact deployer plugin that can copy the artifacts to directories that Cobbler can be configured to synchronize from for its part of the process.
    There is some room for improvement in this process, and I outline that in the conclusion. However, this is the basic framework to start using Jenkins to build RPMs using Mock and rpmlint. This part of the process needs constant care and attention as new updates are pushed by the distribution and package developers. Jenkins does have plugins to Trac and other issue-tracking systems. However, they are not included in this process, as we find e-mail to be a sufficient means of communication. The outlined process for building RPMs using Jenkins helps us track the hacks we use to manipulate important packages for our systems.

    Table 2. Software

    RoleSoftware Choice
    Continuous IntegrationJenkins
    Repository ManagementCobbler
    ProvisioningCobbler
    Ticket TrackingTrac
    WikiTrac
    Package BuildingMock
    Package GuidelinesFedora Packaging Guidelines

    Conclusion

    I have discussed a method for setting up tools to develop RPMs against a custom distribution managed by Cobbler. Along with Trac, package developers can maintain updated RPMs of critical applications while managing communication. However, this process is not without gaps. First, I'll go over the gaps present in Jenkins, discussing core and plugin gaps that were not found. Then I'll discuss the gaps in Cobbler regarding repository management. These two systems are lacking in integration, although that can be worked around.
    MultiSCM is a functionality in Jenkins that would simplify the package building process. There is a MultiSCM plugin; however, it is advertised as a proof-of-concept code. The hope is that the radio button selection for SCM would turn into a set of check boxes. There are related bugs, but they have not seen traction in years. Package development is another good example of the need to download and poll for updates on code from multiple places.
    Here are links to information on the Jenkins Multiple SCMs Bugs:
  5. https://issues.jenkins-ci.org/browse/JENKINS-7192
  6. https://issues.jenkins-ci.org/browse/JENKINS-9720
Static code analysis tools are available as plugins for Jenkins, although these plugins do not include rpmlint. These plugins create graphs to track the number of warnings and errors in code over time. To perform the same task for packaging would be very helpful. However, you can work around this gap by using the generic plot pluginand another build step for each job.
Mock has a very well defined interface and workflow. A generic plugin to use Mock in Jenkins would be very useful. The plugin should include configuring the chroot configuration. Two kinds of build jobs also could be created, one using spec and source files, the other using source RPMs. A test also would need to be created to verify that Mock can be run without prompting for a user password. This plugin would be very helpful for automating this process, as we currently have to copy scripts between jobs.
There are some additions to Cobbler that would be useful for this process as well. There are no per-repo triggers. The ability to tell Trac that packages went from repo test to repo prod would be useful. Furthermore, the ability to tell Jenkins to build a package because a dependent package updated also would be useful.
The other useful addition to Cobbler would be the ability to remove older RPMs in the destination tree while synchronizing from the remote mirror. Cobbler repositories, if the "breed" is yum, build up in an append-only fashion. Processes for managing the space may be run periodically by removing the RPMs and then synchronizing the repository again. However, this leaves the repository in a broken state until the process is complete. This feature could be useful in any Cobbler deployment, as it would make sure repositories do not continue to take up space when RPMs are not needed.
Trac does not need any additional plugins to integrate better with Cobbler or Jenkins. We have found some usability issues with manipulating large tables in the wiki format. Some plugin to make editing large tables easier in the wiki format would be useful for us. Also, editing long pages becomes an issue if you cannot put comments throughout the page. We validate our procedures by having members of the group who are unfamiliar with the system read through the procedure. The reader should be able to comment on but not edit parts of the page. We have worked around or found plugins on the Trac Hacks page to resolve these issues.
The final request is for some level of certification from distribution maintainers to certify third-party packages. Many of the third-party packages we have applied to this process to do not support all distribution configurations. A certification from distribution maintainers validating that software distributed by third-party vendors have packaged their software appropriately for the distribution would help customers determine the cost of support.
This is by no means a complete solution for organizations to build customized critical applications. There are still gaps in the system that we have to work around using scripts or manual intervention. We constantly are working on the process and tools to make them better, so any suggestions to improve it are welcome. However, these tools do fill the need to support customization of critical applications for HPC at EMSL.

Acknowledgement

The research was performed using EMSL, a national scientific user facility sponsored by the Department of Energy's Office of Biological and Environmental Research and located at Pacific Northwest National Laboratory.

5 Deadly Linux Commands You Should Never Run

$
0
0
http://www.theepochtimes.com/n3/1031947-5-deadly-linux-commands-you-should-never-run

As a Linux user, you probably have searched online for articles and tutorials that show you how to use the terminal to run some commands. While most of these commands are harmless and could help you become more productive, there are some commands that are deadly and could wipe out your whole machine.

In this article, let’s check out some of the deadly Linux commands that you should never run.
Note: These commands are really harmful, so please don’t try to reproduce them on your Linux machines. You have been warned.

1. Deletes Everything Recursively

rm -rf /

This is one of the most deadly Linux commands around. The functionality of this command is really simple. It forcefully removes or deletes (rm) all the files and folders recursively (-rf) in the root directory (/) of your Linux machine. Once you delete all the files in the root directory, there is no way that you can boot into your Linux system again.
Also be aware that the below command comes in many other forms such as rm -rf * or rm -rf. So always be careful when ever you are executing a command that includes rm.

2. Fork Bomb

:(){ :|: & };:

This weird looking command doesn’t even look like a command, but it functions like a virus which creates copies of itself endlessly, thus called as Fork Bomb. This shell function quickly hijacks all your system resources like CPU, memory, etc. and will cause a system crash which in turn may result in data loss. So never ever try this command or any other weird-looking commands for that matter.

3. Move Everything to Nothingness

mv ~ /dev/null

The functionality of this command is really basic and simple. All it does is move (mv) the contents of your home folder (~) into the /dev/null folder. This looks really innocent, but the catch is that there is no folder called “Null,” and it simply means that you are moving all your files and folders into nothingness essentially destroying all the files irrecoverably.

4. Format Hard Drive

mkfs.ext3 /dev/sda

This command is really a disaster as it formats your entire hard drive and replaces it with the new ext3 file system. Once you execute the command, all your data is lost irrecoverably. So never ever try this command or any other suspicious command that involves your hard drive (sda).

5. Output Command Directly to Hard Drive

any-command > /dev/sda

This command is much more simple; any command you execute (in the place of “any-command”) will write the output data to your first hard drive replacing all the files and folders. This in turn damages your entire file system. Once you execute this command, you will be unable to boot into your Linux machine and your data may be lost irrecoverably.
Again, don’t ever try any suspicious command that includes your hard drive (sda).

Conclusion

Using the command line is pretty interesting but don’t blindly execute all the commands you find in the internet. A single command is enough to wipe out your whole system. In addition, while some of the commands above require elevated permissions (administrator), they may be disguised in other commands and may trick you into executing them.
So always be careful while you are executing the commands and only trust reputed and trusted sources for your command line requirements. The best way is to educate yourselves on how each command works and think through before executing the command.

Unix: Beyond owner, group, and everyone else

$
0
0
http://www.itworld.com/article/2838785/unix-beyond-owner-group-and-everyone-else.html

The standard way of assigning file permissions on Unix systems is so tied into how people think of Unix that many of us seem to forget that this scheme was expanded many years ago to accomodate more than just file owners, groups, and everyone else. The setfacl (set file access control lists) and getfacl (get file access control list) commands were designed to allow more than the traditional limited assignment of privileges. While not disturing the customary owner-group-other permissions, you could, for example, give another account holder the same permissions as the owner or allow more than one group to have special access while not giving that access to just everyone. Everything comes at some cost, however, and to use the setfacl and getfacl commands, a file system has to be mounted with a special option that allows these commands and the underlying expansion of priviledges to be used. After all, there is overhead associated with keeping track of the extra permissions, so you have to opt in by adding an option to the file system in the /etc/fstab file -- the acl option. If you don't, anyone trying to use these commands will likely be confronted with an "operation not supported" error. You may also have to check whether your kernel provides support for this feature. To mount a file system with the acl option, you will need to use a command like this:
# mount -t ext4 -o acl /dev/hdb3 /data
In the /etc/fstab, this same operation might look like this:
/dev/hdb3    /data    ext4  defaults,acl     0    1
Indications that the extended permissions are in use are rather subtle. You'll just see a + sign at the end of the normal permissions field. For example:
-rw-r-----+ 1 smitten   admins 22088 Oct 26 recipe
That little + at the end of -rw-r-----+ tells you that there are more permissions than the rw-r----- permissions string is letting on. And, if you want to know more, you just have to use the getfacl command to display the complete permissions for the file. For a file with only standard permissions, you will see something like this:
$ getfacl beerlist
# file: beerlist
# owner: smitten
# group: admins
user::rw-
group::r--
other::---
This shows us what we normally see in a long listing, but in a different format. For a file with the extended permissions, on the other hand, the getfacl command might show you any additional permissions that have been set -- like this:
$ getfacl beerlist
# file: beerlist
# owner: smitten
# group: admins
user::rw-
user:tsmiley:rw-
group::r--
mask::rw-
other::---
Notice that we now see another user (tsmiley) with read and write permissions and a new field -- the "mask" field that sets default permissions for the file. You can set extended permissions using the setfacl command. Here are some examples where we give a user read, write and execute or add write permission.
setfacl -m u:tsmiley:rwx /data/example
setfacl -m u:tsmiley:+w /data/example
The -m stands for modify. The "u" in u: stands for user. You can assign permissions to groups as well as to individuals. You would assign a group permissions with a "g" as in the examples shown below.
setfacl -m g:devt:rwx /data/testcase
setfacl -R -m g:devt:+x testcases/
setfacl -m d:g:admins:rwx /data/scripts
In the third line in this example, the d: before the g: makes the new settings (rwx) the default for this directory. When files or direcxtories are created under the /data/scripts directory, the admins group will have rwx permission to them as well. After setting a default, you can expect to see these values when you use the getfacl command in the form of an additional line that looks like this:
default:group::rwx
One of the other complexities that you are likely to run into is the idea of the effective mask setting. If the mask is more restrictive than the permissions that you grant, the mask will take precedence. In the example below, the mask is r-- and reduces the privileges given to the groups to r--.
$ getfacl /data/jumping.jar 
# file: /data/jumping.jar
# owner: dbender
# group: users
user::rw-
group::rwx #effective:r--
group:devt:rwx #effective:r--
mask::r--
other::r--

To remove extended permissions for a file or folder, you can use one of these commands. Remove all ACLs from a file:
setfacl -b /data/example
Remove the default ACL:
setfacl -k testcases
The mask setting is interesting. It will be set up whenever permissions beyond those of owner, group, and other are used. As you'd read in the man page for the setfacl command, the mask is the union of all permissions from the owning group, named user and group settings. It can limit the permissions that are available but you can change the mask with a command like this:
$ setfacl -m mask:rw- /data/example
Note that mask can be spelled (mask:) out or abbreviated to m (m:). Generally, it will be set to whatever permissions are intended for the expected collections of users and groups. You can also override this setting when you assign permissions by requesting that no mask be used with the -n or --no-mask setting. The traditional Unix permissions are easy to think about, but can be seriously confining when you need more flexibility in defining what various users or groups on your servers should be able to do. The newer ACL commands give you a lot more leeway in determining who gets what permissions. You just have to work a little harder to be sure they're right.

How to encrypt files and directories with eCryptFS on Linux

$
0
0
http://xmodulo.com/encrypt-files-directories-ecryptfs-linux.html

You do not have to be a criminal or work for the CIA to use encryption. You simply don't want anybody to spy on your financial data, family pictures, unpublished manuscripts, or secret notes where you have jotted down startup ideas which you think can make you super rich.
I have heard people telling me "I'm not important enough to be spied on" or "I don't hide anything to care about." Well, my opinion is that even if I don't have anything to hide, or I can publish a picture of my kids with my dog, I have the right to not do it and want to protect my privacy.

Types of Encryption

We have largely two different ways to encrypt files and directories. One method is filesystem-level encryption, where only certain files or directories (e.g., /home/alice) are encrypted selectively. To me, this is a perfect way to start. You don't need to re-install everything to enable or test encryption. Filesystem-level encryption has some disadvantages, though. For example, many modern applications cache (part of) files in unencrypted portions of your hard drive, such as swap partition, /tmp and /var folders, which can result in privacy leaks.
The other way is so-called full-disk encryption, which means that the entire disk is encrypted (possibly except for a master boot record). Full disk encryption works at the physical disk level; every bit written to the disk is encrypted, and anything read from the disk is automatically decrypted on the fly. This will prevent any potential unauthorized access to unencrypted data, and ensure that everything in the entire filesystem is encrypted, including swap partition or any temporarily cached data.

Available Encryption Tools

There are several options to implement encryption in Linux. In this tutorial, I am going to describe one option: eCryptFS a user-space cryptographic filesystem tool. For your reference, here is a roundup of available Linux encryption tools.

Filesystem-level encryption

  • EncFS: one of the easiest ways to try encryption. EncFS works as a FUSE-based pseudo filesystem, so you just create an encrypted folder and mount it to a folder to work with.
  • eCryptFS: a POSIX compliant cryptographic filesystem, eCryptFS works in the same way as EncFS, so you have to mount it.

Full-disk encryption

  • Loop-AES: the oldest disk encryption method. It is really fast and works on old system (e.g., kernel 2.0 branch).
  • DMCrypt: the most common disk encryption scheme supported by the modern Linux kernel.
  • CipherShed: an open-source fork of the discontinued TrueCrypt disk encryption program.

Basics of eCryptFS

eCryptFS is a FUSE-based user-space cryptographic filesystem, which has been available in the Linux kernel since 2.6.19 (as ecryptfs module). An eCryptFS-encrypted pseudo filesystem is mounted on top of your current filesystem. It works perfectly on EXT filesystem family and others like JFS, XFS, ReiserFS, Btrfs, even NFS/CIFS shares. Ubuntu uses eCryptFS as its default method to encrypt home directory, and so does ChromeOS. Underneath it, eCryptFS uses AES algorithm by default, but it supports others algorithms, such as blowfish, des3, cast5, cast6. You will be able to choose among them in case you create a manual setup of eCryptFS.
Like I said, Ubuntu lets us choose whether to encrypt our /home directory during installation. Well, this is the easiest way to use eCryptFS.

Ubuntu provides a set of user-friendly tools that make our life easier with eCryptFS, but enabling eCryptFS during Ubuntu installation only creates a specific pre-configured setup. So in case the default setup doesn't fit your needs, you will need to perform a manual setup. In this tutorial, I will describe how to set up eCryptFS manually on major Linux distros.

Installation of eCryptFS

Debian, Ubuntu or its derivatives:
$ sudo apt-get install ecryptfs-utils
Note that if you chose to encrypt your home directory during Ubuntu installation, eCryptFS should be already installed.
CentOS, RHEL or Fedora:
# yum install ecryptfs-utils
Arch Linux:
$ sudo pacman -S ecryptfs-utils
After installing the package, it is a good practice to load the eCryptFS kernel module just to be sure:
$ sudo modprobe ecryptfs

Configure eCryptFS

Now let's start encrypting some directory by running eCryptFS configuration tool:
$ ecryptfs-setup-private

It will ask for a login passphrase and a mount passphrase. The login passphrase is the same as your normal login password. The mount passphrase is used to derive a file encryption master key. Leave it blank to generate one as it's safer. Log out and log back in.
You will notice that eCryptFS created two directories by default: Private and .Private in your home directory. The ~/.Private directory contains encrypted data, while you can access corresponding decrypted data in the ~/Private directory. At the time you log in, the ~/.Private directory is automatically decrypted and mapped to the ~/Private directory, so you can access it. When you log out, the ~/Private directory is automatically unmounted and the content in the ~/Private directory is encrypted back into the ~/.Private directory.
The way eCryptFS knows that you own the ~/.Private directory, and automatically decrypts it into the ~/Private directory without needing us to type a password is through an eCryptFS PAM module which does the trick for us.
In case you don't want to have the ~/Private directory automatically mounted upon login, just add the "--noautomount" option when running ecryptfs-setup-private tool. Similarly, if you do not want the ~/Private directory to be automatically unmounted after logout, specify "--noautoumount" option. But then, you will have to mount or unmount ~/Private directory manually by yourself:
$ ecryptfs-mount-private ~/.Private ~/Private
$ ecryptfs-umount-private ~/Private
You can verify that .Private folder is mounted by running:
$ mount

Now we can start putting any sensitive files in ~/Private folder, and they will automatically be encrypted and locked down in ~/.Private folder when we log out.
All this seems pretty magical. Basically ecryptfs-setup-private tool makes everything easy to set up. If you want to play a little more and set up specific aspects of eCryptFS, go to the official documentation.

Conclusion

To conclude, if you care a great deal about your privacy, the best setup I recommend is to combine eCryptFS-based filesystem-level encryption with full-disk encryption. Always remember though, file encryption alone does not guarantee your privacy.

How to create and manage LXC containers on Ubuntu

$
0
0
http://xmodulo.com/lxc-containers-ubuntu.html

While the concept of containers was introduced more than a decade ago to manage shared hosting environments securely (e.g., FreeBSD jails), Linux containers such as LXC or Docker have gone mainstream only recently with the rising need to deploy applications for the cloud. While Docker is getting all the media spotlight these days with strong backing from major cloud providers (e.g., Amazon AWS, Microsoft Azure) and distro providers (e.g., Red Hat, Ubuntu), LXC is in fact the original container technology developed for Linux platforms.
If you are an average Linux user, what good does Docker/LXC bring to you? Well, containers are actually a great means to switch between distros literally instantly. Suppose your current desktop is Debian. You want Debian's stability. At the same time, you also want to play the latest Ubuntu games. Then instead of bothering to dual boot into a Ubuntu partition, or boot up a heavyweight Ubuntu VM, simply spin off a Ubuntu container on the spot, and you are done.
Even without all the goodies of Docker, what I like about LXC containers is the fact that LXC can be managed by libvirt interface, which is not the case for Docker. If you have been using libvirt-based management tools (e.g., virt-manager or virsh), you can use those same tools to manage LXC containers.
In this tutorial, I focus on the command-line usage of standard LXC container tools, and demonstrate how to create and manage LXC containers from the command line on Ubuntu.

Install LXC on Ubuntu

To use LXC on Ubuntu, install LXC user-space tools as follows.
$ sudo apt-get install lxc
After that, check the current Linux kernel for LXC support by running lxc-checkconifg tool. If everything is enabled, kernel's LXC support is ready.
$ lxc-checkconfig

After installing LXC tools, you will find that an LXC's default bridge interface (lxcbr0) is automatically created (as configured in /etc/lxc/default.conf).

When you create an LXC container, the container's interface will automatically be attached to this bridge, so the container can communicate with the world.

Create an LXC Container

To be able to create an LXC container of a particular target environment (e.g., Debian Wheezy 64bit), you need a corresponding LXC template. Fortunately, LXC user space tools on Ubuntu come with a collection of ready-made LXC templates. You can find available LXC templates in /usr/share/lxc/templates directory.
$ ls /usr/share/lxc/templates

An LXC template is nothing more than a script which builds a container for a particular Linux environment. When you create an LXC container, you need to use one of these templates.
To create a Ubuntu container, for example, use the following command-line:
$ sudo lxc-create -n -t ubuntu

By default, it will create a minimal Ubuntu install of the same release version and architecture as the local host, in this case Saucy Salamander (13.10) 64-bit.
If you want, you can create Ubuntu containers of any arbitrary version by passing the release parameter. For example, to create a Ubuntu 14.10 container:
$ sudo lxc-create -n -t ubuntu -- --release utopic
It will download and validate all the packages needed by a target container environment. The whole process can take a couple of minutes or more depending on the type of container. So be patient.

After a series of package downloads and validation, an LXC container image are finally created, and you will see a default login credential to use. The container is stored in /var/lib/lxc/. Its root filesystem is found in /var/lib/lxc//rootfs.
All the packages downloaded during LXC creation get cached in /var/cache/lxc, so that creating additional containers with the same LXC template will take no time.
Let's see a list of LXC containers on the host:
$ sudo lxc-ls --fancy
NAME  STATE    IPV4  IPV6  AUTOSTART  
------------------------------------
test-lxc STOPPED - - NO
To boot up a container, use the command below. The "-d" option launches the container as a daemon. Without this option, you will directly be attached to console right after you launch the container.
$ sudo lxc-start -n -d
After launching the container, let's check the state of the container again:
$ sudo lxc-ls --fancy
NAME  STATE    IPV4       IPV6  AUTOSTART  
-----------------------------------------
lxc RUNNING 10.0.3.55 - NO
You will see that the container is in "RUNNING" state with an IP address assigned to it.
You can also verify that the container's interface (e.g., vethJ06SFL) is automatically attached to LXC's internal bridge (lxcbr0) as follows.
$ brctl show lxcbr0

Manage an LXC Container

Now that we know how to create and start an LXC container, let's see what we can do with a running container.
First of all, we want to access the container's console. For this, type this command:
$ sudo lxc-console -n

Type to exit the console.
To stop and destroy a container:
$ sudo lxc-stop -n
$ sudo lxc-destroy -n
To clone an existing container to another, use these commands:
$ sudo lxc-stop -n
$ sudo lxc-clone -o -n

Troubleshooting

For those of you who encounter errors with LXC, here are some troubleshooting tips.
1. You fail to create an LXC container with the following error.
$ sudo lxc-create -n test-lxc -t ubuntu
lxc-create: symbol lookup error: /usr/lib/x86_64-linux-gnu/liblxc.so.1: undefined symbol: cgmanager_get_pid_cgroup_abs_sync
This means that you are running the latest LXC, but with an older libcgmanager. To fix this problem, you need to update libcgmanager.
$ sudo apt-get install libcgmanager0

A hitchhikers guide to troubleshooting linux memory usage

$
0
0
http://techarena51.com/index.php/linux-memory-usage

A hitchhikers guide to troubleshooting linux memory usage
Linux memory management has always intrigued me. While learning Linux, many concepts are confusing at first, but after a lot of reading, googling, understanding and determination, I learned that the kernel is not only efficient at memory
management but also on par with artificial intelligence in making memory distribution decisions..
This post will hopefully show you how to troubleshoot or at least find out the
amount of memory used by Linux and an application running on it. If you have any
doubts, do let me know by commenting.
Finding Linux System Memory usage

One of the simplest way to check Linux system memory usage is with the “free”
command.
Below is my “free -­m” command output.
linux memory usage

The first line shows you that my free memory is only 111MB but the trick here is to
look at the second line for free memory.
The first line calculates caches and buffers along with the used memory.
Now linux does cache data to speed up the process of loading content.
But, that cached memory is also available for a new process to use at any time and
can be freed by the kernel immediately, in case any of your processes need it.
Buffers on the other hand, store metadata like file permissions or memory location of the cached data. Since this physical memory is availble for our process to use, we can subtract this information from the used memory to give us a free memory of 305MB as seen in the figure above.
Memory caching or Page cache
Linux divides memory into blocks called pages and hence the term page cache.
I will be using page cache from now on, but don’t get confused just replace page with memory if you do.
How page cache works.
Any time you do a read() from a file on disk, that data is read into memory, and
goes into the page cache. After this read() completes, the kernel has the option to
discard the page, since it is not being used. However, if you do a second read of
the same area in a file, the data will be read directly out of memory and no trip to
the disk will be taken. This is an incredible speedup.  And is the reason why Linux
uses its page cache so extensively, is because it knows that once you access a
page on disk the first time, you will surely access it again.
Similarly when you save data to a file it is not immediately written to the disk, it is
cached and written periodically to reduce I/O. The name for this type of cache is
Dirty.You can see it’s output  by running “cat /proc/meminfo”.
linux memory usage
You can flush the cache with the following command.
echo 1 > /proc/sys/vm/drop_caches
To write cache to disk you can use the sync command
sync
Finding linux process memory usage 
Here is my HTOP output.
linux memory usage
You need to look at the VIRT, RSS and SHR columns to get an idea of memory
consumption.

VIRT : Stands for Virtual Memory and displays the amount of memory requested
by an application. Applications often request more memory than required, however
they may not be actually using that memory and hence we can ignore this column.
RSS : Stands for Resident Set Size and displays the amount of memory used by
the process.
SHR : Stands for  Shared memory and displays the memory shared with other
processes.
The last two columns are what we need look at  to find out how much memory our
process is using.
For simple linux applications this information should suffice for you to know which
process is taking too much of your memory. But if you need to debug advance
issues like a memory leak then you need to go a step further.

The only problem with the HTOP output is that the RSS column displays used memory as Process memory + Total shared memory, even though the process is
using only a part of the shared memory.

Let’s take an analogy to understand this better.
I am a sensible spender ( I am married :) ), so sometimes I like to carpool to work.
Let’s say it takes 4$ worth of fuel from home to office.
When I go to work alone, I spend 4$ on fuel. The next day I car pool with 3 of my
friends, we pay a dollar each on fuel. So my total expenditure for the two days
would be 5$, however RSS would display it as $8.
Therefore, in order to find the exact memory usage you can you use a tool called
ps_mem.py.
git clone https://github.com/pixelb/ps_mem.git

cd ps_mem

sudo ./ps_mem.py

linux memory usage
There you go php­fpm is hogging my memory.
Troubleshooting slow application issues in Linux.
If you look at the free output again you will see that the swap memory is used even
though we have ram free
linux memory usage
The Linux kernel moves out pages which are not active or being used at the
moment to swap space on the disk. This process is known as
swappiness. Since swap space is on the hard drive fetching
data will be slower as compared to your ram, This may cause your application to take a hit in
terms of speed. You have the option to turn off swaping by changing the value in
 “/proc/sys/vm/swappiness” to 0. The value ranges from 0 to 100 where 100
means aggressive swapping.
Update: A good tip from karthik in comments
“I would recommend 1 more step, before changing the swappiness value. Try “vmstat -n 1″ and check the “si”, “so” field. If “si” and “so” (stands for swapin and swapout) fields are always 0, then the system is currently not swapping. Some application, has used the swap but somehow its not cleaned the swap space. At such situation a “swapoff/swapon” command would be handy.”
Update 2: Another good tool and page cache advice from reddit user zeroshiftsl
“I would add one more section though, the slab. I recently ran into an issue where a system was consuming more and more memory over time. I thought it was a leak, but no process seemed to own any of the missing memory. Htop showed the memory as allocated but it didn’t add up in the processes. This was NOT disk cached memory. Using “slabtop“, I found that a bunch of memory was stuck in dentry and inode_cache. This memory was not being freed when dropping caches like it should, and upping the vfs_cache_pressure had no effect. Had to kill the parent process (SSH session) that created all of these to reclaim the memory.”
Update: The ps_mem.py script runs only once, you may want to run it periodically to get real time memory usage, hence I recommend you read How to display a changing output like top
I tried to keep this post as simple as possible and this data should give you enough
information to troubleshoot any memory usage issues you might face on your linux
vps or server.
If there is anything I missed please do share your experiences troubleshooting linux memory usage issues in the comments below.

https://www.kernel.org/doc/Documentation/sysctl/vm.txt
http://www.linuxhowtos.org/System/Linux%20Memory%20Management.htm
http://www.redhat.com/advice/tips/meminfo.html
http://www.thomas­krenn.com/en/wiki/Linux_Page_Cache_Basics
Viewing all 1407 articles
Browse latest View live


<script src="https://jsc.adskeeper.com/r/s/rssing.com.1596347.js" async> </script>