http://www.linuxjournal.com/content/ansible-automation-framework-thinks-sysadmin
I've written about and trained folks on various DevOps tools through the years, and although they're awesome, it's obvious that most of them are designed from the mind of a developer. There's nothing wrong with that, because approaching configuration management programmatically is the whole point. Still, it wasn't until I started playing with Ansible that I felt like it was something a sysadmin quickly would appreciate.
Part of that appreciation comes from the way Ansible communicates with its client computers—namely, via SSH. As sysadmins, you're all very familiar with connecting to computers via SSH, so right from the word "go", you have a better understanding of Ansible than the other alternatives.
With that in mind, I'm planning to write a few articles exploring how to take advantage of Ansible. It's a great system, but when I was first exposed to it, it wasn't clear how to start. It's not that the learning curve is steep. In fact, if anything, the problem was that I didn't really have that much to learn before starting to use Ansible, and that made it confusing. For example, if you don't have to install an agent program (Ansible doesn't have any software installed on the client computers), how do you start?
Getting to the Starting Line
The reason Ansible was so difficult for me at first is because it's so flexible with how to configure the server/client relationship, I didn't know what I was supposed to do. The truth is that Ansible doesn't really care how you set up the SSH system; it will utilize whatever configuration you have. There are just a couple things to consider:
- Ansible needs to connect to the client computer via SSH.
- Once connected, Ansible needs to elevate privilege so it can configure the system, install packages and so on.
Unfortunately, those two considerations really open a can of worms. Connecting to a remote computer and elevating privilege is a scary thing to allow. For some reason, it feels less vulnerable when you simply install an agent on the remote computer and let Chef or Puppet handle privilege escalation. It's not that Ansible is any less secure, but rather, it puts the security decisions in your hands.
Next I'm going to list a bunch of potential configurations, along with the pros and cons of each. This isn't an exhaustive list, but it should get you thinking along the right lines for what will be ideal in your environment. I also should note that I'm not going to mention systems like Vagrant, because although Vagrant is wonderful for building a quick infrastructure for testing and developing, it's so very different from a bunch of servers that the considerations are too dissimilar really to compare.
Some SSH Scenarios
1) SSHing into remote computer as root with password in Ansible config. I started with a terrible idea. The "pros" of this setup is that it eliminates the need for privilege escalation, and there are no other user accounts required on the remote server. But, the cost for such convenience isn't worth it. First, most systems won't let you SSH in as root without changing the default configuration. Those default configurations are there because, quite frankly, it's just a bad idea to allow the root user to connect remotely. Second, putting a root password in a plain-text configuration file on the Ansible machine is mortifying. Really, I mentioned this possibility because it
is a possibility, but it's one that should be avoided. Remember, Ansible allows you to configure the connection yourself, and it will let you do really dumb things. Please don't.
2) SSHing into a remote computer as a regular user, using a password stored in the Ansible config. An advantage of this scenario is that it doesn't require much configuration of the clients. Most users are able to SSH in by default, so Ansible should be able to use credentials and log in fine. I personally dislike the idea of a password being stored in plain text in a configuration file, but at least it isn't the root password. If you use this method, be sure to consider how privilege escalation will take place on the remote server. I know I haven't talked about escalating privilege yet, but if you have a password in the config file, that same password likely will be used to gain sudo access. So with one slip, you've compromised not only the remote user's account, but also potentially the entire system.
3) SSHing into a remote computer as a regular user, authenticating with a key pair that has an empty passphrase. This eliminates storing passwords in a configuration file, at least for the logging in part of the process. Key pairs without passphrases aren't ideal, but it's something I often do in an environment like my house. On my internal network, I typically use a key pair without a passphrase to automate many things like cron jobs that require authentication. This isn't the most secure option, because a compromised private key means unrestricted access to the remote user's account, but I like it better than a password in a config file.
4) SSHing into a remote computer as a regular user, authenticating with a key pair that is secured by a passphrase. This is a very secure way of handling remote access, because it requires two different authentication factors: 1) the private key and 2) the passphrase to decrypt it. If you're just running Ansible interactively, this might be the ideal setup. When you run a command, Ansible should prompt you for the private key's passphrase, and then it'll use the key pair to log in to the remote system. Yes, the same could be done by just using a standard password login and not specifying the password in the configuration file, but if you're going to be typing a password on the command line anyway, why not add the layer of protection a key pair offers?
5) SSHing with a passphrase-protected key pair, but using ssh-agent to "unlock" the private key. This doesn't perfectly answer the question of unattended, automated Ansible commands, but it does make a fairly secure setup convenient as well. The ssh-agent program authenticates the passphrase one time and then uses that authentication to make future connections. When I'm using Ansible, this is what I think I'd like to be doing. If I'm completely honest, I still usually use key pairs without passphrases, but that's typically because I'm working on my home servers, not something prone to attack.
There are some other considerations to keep in mind when configuring your SSH environment. Perhaps you're able to restrict the Ansible user (which is often your local user name) so it can log in only from a specific IP address. Perhaps your Ansible server can live in a different subnet, behind a strong firewall so its private keys are more difficult to access remotely. Maybe the Ansible server doesn't have an SSH server installed on itself so there's no incoming access at all. Again, one of the strengths of Ansible is that it uses the SSH protocol for communication, and it's a protocol you've all had years to tweak into a system that works best in your environment. I'm not a big fan of proclaiming what the "best practice" is, because in reality, the best practice is to consider your environment and choose the setup that fits your situation the best.
Privilege Escalation
Once your Ansible server connects to its clients via SSH, it needs to be able to escalate privilege. If you chose option 1 above, you're already root, and this is a moot point. But since no one chose option 1 (right?), you need to consider how a regular user on the client computer gains access. Ansible supports a wide variety of escalation systems, but in Linux, the most common options are sudo and su. As with SSH, there are a few situations to consider, although there are certainly other options.
1) Escalate privilege with su. For Red Hat/CentOS users, the instinct might be to use su in order to gain system access. By default, those systems configure the root password during install, and to gain privileged access, you need to type it in. The problem with using su is that although it gives you total access to the remote system, it also gives you total access to the remote system. (Yes, that was sarcasm.) Also, the su program doesn't have the ability to authenticate with key pairs, so the password either must be interactively typed or stored in the configuration file. And since it's literally the root password, storing it in the config file should sound like a horrible idea, because it is.
2) Escalate privilege with sudo. This is how Debian/Ubuntu systems are configured. A user in the correct group has access to
sudo a command and execute it with root privileges. Out of the box, this still has the problem of password storage or interactive typing. Since storing the user's password in the configuration file seems a little less horrible, I guess this is a step up from using su, but it still gives complete access to a system if the password is compromised. (After all, typing
sudo su - will allow users to become root just as if they had the root password.)
3) Escalate privilege with sudo and configure NOPASSWD in the sudoers file. Again, in my local environment, this is what I do. It's not perfect, because it gives unrestricted root access to the user account and doesn't require any passwords. But when I do this, and use SSH key pairs without passphrases, it allows me to automate Ansible commands easily. I'll note again, that although it is convenient, it is not a terribly secure idea.
4) Escalate privilege with sudo and configure NOPASSWD on specific executables. This idea might be the best compromise of security and convenience. Basically, if you know what you plan to do with Ansible, you can give NOPASSWD privilege to the remote user for just those applications it will need to use. It might get a little confusing, since Ansible uses Python for lots of things, but with enough trial and error, you should be able to figure things out. It is more work, but does eliminate some of the glaring security holes.
Implementing Your Plan
Once you decide how you're going to handle Ansible authentication and privilege escalation, you need to set it up. After you become well versed at Ansible, you might be able to use the tool itself to help "bootstrap" new clients, but at first, it's important to configure clients manually so you know what's happening. It's far better to automate a process you're familiar with than to start with automation from the beginning.
I've written about SSH key pairs in the past, and there are countless articles online for setting it up. The short version, from your Ansible computer, looks something like this:
# ssh-keygen
# ssh-copy-id -i .ssh/id_dsa.pub remoteuser@remote.computer.ip
# ssh remoteuser@remote.computer.ip
If you've chosen to use no passphrase when creating your key pairs, that last step should get you into the remote computer without typing a password or passphrase.
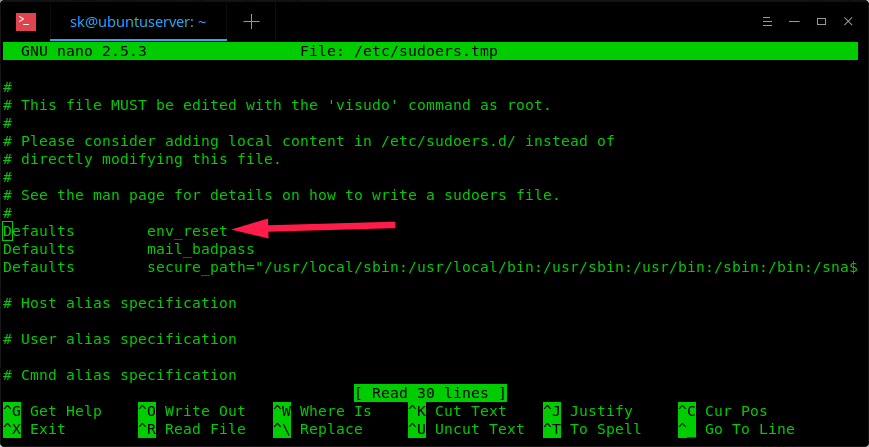
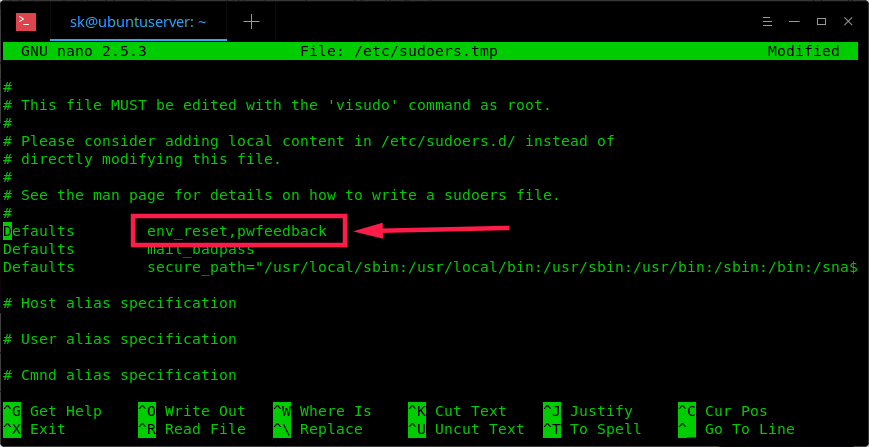
In order to set up privilege escalation in sudo, you'll need to edit the sudoers file. You shouldn't edit the file directly, but rather use:
# sudo visudo
This will open the sudoers file and allow you to make changes safely (it error-checks when you save, so you don't accidentally lock yourself out with a typo). There are examples in the file, so you should be able to figure out how to assign the exact privileges you want.
Once it's all configured, you should test it manually before bringing Ansible into the picture. Try SSHing to the remote client, and then try escalating privilege using whatever methods you've chosen. Once you have configured the way you'll connect, it's time to install Ansible.
Installing Ansible
Since the Ansible program gets installed only on the single computer, it's not a big chore to get going. Red Hat/Ubuntu systems do package installs a bit differently, but neither is difficult.
In Red Hat/CentOS, first enable the EPEL repository:
sudo yum install epel-release
Then install Ansible:
sudo yum install ansible
In Ubuntu, first enable the Ansible PPA:
sudo apt-add-repository spa:ansible/ansible
(press ENTER to access the key and add the repo)
Then install Ansible:
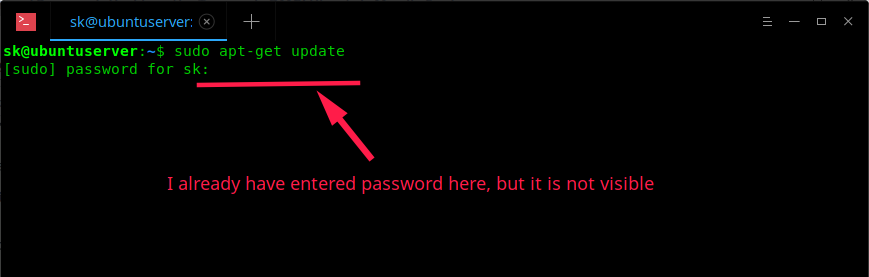
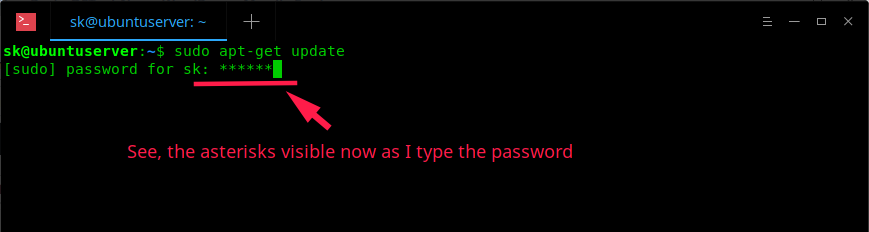
sudo apt-get update
sudo apt-get install ansible
Configuring Ansible Hosts File
The Ansible system has no way of knowing which clients you want it to control unless you give it a list of computers. That list is very simple, and it looks something like this:
# file /etc/ansible/hosts

[webservers]
blogserver ansible_host=192.168.1.5
wikiserver ansible_host=192.168.1.10

[dbservers]
mysql_1 ansible_host=192.168.1.22
pgsql_1 ansible_host=192.168.1.23
The bracketed sections are specifying groups. Individual hosts can be listed in multiple groups, and Ansible can refer either to individual hosts or groups. This is also the configuration file where things like plain-text passwords would be stored, if that's the sort of setup you've planned. Each line in the configuration file configures a single host, and you can add multiple declarations after the
ansible_host statement. Some useful options are:
ansible_ssh_pass
ansible_become
ansible_become_method
ansible_become_user
ansible_become_pass
The Ansible Vault
I also should note that although the setup is more complex, and not something you'll likely do during your first foray into the world of Ansible, the program does offer a way to encrypt passwords in a vault. Once you're familiar with Ansible and you want to put it into production, storing those passwords in an encrypted Ansible vault is ideal. But in the spirit of learning to crawl before you walk, I recommend starting in a non-production environment and using passwordless methods at first.
Testing Your System
Finally, you should test your system to make sure your clients are connecting. The ping test will make sure the Ansible computer can ping each host:
ansible -m ping all
After running, you should see a message for each defined host showing a
ping: pong if the ping was successful. This doesn't actually test authentication, just the network connectivity. Try this to test your authentication:
ansible -m shell -a 'uptime' webservers
You should see the results of the
uptime command for each host in the
webservers group.
In a future article, I plan start to dig in to Ansible's ability to manage the remote computers. I'll look at various modules and how you can use the ad-hoc mode to accomplish in a few keystrokes what would take a long time to handle individually on the command line. If you didn't get the results you expected from the sample Ansible commands above, take this time to make sure authentication is working. Check out
the Ansible docs for more help if you get stuck.


 A DNS leak poses a severe threat to your safety online. When using a VPN or another privacy service, you may assume you are safe and protected while it may not be the case.