Quantcast
Channel: Sameh Attia
Viewing all 1417 articles
Browse latest View live

Introduction To ELF In Linux: A Simple Guide To Executable Files

$
0
0

 https://ostechnix.com/elf-in-linux

Introduction To ELF In Linux: A Simple Guide To Executable Files

If you've ever wondered how programs run on Linux, you might be surprised to learn that a special file format called ELF, or Executable and Linkable Format, is at the heart of it all.

ELF files are essential for various types of files you encounter on your system, including executable files that launch programs, object files used during the programming process, shared libraries that allow multiple programs to use the same code, and core dumps that help diagnose crashes.

In this article, we'll break down what ELF is, how it works, and why it's so important for Linux users and developers.

We'll also look at the different kinds of ELF files, explain the structure of an ELF file in simple terms, and discuss why understanding ELF can help you better navigate and manage your Linux system.

Whether you're a beginner or just curious about the technical side of Linux, this guide will help you grasp the basics of ELF and its role in making your computer run smoothly.

What is ELF in Linux

In Linux, ELF stands for Executable and Linkable Format. It is a standard file format for executables, object code, shared libraries, and core dumps. Linux, along with other UNIX-like systems, uses ELF as the main format for binary files.

Executable and Linkable Format (ELF) in Linux

Here’s a breakdown of what ELF is used for and how it works:

1. Executable Files

ELF is the format for binary executables that can be run directly by the Linux operating system. It contains machine code that the CPU can execute.

2. Object Files

These are intermediate files generated by compilers (like gcc). They contain code and data that are not yet linked into a complete program. ELF serves as the format for these files, allowing linking tools like ld to create the final executable.

3. Shared Libraries

ELF files are used for shared libraries (.so files), which allow code to be reused across different programs without including it statically in each executable.

4. Core Dumps

When a program crashes, the Linux system may generate a core dump. This is an ELF file that contains the memory and state of the program at the time of the crash, which is useful for debugging.

Structure of an ELF File

An ELF file is divided into different sections, each with specific roles:

  • Header: Contains information about how to interpret the rest of the file.
  • Program Header: Describes segments that need to be loaded into memory.
  • Section Header: Provides details about individual sections like text (code), data, and symbol tables.
  • Text Segment: Contains the actual executable code.
  • Data Segment: Contains global variables and dynamic data used by the program.

The use of ELF simplifies program development and execution because it provides a unified format for both executables and libraries.

It also supports dynamic linking, which allows programs to use shared libraries at runtime, reducing memory usage and enabling easier updates.

You now know what ELF is, and you may be wondering how to view the details of ELF files. Believe me, it's easier than you might think.

Display Information about ELF Files

You can use several commands and tools in Linux to display information about ELF files. Some of the most common ones are file, readelf, and objdump.

1. Using the file Command

The file command quickly identifies the type of a file, including whether it’s an ELF file, and provides basic information about it.

file <filename>

Example:

file /bin/ls

Sample Output:

/bin/ls: ELF 64-bit LSB pie executable, x86-64, version 1 (SYSV), dynamically linked, interpreter /lib64/ld-linux-x86-64.so.2, BuildID[sha1]=15dfff3239aa7c3b16a71e6b2e3b6e4009dab998, for GNU/Linux 3.2.0, stripped
Display Information about ELF Files

2. Using the readelf Command

readelf is a more detailed tool specifically designed for examining the contents of ELF files. You can use it to display headers, section details, and more.

Basic usage:

readelf -h <filename>  # Displays ELF header information

Example:

readelf -h /bin/ls
Viewing Details of ELF File using readelf command

You can also use different flags to get more detailed information:

  • -S: Lists the sections in the ELF file.
  • -l: Displays the program headers (used by the loader).
  • -r: Shows the relocation entries.
  • -s: Displays the symbol table (if present).

Example:

readelf -S /bin/ls  # Lists all sections

3. Using the objdump Command

objdump is a more comprehensive tool that can disassemble ELF binaries and display information about them. It shows sections, disassembled code, and more.

Basic usage:

objdump -h <filename>  # Displays the section headers

Example:

objdump -h /bin/ls
Find Information about ELF File using objdump Command

Other useful flags:

  • -d: Disassembles the file and shows machine code.
  • -x: Displays all headers, including the ELF and section headers.
  • -s: Displays the contents of all sections (in hexadecimal).

Example:

objdump -d /bin/ls  # Disassemble and view the assembly code

Summary of Tools:

  • file: Quick summary of the file type and basic ELF details.
  • readelf: Detailed ELF file structure and headers.
  • objdump: Disassembling and more in-depth inspection of sections and headers.

These tools are typically pre-installed on most Linux distributions. If you need specific information, readelf and objdump will be your most detailed options.

Analyze ELF Binaries with Binsider

Apart from the pre-installed tools, there is a new TUI tool called Binsider to view and analyze BLF binaries in Linux. Binsider offers a comprehensive suite of features, including static and dynamic analysis, allowing users to examine the structure and behaviour of binaries.

Binsider provides a user-friendly terminal interface, enabling users to inspect strings, linked libraries, perform hexdumps, and modify binary data. The tool aims to empower users with the ability to understand the inner workings of ELF binaries and identify potentially interesting data. For more details, refer the following guide:

Why ELF is Important in Linux

For the average Linux user, knowing how to examine ELF files using tools like file, readelf, or objdump may not seem essential at first. But, there are practical situations where this knowledge becomes useful. Here's how it can help in everyday tasks:

1. Identifying File Types and Troubleshooting

Purpose:

Sometimes, a file might have no extension, or its extension could be misleading. Using the file command to determine whether it's an ELF binary, script, or data file can clarify what kind of file you are dealing with.

Example:

If you downloaded a file and are unsure whether it’s a valid executable or corrupted, file will quickly tell you whether it’s a valid ELF file.

file myfile

If the file is not an ELF executable, the command can guide you in troubleshooting further (e.g., figuring out if it's a text file or needs different handling).

2. Verifying System Executables

Purpose:

Using readelf or file allows you to inspect system binaries and libraries to verify they are in the expected format. For instance, after a system upgrade or during 
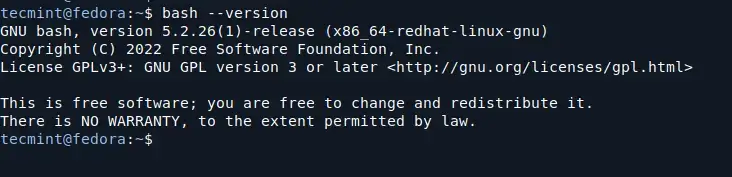
troubleshooting, you can ensure that your important binaries (e.g., /bin/bash, /bin/ls) are intact and correctly formatted as ELF files.

Example:

If a system utility is acting strangely, checking if the file is valid and has not been corrupted or replaced can help:

file /bin/bash

3. Understanding Program Dependencies

Purpose:

The readelf -l or objdump command helps identify the shared libraries an executable depends on. If a program fails to run due to missing libraries, this information is useful for troubleshooting missing dependencies.

Example:

If a program complains about missing libraries, running:

readelf -d /usr/bin/ls | grep NEEDED

Will show which libraries are required, helping you install any missing ones.

Sample Output:

 0x0000000000000001 (NEEDED)             Shared library: [libselinux.so.1]
 0x0000000000000001 (NEEDED)             Shared library: [libc.so.6]

4. Analyzing Security and Permissions

Purpose:

Checking whether a binary is dynamically or statically linked, or whether it has unusual headers, can be useful for advanced users concerned about security.

Example:

If you suspect that a binary has been tampered with or could contain malicious code, inspecting its ELF structure using readelf could give insight into whether it behaves unexpectedly, such as having uncommon sections or unknown dependencies.

5. Debugging and Development

Purpose:

For users doing any kind of development, including scripting or compiling, knowing the ELF structure is useful for debugging. Tools like readelf help ensure that your compiled code links properly, uses the correct libraries, and behaves as expected.

Example:

When compiling your own software, you can inspect object files (.o) or the final binary:

readelf -h myprogram

6. Diagnosing Crashes or Core Dumps

Purpose:

If a program crashes and creates a core dump (an ELF file), you can inspect the core dump to analyze the state of the program at the time of the crash, making it easier to identify the cause of the failure.

Example:

If you want to analyze a core dump, running:

readelf -h <core>

provides a starting point for understanding the crash.

7. Performance Optimization

Purpose:

Advanced users looking to optimize their systems can analyze binaries to see if they’re dynamically linked or statically linked, how many sections are loaded into memory, and other performance-related characteristics.

Example:

Using objdump to inspect the machine code or linked sections of a program can help users or developers identify inefficient code.

For an average Linux user, these commands may not be used daily, but they become handy when troubleshooting system issues, verifying file integrity, understanding program dependencies, or debugging software.

Conclusion

The Executable and Linkable Format (ELF) is an important part of how Linux works. It helps your computer run programs smoothly by organizing different types of files, like executable files, object files, shared libraries, and core dumps. Understanding ELF can make it easier for you to troubleshoot issues and optimize your system.


11 Useful X-window (GUI Based) Linux Commands – Part I

$
0
0

 https://www.tecmint.com/x-based-commands-for-linux

11 Useful X-window (GUI Based) Linux Commands – Part I

We, the Tecmint Team, are dedicated to creating high-quality articles about Linux and open-source topics. Since we started, we’ve put in a lot of effort to provide our readers with useful and interesting information. We’ve also created many shell programs, from fun commands to helpful tools.

Here are some of our most notable examples:

In this article, we will provide a few X-based commands that are generally available in most standard distributions today. If you find that any of the X-based commands listed below are not installed on your system, you can always use apt or yum to install the required packages.

1. xeyes Command

The xeyes command displays a graphical pair of eyes that follow your mouse movements. While it may seem more amusing than useful, its novelty makes it enjoyable to use.

Simply run xeyes in the terminal and watch the eyes track your mouse pointer.

xeyes
Xeyes - Show Graphical Pair of Eyes
Xeyes – Show a Graphical Pair of Eyes

2. xfd Command

The xfd command displays all the characters in a specified X font. It creates a window showing the name of the font being displayed.

xfd -fn fixed
Using xfd to Display Fonts

3. xload Command

The xload command outputs a graphical representation of the system load average for the X server, which is an excellent tool for monitoring real-time average system load.

xload -highlight blue
xload - Visualize System Load on Linux
xload – Visualize System Load on Linux

4. xman Command

Most users are familiar with the man command for accessing manual pages. However, many may not know that there is an X version called xman, which provides a graphical interface for man pages.

xman -helpfile cat
Xman: A Graphical Interface for Man Pages

5. xsm Command

The xsm command stands for “X Session Manager“, which acts as a session manager, grouping applications that refer to a particular state.

xsm
xsm - Managing X Sessions
xsm – Managing X Sessions

6. xvidtune Command

The xvidtune command is a video mode tuner for Xorg, which provides a client interface to the X server’s video mode extension.

xvidtune
xvidtune: A Video Mode Tuner for Xorg

Note: Incorrect use of this program can cause permanent damage to your monitor and/or video card. If you don’t know what you are doing, avoid making changes and exit immediately.

7. xfontsel Command

The xfontsel application provides a simple way to display the fonts known to your X server.

xfontsel
xfontsel to List Fonts on Your X Server

8. xev Command

The xev command stands for “X events“, which prints the content of X events, helping users understand input events generated by the X server.

xev
xev - Analyze X Events
xev – Analyze X Events

9. xkill Command

The xkill command allows you to kill a client application by clicking on its window, which can be particularly useful for terminating unresponsive applications quickly.

xkill

10. xset Command

The xset command is used to set various user preferences for the X server, that can be used to control keyboard and mouse settings, including screen saver options.

xset q

11. xrandr Command

The xrandr command is a command-line interface to the X11 Resize and Rotate extension, which can be used to set the size, orientation, and reflection of the outputs for a screen.

xrandr
Conclusion

That’s all for now! We plan to post at least one more article (Useful X-based Commands) in this series, and we are actively working on it. Until then, stay tuned and connected to Tecmint.

Don’t forget to share your valuable feedback in our comment section.

Article 1

$
0
0

 https://www.rosehosting.com/blog/best-open-source-hosting-control-panels-for-2024

Best Open Source Hosting Control Panels for 2024

Best Open Source Hosting Control Panels for 2024

What are the best open-source hosting control panels in 2024? With a slew of options to choose from, we’ll cover the most popular ones to help you reach a decision. A web hosting control panel is software for system administrators, developers, and website users alike. Their primary use lies in managing the server and software on those servers, such as websites and webmail.

Managing the server via the control panel offers many features, including

  • User account management
  • Database management
  • File management
  • Domains adding and forwarding
  • Modifying PHP settings,
  • Changing DNS settings
  • Installing SSL certificates
  • Monitoring uptime
  • …and much more

Hestia Control Panel

The Hestia Control panel is a free and open-sourced hosting control panel that is a fork of the Vesta control panel. It offers a variety of features and has become a significant competitor to premium paid control panels. Using the Hestia Control panel is cost-effective because it provides almost the same features as the paid ones, such as managing user accounts, installing SSL certificates, backups, CMS installations in one click, DNS zone management, etc.

Hestia Control panel supports Ubuntu 22.04, Ubuntu 20.04, Debian 10, 11, and 12. Installation of the Hestia CP is simple: download and execute the bash script, which may take up to 15 minutes. Once the panel is installed it can be accessed on the IP address and the port 8083 using the admin username and password displayed after completion of the installation. The Hestia Control panel is modern and easy to use, and you will not regret choosing it.

Webmin

Webmin is a free and open-sourced hosting control panel developed among the oldest control panels. It offers several features, including Support for cloud and virtualized environments, Interface customization, a File manager, Backup configuration, SSH configuration, Apache management, MySQL management, FTP management, and firewall configuration. Webmin is suitable for system administrators with more experience than beginners. It is not a beginner-friendly control panel, but the offered and free features make it one of the most used open-sourced web hosting panels.

CyberPanel

The cyber panel is a free and open-sourced hosting control panel developed and powered by OpenLiteSpeed. Its interface is modern and user-friendly and has many features for managing Users, Websites, Packages, Databases, DNS, Email, FTP, Backup, Incremental Backup, SSL, and many more. One thing that makes this control panel unique is its LiteSpeed Web server, among the Apache and Nginx. Also, this control panel is suitable for developers because it offers Docker management containerization and a staging environment for websites. One-click installations exist for the most popular applications, such as WordPress, Joomla, and Drupal. On top of all, CyberPanel offers a graphic interface for Docker application management. It is entirely free, and choosing it will make your work easier.

Ajenti

Ajent is a free, open-source hosting control panel with a fast and responsive web interface. It is built to configure and monitor services such as Apache, MySQL, Nginx, FTP, File System Management, Firewall, and many more system administrator-related tasks. Ajenti supports Debian greater than Debian 9, Ubuntu 18.04 or later, and AlmaLinux 8. The interface is similar to the Webmin interface, but the one thing that makes this control panel usable is that it has a mobile-friendly interface, and you can manage your server through your mobile device.

ISPConfig

ISPConfig, is a free and open-sourced control panel. It provides a vibrant feature set such as load balancing, clustering, user and reseller management, DNS service, and Database services, and works with Apache and Nginx from the web servers. ISPConfig is best suited for system administrators and advanced users. It has vast community support and is supported on Debian 10, Debian, 11, Debian 12, Ubuntu 18.04, Ubuntu 20.04, and Ubuntu 22.04

aaPanel

aaPanel is a free and open-sourced hosting control panel that offers the most features of the other free control panels. The features are divided in categories such as Core Functions, Website Manager, Environment, System Tools, aaPanel plugin, Storage plugin, and one-click deploy website. Let’s explain these in more detail:

Core Functions: This section is about the LAMP, LEMP stacks, Database manager, FTP Manager, Crontab manager, File System etc.

Website manager: In this section, we have Backup and restore as features, PHP management, ReverseProxy, Redirects, SSL installation, etc

Environment: This section manages phpMyAdmin, MongoDB, Memcached, Tomcat, PureFTP, Redis, PM2 manager, and many more.

System Tools: The System Tools section contains a Firewall, Logs, Supervisor, and Linux Tools.

aaPanel Plugin: The aaPanel section includes features such as One-click migration, One-Click website deployment, SSH Terminal, DNS Manager, Fail2ban, etc.

Storage plugin: This is for storage only. From storage, you are offered FTP storage, AWS S3 storage, GoogleCloud Storage, and Google Drive storage.

One-click deploy website: With one-click deploy, we can install the most popular software, such as WordPress, Laravel, Joomla, Drupal, Roundcube, etc.

Conclusion

We discussed the most used and best open-source hosting control panels in the previous paragraphs. Before you choose the right control panel, you can always find a tutorial on our blog on how to install it on your computer or virtual machine and test it. Of course, suppose you do not have experience with any Linux distro and control panels. In that case, you can always contact us, and our admins will help you with any aspect of it, like installation, configuration of your control panel, etc. You simply sign up for one of our NVMe VPS plans and submit a support ticket. We are available via live chat and tickets 24/7.

If you liked this post about the Best Open-Source Hosting Control Panels for 2024, please share it with your friends or leave a comment below.

Tags , , , , , , ,


Article 0

$
0
0

https://www.rosehosting.com/blog/fstab-options

Fstab options: What are they, and when should you use them?

Fstab Options

What is fstab in Lunix? What are fstab options, and when should you use them? Our latest tutorial covers all the fstab details and everything you need to know about this file. Let’s get straight into it.

Table of Contents

What is fstab?

Fstab stands for files system table and is a system file found in the /etc directory on the Linux server. The fstab file lists the available disk partitions and other disk-related file systems.

The mount command reads it and automatically mounts most entries during system boot. A set of rules in the fstab command controls how the system treats different filesystems each time it introduces them. The system administrators handle the maintenance of the fstab command.

The structure of the fstab command

Fstab stands for files system table. The six-column structure of that table requires setting up parameters in each column in the correct order. We will explain the columns separately, and important to know is that they are as follows from left to right:

[Device] [Mount Point] [File System Type] [Options] [Dump] [Pass]

Let’s explain all these in more detail:

Device: The UUID of the mounted device. (sda, sdb, etc.)

Mount Point: Your root file system mounts the device on this directory. The names of the mount points must not have spaces between them.

File System Type: Type of file system. It can be vfat, ntfs, ext4, ext3, etc.

Options: Options depend on the file system. It lists any active mount options. If there are multiple options, they must be separated by commas.

Dump (Backup Operation): The backup operation can have two values, 0 OR 1. If the value is 0, then there is no backup. It is disabled. Otherwise, if it is 1, then the backup of the partition is enabled. System administrators set this field to 0, as it uses an obsolete method they should avoid.

Pass (File System Check Order): The file system check determines the partition checking order during system boot. If the value is 0, then the fsck (file system check) will not check the filesystem. If the value is higher than 0 and is 1, then the order check should be set for the root filesystem. The other partitions should be set with 2, etc.

The usage of the fstab command

System administrators use the fstab for internal devices, CD/DVD drives, and network shares. Additionally, system administrators can add removable devices to fstab. System administrators configure partitions listed in fstab to mount automatically during boot. Only root users can see and mount partitions not listed in fstab. As we already explained the structure of the fstab command, we will now look at the content of the /etc/fstab file. To do that, execute the following command:

cat /etc/fstab

You should get an output similar to this:

root@host:~# cat /etc/fstab 
# /etc/fstab: static file system information.
#
# Use 'blkid' to print the universally unique identifier for a
# device; this may be used with UUID= as a more robust way to name devices
# that works even if disks are added and removed. See fstab(5).
#
# systemd generates mount units based on this file, see systemd.mount(5).
# Please run 'systemctl daemon-reload' after making changes here.
#
#                
# / was on /dev/vda1 during installation
UUID=1fa0d2dd-2039-44cf-bd49-c2c765693d9a / ext4 errors=remount-ro 0 1     1
/dev/vda2    none    swap    sw  0   0

As you can see, the fstab has the following parameters:

Device: UUID=1fa0d2dd-2039-44cf-bd49-c2c765693d9a

Mount Point: /

File System Type: ext4

Options: errors=remount-ro

Dump (Backup Operation): 0

Pass (File System Check Order): 1

Useful Commands

There are some useful commands that you can use for listing drives, mounting, and creating mount points.

1. To get a list of all UUIDs, you can use the following command:

ls -l /dev/disk/by-uuid

You will get an output similar to this:

root@host:~# ls -l /dev/disk/by-uuid
total 0
lrwxrwxrwx 1 root root 10 Aug 10 06:34 1fa0d2dd-2039-44cf-bd49-c2c765693d9a -> ../../vda1
lrwxrwxrwx 1 root root 10 Aug 10 06:34 706a6c4b-2cb1-4de0-899d-1e858ac12204 -> ../../vda2

2. To list the drivers and relevant attached partitions, you can use the command below:

sudo fdisk -l

Giving you an output similar to the below:

root@host:~# fdisk -l
Disk /dev/vda: 80 GiB, 85899345920 bytes, 167772160 sectors
Units: sectors of 1 * 512 = 512 bytes
Sector size (logical/physical): 512 bytes / 512 bytes
I/O size (minimum/optimal): 512 bytes / 512 bytes
Disklabel type: dos
Disk identifier: 0x076a3d03

Device     Boot     Start       End   Sectors  Size Id Type
/dev/vda1  *         2048 165675008 165672961   79G 83 Linux
/dev/vda2       165675009 167772159   2097151 1024M 82 Linux swap / Solaris

3. To mount all file systems in /etc/fstab, you can use the following command:

sudo mount -a

4. To create a new mount point, using root privileges, you can use the command below:

sudo mkdir /path/to/mountpoint

5. To check the content of the fstab, we already mentioned the command in the previous paragraph:

cat /etc/fstab

Any other fstab options?

Of course. Though these are some basic fstab options for entry-level use on a Linux OS. If you have any other suggestions or questions, drop a comment down below and we’ll try to help out as soon as we can.

If you have issues using command-line code, you can always contact our technical support. All our fully-managed plans include 24/7 support, and our admins will help you immediately.


Rsnapshot: A Powerful Backup Tool Based on Rsync

$
0
0

https://www.tecmint.com/rsnapshot-a-file-system-backup-utility-for-linux

Rsnapshot is an open-source local/remote filesystem backup utility written in Perl, which leverages the power of Rsync and SSH to create scheduled incremental backups of Linux/Unix filesystems.

Rsnapshot only takes up the space of a single full backup plus the differences, allowing you to store backups on a local drive, external USB stick, NFS-mounted drive, or over the network to another machine via SSH.

In this article, we’ll walk you through the process of installing, setting up, and using Rsnapshot to create hourly, daily, weekly, and monthly local backups, as well as remote backups.

Installing Rsnapshot Backup in Linux

First, you need to install and enable the EPEL (Extra Packages for Enterprise Linux) repository, as Rsnapshot is not included by default in RHEL-based distributions.

sudo dnf install epel-release
sudo dnf install rsnapshot

On Ubuntu-based distributions, rsnapshot is available in the default repositories, so you can install it using the apt package manager:

sudo apt install rsnapshot

Once installed, you can verify the installation by checking the version.

rsnapshot -v

Setting Up SSH Passwordless Login

To back up remote Linux servers, you need to configure SSH for passwordless login between the backup server and the remote machine.

Generate SSH public/private key pairs by following these commands:

ssh-keygen -t rsa

Next, copy the public key to the remote server:

ssh-copy-id user@remote-server

Configuring Rsnapshot in Linux

The configuration file for rsnapshot is located in /etc/rsnapshot.conf, open this configuration file with a text editor like nano or vim:

sudo nano /etc/rsnapshot.conf
OR
sudo vi /etc/rsnapshot.conf

Some of the important settings you’ll need to configure include:

Snapshot Backup Directory

To set the directory where your backups will be stored, you need to edit the snapshot_root line in the configuration file.

snapshot_root   /data/backup/

Set Backup Intervals

Rsnapshot supports multiple backup intervals like daily, weekly, and monthly. You can set how often you want your backups by uncommenting the following lines:

interval    hourly    6
interval    daily     7
interval    weekly    4
interval    monthly   3

Set Backup Directories

To back up local directories, add the directory paths.

backup    /home/     localhost/
backup    /etc/      localhost/

For remote backups, specify the remote server and directory to back up, like so:

backup    root@remote-server:/home/     /data/backup/

Enable Remote Backups

To enable remote backups over SSH, uncomment the cmd_ssh line:

cmd_ssh    /usr/bin/ssh

If you have changed the default SSH port, update the ssh_args line to reflect the custom port (e.g., port 7851):

ssh_args    -p 7851

Exclude Files and Directories

You can exclude certain files and directories from being backed up by creating an exclude file.

sudo nano /data/backup/exclude.txt

Add exclusions in the following format:

- /var/cache
- /tmp
+ /etc
+ /home

In your rsnapshot.conf file, reference the exclude file:

exclude_file    /data/backup/exclude.txt

After configuring Rsnapshot, verify that your setup is correct by running:

sudo rsnapshot configtest

You should see the message “Syntax OK“. If there are any errors, fix them before proceeding.

Finally, you can run Rsnapshot manually using the command for the interval you want to back up:

sudo rsnapshot hourly

Automating Rsnapshot with Cron

To automate the backup process, configure cron jobs to run Rsnapshot at specific intervals by adding the following to your /etc/cron.d/rsnapshot file:

0 */4 * * *    root    /usr/bin/rsnapshot hourly
30 3 * * *     root    /usr/bin/rsnapshot daily
0 3 * * 1      root    /usr/bin/rsnapshot weekly
30 2 1 * *     root    /usr/bin/rsnapshot monthly

Setting Up Rsnapshot Reports

Rsnapshot includes a script to send backup reports via email. To set it up, copy the script and make it executable:

sudo cp /usr/share/doc/rsnapshot/utils/rsnapreport.pl /usr/local/bin/
sudo chmod +x /usr/local/bin/rsnapreport.pl

Now, edit your rsnapshot.conf file and add the --stats flag to the rsync_long_args section:

rsync_long_args --stats --delete --numeric-ids --delete-excluded

Then, add the report to your cron job to email the report:

0 */4 * * * root /usr/bin/rsnapshot hourly 2>&1 | /usr/local/bin/rsnapreport.pl | mail -s "Hourly Backup Report" you@example.com

Monitoring Rsnapshot Backups

You can monitor your backups by checking the log files. By default, Rsnapshot logs backup activities in /var/log/rsnapshot.log.

cat /var/log/rsnapshot.log
Conclusion

Rsnapshot is an excellent choice for managing backups on Linux systems. With its efficient use of rsync, you can easily back up your files locally and remotely.

DTrace 2.0 Arrives On Gentoo Linux

$
0
0

https://ostechnix.com/dtrace-2-0-arrives-on-gentoo-linux

Exciting news for Gentoo Linux users! DTrace 2.0, the powerful dynamic tracing tool, is now available on Gentoo. This means you can now analyse and debug your system, both the kernel and userland applications, with ease. Whether you're tackling performance bottlenecks or troubleshooting unexpected behaviour, DTrace has you covered.

What is DTrace?

DTrace allows you to dynamically trace your running system, capturing valuable insights into its operation. It works by attaching to specific points in the kernel or userland applications, known as probes, and recording data when these probes are triggered. This data can include timestamps, stack traces, function arguments, and more, providing a wealth of information to help you understand your system's behaviour.

Gentoo Embraces DTrace 2.0

Gentoo has fully embraced DTrace 2.0, making it incredibly easy to get started. Simply install the dev-debug/dtrace package and you're ready to go. The newest stable Gentoo distribution kernel already has all the necessary kernel options enabled, simplifying the setup process even further. If you're compiling your kernel manually, the DTrace ebuild will guide you through the required configuration changes.

Power of eBPF

Under the hood, DTrace 2.0 for Linux leverages the Extended Berkeley Packet Filter (eBPF) engine of the Linux kernel. eBPF is a powerful and versatile technology that enables efficient and safe in-kernel program execution. By utilizing eBPF, DTrace 2.0 delivers performance and security benefits.

Getting Started with DTrace

Gentoo provides extensive documentation and resources to help you get started with DTrace. The Gentoo Wiki DTrace page offers a comprehensive overview, while the DTrace for Linux GitHub page delves into the technical details. Additionally, the original documentation for Illumos, where DTrace originated, provides valuable insights.

Learn and Explore

With DTrace 2.0 now readily available on Gentoo, there's never been a better time to explore the dynamic tracing. Gentoo's support for DTrace empowers users with a powerful toolset for understanding, analysing, and debugging their systems. Get started with DTrace today and unlock a deeper level of system knowledge!

Resource:

rbash – A Restricted Bash Shell Explained with Practical Examples

$
0
0

https://www.tecmint.com/rbash-restricted-bash-shell

rbash – A Restricted Bash Shell Explained with Practical Examples

In the world of Linux and Unix-like systems, security is crucial, especially when multiple users share a system. One way to enhance security is by using restricted shells. One such shell is rbash, or Restricted Bash.

This article will explain what rbash is, how it differs from the regular Bash shell, and provide practical examples of its usage.

What is a Shell?

Before diving into rbash, let’s clarify what a shell is.

A shell is a program that enables users to interact with the Linux system through a command-line interface. It interprets commands entered by the user and communicates with the system to execute those commands.

Bash (Bourne Again SHell) is one of the most widely used shells in Linux environments.

What is rbash?

rbash is a restricted version of the Bash shell, which is designed to limit users’ access to certain commands and features, enhancing system security.

When a user logs into a system using rbash, they cannot perform tasks that could compromise the system or other users.

Key Differences Between Bash and rbash

Following are some key differences between bash and rbash:

  • In rbash, users cannot change their directory with the cd command. They can only operate in their home directory.
  • Certain commands like exec, set, and unset are restricted, preventing users from altering the shell’s environment.
  • Users cannot change environment variables that can affect other users or system settings.
  • In rbash, users cannot redirect input or output, making it harder to execute commands that can access or manipulate files outside their designated areas.

These restrictions make rbash suitable for scenarios where you want to provide limited access to users while maintaining a level of security.

When to Use rbash

Here are some situations where using rbash is beneficial:

  • Public Terminals: In environments like libraries or schools where users need access to basic commands but should not tamper with system settings.
  • Shared Servers: On shared systems, rbash can prevent users from accessing other users’ data or critical system files.
  • Testing and Learning Environments: When teaching users basic command-line skills, rbash can help limit their actions to avoid accidental system changes.

How to Set Up rbash in Linux

Setting up rbash on your Linux system is a straightforward process, all you need to do is follow these steps:

1. Install Bash in Linux

Most Linux distributions come with Bash installed by default, you can check if it’s installed by running:

bash --version
Check Bash Version
Check Bash Version

2. Create a Restricted Shell User

You can create a user specifically for rbash.

sudo adduser anusha
Create a Restricted Shell User

After creating the user, change their default shell to rbash:

sudo usermod -s /bin/rbash restricteduser

To further restrict this user’s environment, you can create a specific directory and set it as their home directory:

sudo mkdir /home/anusha/bin

Then, you can place any scripts or commands you want the user to access inside this bin directory.

To limit the commands available to the user, set their PATH variable to only include the bin directory:

echo 'export PATH=$HOME/bin' | sudo tee -a /home/anusha/.bashrc

Now, you can log in as a restricted user:

su - anusha

How to Use rbash in Linux

Let’s explore some practical examples to illustrate how rbash works.

Example 1: Attempting to Change Directory

Once logged in as the restricted user, try changing directories:

cd /tmp

You will receive an error message like -rbash: cd: restricted, which confirms that the user cannot navigate outside their home directory.

Example 2: Running Restricted Commands

Try executing commands like exec or set:

exec bash

You will get an error like -rbash: exec: restricted, which shows that the user is restricted from executing new shell instances.

Example 3: File Redirection

Attempt to redirect output to a file:

echo "Test"> test.txt

You will receive an error message that indicates that users cannot redirect output to files.

-rbash: test.txt: restricted: cannot redirect output

Example 4: Allowed Commands

To see what commands the restricted user can execute, you can create a simple script in their bin directory.

For example, create a file named hello.sh:

echo "echo 'Hello, World!'"> /home/restricteduser/bin/hello.sh
chmod +x /home/restricteduser/bin/hello.sh

Now, when the restricted user runs:

./hello.sh

They will see Hello, World! printed on the screen, demonstrating that they can execute allowed commands.

Conclusion

In summary, rbash is a powerful tool for enhancing security in multi-user Linux environments. By restricting access to certain commands and features, it helps maintain system integrity while allowing users to perform basic tasks.


How to Redirect URLs Using Nginx

$
0
0

https://www.rosehosting.com/blog/how-to-redirect-urls-using-nginx

How to Redirect URLs Using Nginx

How to redirect URLs using Nginx

URL redirection, also called URL forwarding, allows multiple URL addresses to be associated with a single page. This can include a form, the entire website, or a web application. This functionality is executed through a specialized HTTP response called an HTTP redirect. Redirecting URLs involves pointing an existing URL to a new one. This effectively communicates to your visitors and search bots that the URL has a new destination. This redirect can be either a temporary or a permanent redirection. Nginx, a web server, has gained more and more popularity over the past few years. It was initially created as a high-performance web server. Using an asynchronous event-driven architecture, Nginx can increase speed and stability when handling high traffic. This article will show you how to redirect URLs using nginx in an easy-to-follow guide.

Prerequisites

  • Linux VPS hosting with Nginx as the web server
  • SSH root access or a normal system user with sudo privileges

Redirection Types

There are only two redirection types: permanent and temporary. The permanent redirection has HTTP code 301, while the temporary redirection has HTTP code 302. The difference between 301 and 302 redirects lies in how they affect the redirection of URLs on a website. This can have a significant impact on your on-page SEO. To clarify, below is an explanation of the differences between 301 and 302 redirects in detail:

Permanent Redirect (301)

As the name indicates, a permanent redirect means the old URL will no longer be used. Visitors will be permanently redirected to the new URL. This means that when visitors access the old URL, they will be automatically redirected to the new URL.

301 redirects also tell search engines that the old URL page has been made permanent and redirected to the new URL. Search engines will pass on any link authority directly from the old URL to the new URL. A 301 redirects are usually used for website pages that have been moved to a new URL or permanently deleted. This is akin to moving your house permanently and letting everyone know your new address.

Temporary Redirect (302)

Redirect 302 is known as a “temporary redirect”. This means the old URL has been moved, and visitors are redirected to the new URL, just like with a 301.

The difference is that a 302 tells search engines that the old URL page is only temporarily redirected to the new URL. This signals to search engines that the old URL will return and will still maintain the page’s ranking of the old URL. As such, a 302 redirect is typically used for website pages that will return to the original URL after a while. Think of this as leaving your house when you go on an extended vacation and have your mail sent there.

Redirects are helpful when you send website visitors to a different URL according to the page they are trying to access. Here are some popular reasons to use them:

  • Reroute visitors from discontinued pages (which would otherwise show a 404 error) to the most similar page.
  • Keep old URLs operational after moving from one software system to another.
  • Take visitors from a short and simple, memorable URL to the correct page.
  • Redirecting outdated .html URLs or non-www to their www counterparts.
  • Retain seasonal page content with limited-time deals; the same offer will return next season. Think of Black Friday count-down timer pages.

When using Nginx as the web server, you can generally create redirects using rewrite or return directives. Incorporating a redirect map can be beneficial for extensive redirect lists.

Use RETURN Directive

We can use the return directive in the server context to redirect HTTP to HTTPS or from one domain name to another.

server {
listen 80;
server_name example.com www.example.com;
return 301 https://example.com$request_uri;
}

The following configuration should also work if you want to redirect a URL to another.

location = /blog/how-to-redirect-in-nginx {
return 301 $scheme://blog.example.com/how-to-redirect-in-nginx
}

Use REWRITE Directive

We can place both RETURN and REWRITE directives in the server and location context in the Nginx configuration file.

server {
listen 80;
server_name example.com www.example.com;
rewrite ^/(.*)$ https://example.com/$1 redirect;
}

We can use the above config to redirect HTTP to HTTPS temporarily. To change it to a permanent redirect, simply replace redirect with permanent.

Another example is to redirect a URL using rewrite, but this time, we use location context.

Need a fast and easy fix?
✔ Unlimited Managed Support
✔ Supports Your Software
✔ 2 CPU Cores
✔ 2 GB RAM
✔ 50 GB PCIe4 NVMe Disk
✔ 1854 GeekBench Score
✔ Unmetered Data Transfer
NVME 2 VPS

Now just $43 .99
/mo

GET YOUR VPS
location = /how-to-redirect-in-nginx {
rewrite ^/how-to-redirect-in-nginx?$ /redirection-in-nginx.html break;
}

Use MAP Directive

If you have many redirections, you can use Nginx MAP directive. Add the following to the top of your Nginx server block file.

map $request_uri $new_uri {
include /etc/nginx/redirect-map.conf;
}

Then, create a file /etc/nginx/redirect-map.conf, and you can put your old and new URLs there.

The file /etc/nginx/redirect-map.conf should contain something like this:

/blog/how-to-redirect-in-nginx /nginx-redirect;
/old.html /new.html;
/old-file.php /new-file.php;

Make sure to check the map file, it should contain ‘;’ at the end of each line or else it causes EOL error. Also, remember that you should restart Nginx every time you modify its configuration file to apply the changes.

That’s it! You have learned about configuring URL redirects in Nginx.

Of course, you don’t have to spend your time and follow this article to learn how to redirect URLs using Nginx. If you have an active VPS hosting service with us, you can ask our expert Linux admins to redirect URLs using Nginx for you. Simply log in to the client area, then submit a ticket. Our system administrators are available 24×7 and will take care of your request immediately.

If you liked this post on how to redirect URLs using Nginx, please share it with your friends on social media or leave a comment below.

Tags , , , , , ,


How to Enable and Manage Clipboard Access in Vim on Linux

$
0
0

https://www.tecmint.com/enable-clipboard-in-vim

How to Enable and Manage Clipboard Access in Vim on Linux

Vim is a powerful text editor that many programmers and writers use because of its features and efficiency. One useful feature is the ability to access and share clipboard contents across multiple instances of Vim.

In this article, we’ll explore how to enable clipboard access in Vim and manage clipboard contents effectively from the Linux terminal.

What is Clipboard Access in Vim?

Clipboard access in Vim allows you to copy and paste text between different Vim instances or even between Vim and other applications. By default, Vim may not have access to the system clipboard, so you’ll need to make some changes to enable this feature.

There are generally two clipboards in Linux systems:

  • Primary Clipboard: This is the default clipboard that automatically saves selected text. You can paste it using the middle mouse button.
  • Clipboard (X11 Clipboard): This clipboard is what most graphical applications use, and you typically access it with keyboard shortcuts like Ctrl + C for copy and Ctrl + V for paste.

Checking for Clipboard Support in Vim

First, ensure that you have a version of Vim that supports clipboard access.

vim --version | grep clipboard
Check Vim Clipboard Support

If you see +clipboard, it means Vim has clipboard support. If you see -clipboard, you will need to install a version of Vim with clipboard support, such as vim-gtk, vim-gnome, or vim-athena.

Installing Vim with Clipboard Support

If you need to install a version with clipboard support, you can use the following appropriate command for your specific Linux distribution.

sudo apt install vim-gtk3        [On Debian, Ubuntu and Mint]
sudo dnf install vim-X11         [On RHEL/CentOS/Fedora and Rocky/AlmaLinux]
sudo apk add vim                 [On Alpine Linux]
sudo pacman -S gvim              [On Arch Linux]
sudo zypper install vim-X11      [On OpenSUSE]    
sudo pkg install vim             [On FreeBSD]

Using the Clipboard in Vim

Once you have the correct version of Vim installed, you can use the clipboard in Vim by following these steps:

Copying to the Clipboard

To copy text from Vim to the system clipboard, use the following command:

  • Visual Mode: Enter Visual mode by pressing v (for character selection) or V (for line selection).
  • Select Text: Use arrow keys or h, j, k, l to select the text you want to copy.
  • Copy to Clipboard: Press “+y (double quotes followed by a plus sign and y for yank).

Pasting from the Clipboard

To paste text from the clipboard into Vim, use the following command:

  • Place the cursor where you want to insert the text.
  • Press “+p (double quotes followed by a plus sign and p for put).

Here’s a simple example to illustrate how to copy and paste:

1. Open a new instance of Vim:

vim file1.txt

2. In file1.txt, type some text:

Hello, this is Vim.

3. Select the text with v and use “+y” to copy it.

4. Open another instance of Vim with a different file:

vim file2.txt

5. Place the cursor in file2.txt and press “+p” to paste the copied text.

Using System Clipboard with Multiple Vim Instances

You can use the system clipboard to share text between different instances of Vim and other applications.

Accessing Clipboard Contents from Terminal

You can also access clipboard contents from the terminal using commands like xclip or xsel.

sudo apt install xclip         [On Debian, Ubuntu and Mint]
sudo yum install xclip         [On RHEL/CentOS/Fedora and Rocky/AlmaLinux]
sudo apk add xclip             [On Alpine Linux]
sudo pacman -S xclip           [On Arch Linux]
sudo zypper install xclip      [On OpenSUSE]    
sudo pkg install xclip         [On FreeBSD]

Copying to Clipboard via Terminal

You can copy the contents of a file to the clipboard directly from the terminal:

cat filename.txt | xclip -selection clipboard

Pasting from Clipboard via Terminal

To paste clipboard contents into a file, you can use:

xclip -selection clipboard -o > filename.txt
Conclusion

Accessing clipboard contents across multiple instances of Vim is a valuable feature that can enhance your productivity. By enabling clipboard support in Vim and using the right commands, you can easily copy and paste text between different files and applications.

With the additional tools like xclip, you can further manage clipboard contents directly from the terminal. Now you can work more efficiently with Vim and make the most out of its powerful features!


How To Create Aliases In Linux: A Beginners Guide

$
0
0

https://ostechnix.com/create-aliases-in-linux

How To Create Aliases In Linux: A Beginners Guide

Creating aliases in Linux is a great way to save time and make your command line experience more efficient. Whether you're using Bash, Zsh, or Fish, this guide will show you how to create and manage aliases easily.

What is an Alias?

An alias is a shortcut for a longer command. For example, instead of typing ls -la every time you want to list files in detail, you can create an alias called ll that does the same thing.

Creating Temporary Aliases

If you want to create an alias just for the current session, you can do it directly in the terminal. These aliases will disappear when you close the terminal.

Example:

alias ll='ls -la'

Now, typing ll will give you the same result as ls -la.

Creating Permanent Aliases in Linux

To make your aliases last beyond the current session, you need to add them to your shell's configuration file. Here’s how to do it for each shell.

For Bash

Option 1: Using ~/.bashrc

1. Open ~/.bashrc in a text editor:

nano ~/.bashrc

2. Add your aliases at the end of the file:

alias ll='ls -la'
alias gs='git status'

3. Save the file and reload the configuration:

source ~/.bashrc

Option 2: Using ~/.bash_aliases

1. Create ~/.bash_aliases if it doesn’t exist:

touch ~/.bash_aliases

2. Open ~/.bash_aliases in a text editor:

nano ~/.bash_aliases

3. Add your aliases:

alias ll='ls -la'
alias gs='git status'

4. Ensure ~/.bashrc sources ~/.bash_aliases by adding the following line to ~/.bashrc if it’s not already there:

if [ -f ~/.bash_aliases ]; then
    . ~/.bash_aliases
fi

5. Reload the configuration:

source ~/.bashrc

For Zsh

1. Open ~/.zshrc in a text editor:

nano ~/.zshrc

2. Add your aliases at the end of the file:

alias ll='ls -la'
alias gs='git status'

3. Save the file and reload the configuration:

source ~/.zshrc

For Fish

1. Open ~/.config/fish/config.fish in a text editor:

nano ~/.config/fish/config.fish

2. Add your aliases at the end of the file:

alias ll='ls -la'
alias gs='git status'

3. Save the file and reload the configuration:

source ~/.config/fish/config.fish

Choosing the Best Method for Creating Bash Aliases

We have shown you two methods to create bash aliases in Linux. You might be wondering which method is best for you.

The difference between Option 1 (using ~/.bashrc) and Option 2 (using ~/.bash_aliases) primarily revolves around organization, maintainability, and the separation of concerns.

Let me list the detailed comparison, so you can decide which option is best for you.

Option 1: Using ~/.bashrc

Pros:

  1. Simplicity: Directly adding aliases to ~/.bashrc is straightforward and doesn’t require creating an additional file.
  2. Single File: All configurations are in one place, which can be easier to manage for users who are not familiar with multiple configuration files.

Cons:

  1. Clutter: Over time, ~/.bashrc can become cluttered with many lines of code, making it harder to manage and read.
  2. Separation of Concerns: Mixing aliases with other configurations (like environment variables, functions, and shell options) can make the file less organized and harder to maintain.

Option 2: Using ~/.bash_aliases

Pros:

  1. Organization: Keeping aliases in a separate file (~/.bash_aliases) helps to keep ~/.bashrc cleaner and more focused on other shell configurations.
  2. Maintainability: It’s easier to manage and update aliases when they are in a dedicated file. This is especially useful if you have a large number of aliases.
  3. Separation of Concerns: By separating aliases from other configurations, you can more easily identify and manage different types of settings.

Cons:

  1. Additional File: Requires creating and managing an additional file (~/.bash_aliases), which might be an extra step for some users.
  2. Sourcing: You need to ensure that ~/.bashrc sources ~/.bash_aliases correctly. This is usually a simple addition but requires awareness.

Recommendation:

  • For beginners: Option 1 might be simpler and more intuitive.
  • For more advanced users or those with many aliases: Option 2 provides better organization and maintainability.

Ultimately, the choice depends on your personal preference and the complexity of your shell configurations.

I prefer to keep my aliases in a separate file. It is often recommended by the experts.

Using Functions for More Complex Aliases

If your alias needs to perform more complex operations, you can define a function instead of a simple alias.

Example in ~/.bashrc or ~/.zshrc:

function mkcd() {
    mkdir -p "$1"&& cd "$1"
}

This function creates a directory and then changes to that directory.

Testing Your Aliases

After adding or modifying aliases, test them in a new terminal session or by reloading the configuration file (source ~/.bashrc, source ~/.zshrc, etc.).

Listing Aliases

You can list all defined aliases by running:

alias

Removing Aliases

To remove an alias, simply delete the corresponding line from your configuration file and reload the configuration.

Alternatively, you can use the unalias command.

Conclusion

Creating aliases in Linux is a simple way to make your command line experience more efficient. Whether you're using Bash, Zsh, or Fish, following these steps will help you manage and use aliases effectively.

10 Best Python Libraries Every Data Analyst Should Learn

$
0
0

https://www.tecmint.com/python-libraries-for-data-analysis

Python has become one of the most popular programming languages in the data analysis field due to its simplicity, flexibility, and powerful libraries which make it an excellent tool for analyzing data, creating visualizations, and performing complex analyses.

Whether you’re just starting as a data analyst or are looking to expand your toolkit, knowing the right Python libraries can significantly enhance your productivity in Python.

In this article, we’ll explore 10 Python libraries every data analyst should know, breaking them down into simple terms and examples of how you can use them to solve data analysis problems.

1. Pandas – Data Wrangling Made Easy

Pandas is an open-source library specifically designed for data manipulation and analysis. It provides two essential data structures: Series (1-dimensional) and DataFrame (2-dimensional), which make it easy to work with structured data, such as tables or CSV files.

Key Features:

  • Handling missing data efficiently.
  • Data aggregation and filtering.
  • Easy merging and joining of datasets.
  • Importing and exporting data from formats like CSV, Excel, SQL, and JSON.

Why Should You Learn It?

  • Data Cleaning: Pandas help in handling missing values, duplicates, and data transformations.
  • Data Exploration: You can easily filter, sort, and group data to explore trends.
  • File Handling: Pandas can read and write data from various file formats like CSV, Excel, SQL, and more.

Basic example of using Pandas:

import pandas as pd

# Create a DataFrame
data = {'Name': ['Alice', 'Bob', 'Charlie'], 'Age': [25, 30, 35], 'City': ['New York', 'Paris', 'London']}
df = pd.DataFrame(data)

# Filter data
filtered_data = df[df['Age'] > 28]
print(filtered_data)

2. NumPy – The Foundation for Data Manipulation

NumPy (Numerical Python) is the most fundamental Python library for numerical computing, which provides support for large, multi-dimensional arrays and matrices, along with a wide variety of mathematical functions to operate on them.

NumPy is often the foundation for more advanced libraries like Pandas, and it’s the go-to library for any operation involving numbers or large datasets.

Key Features:

  • Mathematical functions (e.g., mean, median, standard deviation).
  • Random number generation.
  • Element-wise operations for arrays.

Why Should You Learn It?

  • Efficient Data Handling: NumPy arrays are faster and use less memory compared to Python lists.
  • Mathematical Operations: You can easily perform operations like addition, subtraction, multiplication, and other mathematical operations on large datasets.
  • Integration with Libraries: Many data analysis libraries, including Pandas, Matplotlib, and Scikit-learn, depend on NumPy for handling data.

Basic example of using NumPy:

import numpy as np

# Create a NumPy array
arr = np.array([1, 2, 3, 4, 5])

# Perform element-wise operations
arr_squared = arr ** 2
print(arr_squared)  # Output: [ 1  4  9 16 25]

3. Matplotlib – Data Visualization

Matplotlib is a powerful visualization library that allows you to create a wide variety of static, animated, and interactive plots in Python.

It’s the go-to tool for creating graphs such as bar charts, line plots, scatter plots, and histograms.

Key Features:

  • Line, bar, scatter, and pie charts.
  • Customizable plots.
  • Integration with Jupyter Notebooks.

Why Should You Learn It?

  • Customizable Plots: You can fine-tune the appearance of plots (colors, fonts, styles).
  • Wide Range of Plots: From basic plots to complex visualizations like heatmaps and 3D plots.
  • Integration with Libraries: Matplotlib works well with Pandas and NumPy, making it easy to plot data directly from these libraries.

Basic example of using Matplotlib:

import matplotlib.pyplot as plt

# Sample data
x = [1, 2, 3, 4, 5]
y = [2, 4, 6, 8, 10]

# Create a line plot
plt.plot(x, y)
plt.title('Line Plot Example')
plt.xlabel('X-axis')
plt.ylabel('Y-axis')
plt.show()

4. Seaborn – Advanced Statistical Visualizations

Seaborn is built on top of Matplotlib and provides a high-level interface for drawing attractive and informative statistical graphics.

It simplifies the process of creating complex visualizations like box plots, violin plots, and pair plots.

Key Features:

  • Beautiful default styles.
  • High-level functions for complex plots like heatmaps, violin plots, and pair plots.
  • Integration with Pandas.

Why Should You Learn It?

  • Statistical Visualizations: Seaborn makes it easy to visualize the relationship between different data features.
  • Enhanced Aesthetics: It automatically applies better styles and color schemes to your plots.
  • Works with Pandas: You can directly plot DataFrames from Pandas.

Basic example of using Seaborn:

import seaborn as sns
import matplotlib.pyplot as plt

# Load a sample dataset
data = sns.load_dataset('iris')

# Create a pairplot
sns.pairplot(data, hue='species')
plt.show()

5. Scikit-learn – Machine Learning Made Easy

Scikit-learn is a widely-used Python library for machine learning, which provides simple and efficient tools for data mining and data analysis, focusing on supervised and unsupervised learning algorithms.

Key Features:

  • Preprocessing data.
  • Supervised and unsupervised learning algorithms.
  • Model evaluation and hyperparameter tuning.

Why Should You Learn It?

  • Machine Learning Models: Scikit-learn offers a variety of algorithms such as linear regression, decision trees, k-means clustering, and more.
  • Model Evaluation: It provides tools for splitting datasets, evaluating model performance, and tuning hyperparameters.
  • Preprocessing Tools: Scikit-learn has built-in functions for feature scaling, encoding categorical variables, and handling missing data.

Basic example of using Scikit-learn:

from sklearn.linear_model import LinearRegression
from sklearn.model_selection import train_test_split
from sklearn.datasets import load_boston

# Load dataset
data = load_boston()
X = data.data
y = data.target

# Split dataset into training and testing sets
X_train, X_test, y_train, y_test = train_test_split(X, y, test_size=0.2, random_state=42)

# Train a linear regression model
model = LinearRegression()
model.fit(X_train, y_train)

# Predict and evaluate
predictions = model.predict(X_test)
print(predictions[:5])  # Display first 5 predictions

6. Statsmodels – Statistical Models and Tests

Statsmodels is a Python library that provides classes and functions for statistical modeling. It includes tools for performing hypothesis testing, fitting regression models, and conducting time series analysis.

Key Features:

  • Regression models.
  • Time-series analysis.
  • Statistical tests.

Why Should You Learn It?

  • Regression Analysis: Statsmodels offers multiple regression techniques, including ordinary least squares (OLS) and logistic regression.
  • Statistical Tests: It provides many statistical tests, such as t-tests, chi-square tests, and ANOVA.
  • Time Series Analysis: Statsmodels is useful for analyzing and forecasting time-dependent data.

Basic example of using Statsmodels:

import statsmodels.api as sm
import numpy as np

# Sample data
X = np.random.rand(100)
y = 2 * X + np.random.randn(100)

# Fit a linear regression model
X = sm.add_constant(X)  # Add a constant term for the intercept
model = sm.OLS(y, X).fit()

# Print summary of the regression results
print(model.summary())

7. SciPy – Advanced Scientific and Technical Computing

SciPy is an open-source library that builds on NumPy and provides additional functionality for scientific and technical computing.

It includes algorithms for optimization, integration, interpolation, eigenvalue problems, and other advanced mathematical operations.

Key Features:

  • Optimization.
  • Signal processing.
  • Statistical functions.

Why Should You Learn It?

  • Scientific Computing: SciPy includes a wide range of tools for solving complex mathematical problems.
  • Optimization Algorithms: It provides methods for finding optimal solutions to problems.
  • Signal Processing: Useful for filtering, detecting trends, and analyzing signals in data.

Basic example of using SciPy:

from scipy import stats
import numpy as np

# Perform a t-test
data1 = np.random.normal(0, 1, 100)
data2 = np.random.normal(1, 1, 100)

t_stat, p_val = stats.ttest_ind(data1, data2)
print(f'T-statistic: {t_stat}, P-value: {p_val}')

8. Plotly – Interactive Visualizations

Plotly is a library for creating interactive web-based visualizations. It allows you to create plots that users can zoom in, hover over, and interact with.

Key Features:

  • Interactive plots.
  • Support for 3D plots.
  • Dash integration for building dashboards.

Why Should You Learn It?

  • Interactive Plots: Plotly makes it easy to create graphs that allow users to interact with the data.
  • Web Integration: You can easily integrate Plotly plots into web applications or share them online.
  • Rich Visualizations: It supports a wide variety of visualizations, including 3D plots, heatmaps, and geographical maps.

Basic example of using Plotly:

import plotly.express as px

# Sample data
data = px.data.iris()

# Create an interactive scatter plot
fig = px.scatter(data, x='sepal_width', y='sepal_length', color='species')
fig.show()

9. OpenPyXL – Working with Excel Files

OpenPyXL is a Python library that allows you to read and write Excel .xlsx files. It’s a useful tool when dealing with Excel data, which is common in business and finance settings.

Key Features:

  • Read and write .xlsx files.
  • Add charts to Excel files.
  • Automate Excel workflows.

Why Should You Learn It?

  • Excel File Handling: Openpyxl enables you to automate Excel-related tasks such as reading, writing, and formatting data.
  • Data Extraction: You can extract specific data points from Excel files and manipulate them using Python.
  • Create Reports: Generate automated reports directly into Excel.

Basic example of using OpenPyXL:

from openpyxl import Workbook

# Create a new workbook and sheet
wb = Workbook()
sheet = wb.active

# Add data to the sheet
sheet['A1'] = 'Name'
sheet['B1'] = 'Age'

# Save the workbook
wb.save('data.xlsx')

10. BeautifulSoup – Web Scraping

BeautifulSoup is a powerful Python library used for web scraping – that is, extracting data from HTML and XML documents. It makes it easy to parse web pages and pull out the data you need.

If you’re dealing with web data that isn’t available in an easy-to-use format (like a CSV or JSON), BeautifulSoup helps by allowing you to interact with the HTML structure of a web page.

Key Features:

  • Parsing HTML and XML documents.
  • Finding and extracting specific elements (e.g., tags, attributes).
  • Integration with requests for fetching data.

Why Should You Learn It?

  • Web Scraping: BeautifulSoup simplifies the process of extracting data from complex HTML and XML documents.
  • Compatibility with Libraries: It works well with requests for downloading web pages and pandas for storing the data in structured formats.
  • Efficient Searching: You can search for elements by tag, class, id, or even use CSS selectors to find the exact content you’re looking for.
  • Cleaning Up Data: Often, the data on websites is messy. BeautifulSoup can clean and extract the relevant parts, making it easier to analyze.

Basic example of using BeautifulSoup:

from bs4 import BeautifulSoup
import requests

# Fetch the web page content using requests
url = 'https://example.com'
response = requests.get(url)

# Parse the HTML content of the page
soup = BeautifulSoup(response.text, 'html.parser')

# Find a specific element by tag (for example, the first <h1> tag)
h1_tag = soup.find('h1')

# Print the content of the <h1> tag
print(h1_tag.text)
Conclusion

Whether you’re cleaning messy data, visualizing insights, or building predictive models, these tools provide everything you need to excel in your data analyst career. Start practicing with small projects, and soon, you’ll be solving real-world data challenges with ease.

LineSelect: Interactively Select Single or Multiple Lines from Stdin

$
0
0

https://linuxtldr.com/lineselect-tool

In this article, you will learn about a “lineselect” tool that allows you to interactively select single or multiple lines from stdin and output them to stdout, as shown.

What is LineSelect?

LineSelect is a free and open-source CLI tool that allows those working on the command line to interactively select single or multiple lines from stdin and output them to stdout.

I’d find it more useful when writing a shell script. Suppose you’re creating a shell script to administer a running Docker container. With this tool, you can allow users to interactively choose single or multiple running containers. After selection, you can use the stdout data to perform actions like checking container details, inspecting ports, stopping, deleting, etc.

Ezoic

This is one use case, but you can use it in various ways for different purposes in your shell script, and as a Node package, anyone with Node installed can effortlessly install it on their system.

So, in this article, I’ll show you how you can install LineSelect on Linux with command-line usage.

Tutorial Details

DescriptionLineSelect
Difficulty LevelLow
Root or Sudo PrivilegesNo
OS CompatibilityUbuntu, Manjaro, Fedora, etc.
Prerequisites
Internet RequiredYes (for installation)

How to Install LineSelect on Linux

LineSelect is available as a Node package, allowing easy installation for users. However, most Linux distros currently ship with an older version of Node that is incompatible with LineSelect. Therefore, if you have Node version <20, you can refer to our article on installing the latest version of Node.

Ezoic

Once you have it installed, run the following NPM command in your terminal to install LineSelect.

$ npm install -g lineselect

Once done, run the following command to verify it’s functioning without any errors:

$ lineselect

Output:

install lineselect

If you get the same output as shown above, it means you have properly installed LineSelect using the correct version of Node. Now, let’s see some usage examples…

Usage of LineSelect

To understand the use case of LineSelect within a command-line or shell script, you must first understand its basic workings by looking at the following syntax:

Ezoic
$ some-command | lineselect | some-othercommand

Here,

  • some-command” can be any command, such as “ls“, “docker ps“, “ps“, “ss“, etc.
  • lineselect” takes the output of the chosen command and provides an interactive interface for users to select single or multiple lines.
  • some-othercommand” will be a command where the user’s selected line will be redirected. Often, its “xargs” command is used, but it’s not limited to it.

When selecting single or multiple lines using LineSelect, remember to press the “Space” key first to select and then press “Enter” button to send the selected lines to the next command.

To showcase its use case, I’ll provide various command-line examples. Once you grasp its functionality, you can confidently use it in your own command or shell script. So, let’s start with…

1. Selecting one or more text files in the current directory using LineSelect, then removing them.

$ ls *.txt | lineselect | xargs rm

Output:

Here,

  • ls *.txt” will list all the text files in the current directory.
  • lineselect” takes the stdin of the listed file and allows user to select between them.
  • xargs rm” will take the user-selected file and delete it.

2. Selecting the running Docker containers with LineSelect, then halting the selected one.

$ docker stop $(docker ps -q | lineselect)

Output:

Here,

  • docker stop” will wait for the user action, then stop the selected Docker container.
  • $(docker ps -q | lineselect)” lists the IDs of the running Docker containers and allows users to select one or more.

3. Listing the currently running processes, selecting a single or multiple of them using LineSelect, and then killing the selected process.

$ kill -9 $(ps -a | lineselect | cut -d "" -f 4)

Output:

Here,

  • kill -9” will wait for the user action, then kill the selected process using the “SIGKILL” signal.
  • $(ps -a | lineselect | cut -d "" -f 4)” once the users have selected from the list of running processes, the cut command will receive the output and filter the first column from the selected line.

I’ll end the article here, but you can see how easy and useful it is to use while writing a shell script. Now, if you have any questions or concerns related to the topic, do let me know in the comment section.

Ezoic

Till then, peace!

8 Linux Commands to Diagnose Hard Drive Issues in Linux

$
0
0

https://www.tecmint.com/fix-hard-drive-bottlenecks-in-linux

8 Linux Commands to Diagnose Hard Drive Issues in Linux

As a Linux expert with over a decade of experience managing servers, I have seen how crucial it is to identify and resolve hard drive bottlenecks to keep a system running smoothly.

Bottlenecks occur when a system’s performance is limited by a specific component, in this case, the hard drive, where slow disk operations can drastically affect the performance of your applications, databases, and even the entire system.

In this article, I will explain how to identify hard drive bottlenecks on Linux using various tools and commands, and what to look for when troubleshooting disk-related issues.

What is a Hard Drive Bottleneck?

A hard drive bottleneck happens when the disk cannot read or write data fast enough to keep up with the system’s demands. This often results in slow response times, lag, and even system crashes in extreme cases.

These bottlenecks are commonly caused by the following factors:

  • Overloaded Disk I/O: When the system has too many read/write requests, the disk cannot process them all at once.
  • Disk Fragmentation: On certain file systems, files may become fragmented, leading to inefficient disk usage and slower performance.
  • Hardware Limitations: Older disks or disks with smaller capacities may not be able to handle modern workloads.
  • Disk Errors: Physical problems with the hard drive, such as bad sectors, can also lead to performance issues.

How to Find Hard Drive (Disk) Bottlenecks in Linux

Here are some key Linux commands and tools that can help you identify and diagnose hard drive bottlenecks.

1. iostat (Input/Output Statistics)

iostat is a command-line utility that provides statistics on CPU and I/O usage for devices, helping you pinpoint disk bottlenecks.

iostat -x 1

Key Metrics to Look For:

  • %util: This represents how much time the disk was busy handling requests. If this number is consistently high (over 80-90%), it indicates the disk is a bottleneck.
  • await: This is the average time (in milliseconds) for a disk I/O request to complete. A high value indicates slow disk performance.
  • svctm: This represents the average service time for I/O requests. A high value means the disk is taking longer to respond.
iostat: Monitor Disk I/O in Linux

2. iotop (I/O Monitoring in Real Time)

iotop is a real-time I/O monitoring tool that displays processes and their disk activity, which is useful for identifying which processes are consuming excessive disk bandwidth.

sudo iotop

This will show a list of processes that are performing disk I/O, along with the I/O read and write statistics.

iotop: Real-time Disk I/O Monitoring Tool

Key Metrics to Look For:

  • Read/Write: Look for processes that have high read or write values. These processes might be causing the disk bottleneck.
  • IO Priority: Check if any process is consuming disproportionate I/O resources. You can adjust the priority of processes using ionice to manage how they interact with disk I/O.

3. df (Disk Free)

df command shows the disk space usage on all mounted filesystems. A nearly full disk can cause significant slowdowns, especially on the root or home partitions.

df -h

Ensure that disks, especially the root (/) and home (/home) directories, are not close to being full. If the disk is more than 85-90% full, it may start to slow down due to lack of space for temporary files and disk operations.

Check Disk Space Utilization

4. dstat (Comprehensive System Resource Monitoring)

dstat is a versatile tool for monitoring various system resources, including disk I/O, which provides a comprehensive overview of the system’s performance in real-time.

dstat -dny

Key Metrics to Look For:

  • disk read/write: Look for spikes in disk read/write activity. If you see constant heavy disk activity, it could indicate a bottleneck.
  • disk await: Shows how long each I/O operation takes. Long waits here mean a disk bottleneck.
dstat - Versatile System Monitoring Tool
dstat – Versatile System Monitoring Tool

5. sar (System Activity Report)

The sar command is a powerful tool that collects, reports, and saves system activity information, which is ideal for historical performance analysis.

sar -d 1 5

Key Metrics to Look For:

  • tps: The number of transactions per second. A high value suggests the disk is handling a large number of I/O requests.
  • kB_read/s and kB_wrtn/s: The rate of data being read or written. If these numbers are unusually high, it may indicate a bottleneck.
sar: System Activity Reporter

6. smartctl (S.M.A.R.T. Monitoring)

smartctl is used for checking the health of your hard drives by querying the S.M.A.R.T. (Self-Monitoring, Analysis, and Reporting Technology) status.

This can help identify physical issues with the disk, such as bad sectors or failing components.

sudo apt install smartmontools
sudo smartctl -a /dev/sda

Key Metrics to Look For:

  • Reallocated_Sector_Ct: The number of sectors that have been reallocated due to errors. A high value indicates the disk might be failing.
  • Seek_Error_Rate: High values suggest the disk may be having trouble seeking data, often a sign of physical damage.

7. lsblk (List Block Devices)

lsblk command lists all block devices on your system, such as hard drives and partitions, which is useful for getting an overview of your system’s storage devices.

lsblk -o NAME,SIZE,ROTA,TYPE,MOUNTPOINT

Ensure that your hard drives or partitions are not overloaded with too many tasks. SSDs (non-rotational) typically offer better performance than HDDs (rotational), and an overused rotational disk can lead to performance bottlenecks.

lsblk - List Block Devices
lsblk – List Block Devices

8. vmstat (Virtual Memory Statistics)

While vmstat primarily shows memory usage, it can also provide insight into disk I/O operations and how the system handles memory swapping.

vmstat 1

Key Metrics to Look For:

  • bi (blocks in): The number of blocks read from disk.
  • bo (blocks out): The number of blocks written to disk.
  • si and so (swap in and swap out): If these values are high, it means the system is swapping, which can be caused by insufficient RAM and heavy disk usage.
vmstat: Monitor Memory and Disk I/O
Conclusion

Hard drive bottlenecks can be caused by various factors, including overloaded disk I/O, hardware limitations, or disk errors. By using the tools and commands outlined in this article, you can effectively diagnose disk-related issues on your Linux system.

Monitoring tools like iostat, iotop, and dstat provide valuable insights into disk performance, while tools like smartctl can help you identify potential hardware failures.

As a seasoned Linux professional, I recommend regularly monitoring disk performance, especially in production environments, to ensure optimal system performance. Identifying and resolving bottlenecks early can save you from performance degradation and system downtime.


34 Best Developer Tools for Building Modern Apps

$
0
0

https://www.tecmint.com/developer-tools-for-modern-apps

34 Best Developer Tools for Building Modern Apps

Building modern apps can seem overwhelming with the many tools and technologies available. However, having the right tools can make a huge difference in the development process, helping developers work faster and more efficiently.

Whether you’re making a mobile application, a web application, or a desktop application, there are essential tools that can improve your workflow. This article will cover some must-have developer tools for building modern apps and explain how they can help you.

1. Code Editors and IDEs (Integrated Development Environments)

The foundation of any development work is the code editor or Integrated Development Environment (IDE) you use. A good code editor is essential for writing and editing your app’s code efficiently.

Visual Studio Code (VS Code)

Visual Studio Code is a free, open-source code editor developed by Microsoft that supports a variety of programming languages, offers a rich set of extensions, and has features like IntelliSense, debugging, and version control.

Visual Studio Code
Visual Studio Code

JetBrains IntelliJ IDEA

IntelliJ IDEA is a powerful IDE that’s especially good for Java development, though it supports many other languages and comes with smart code suggestions and easy refactoring tools.

IntelliJ IDEA: A Powerful IDE

Sublime Text

Sublime Text is a lightweight code editor with a clean interface, ideal for quick edits or smaller projects, that also supports extensions and customizable features.

Sublime Text: A Versatile Code Editor

Vim Editor

Vim, short for “Vi Improved“, is a powerful, open-source text editor designed for both command-line and graphical interfaces.

It offers advanced capabilities which include syntax highlighting, macros, and support for numerous programming languages, making it suitable for a wide range of development tasks.

Vim: A Versatile Text Editor for Developers

A code editor or IDE should be chosen based on your app’s development needs. For example, if you’re working with JavaScript or TypeScript, VS Code is an excellent choice because it supports these languages well.

2. Version Control Tools

Version control is crucial for tracking changes to your code, collaborating with other developers, and managing different versions of your app.

Git

Git is the most popular version control system used by developers worldwide, which helps you track changes in your code and share it with others.

Git allows you to go back to earlier versions of your app and resolve conflicts when multiple developers work on the same code.

Git: The Powerful Version Control System

GitHub

GitHub is a platform that hosts Git repositories and offers features for collaboration, code reviews, and issue tracking. It’s ideal for open-source projects and team-based development.

Git Repository Hosting Platform

GitLab

GitLab is similar to GitHub but offers a Git repository platform with additional DevOps tools like CI/CD (Continuous Integration and Continuous Deployment) pipelines.

GitLab: A Comprehensive DevOps Platform

Bitbucket

Bitbucket is a Git repository management tool with a focus on team collaboration, which is especially popular for private repositories.

GitLab: Private Repository Management

Version control helps you keep track of your code changes and collaborate with other developers without overwriting each other’s work. Learning Git is essential for any developer.

3. Package Managers

Managing dependencies is one of the key challenges in app development and package managers help you automate the process of installing, updating, and managing third-party libraries or frameworks your app depends on.

npm (Node Package Manager)

npm is the default package manager for Node.js that will help you manage dependencies and install packages easily when you are working with JavaScript or building web apps.

npm: The Official Package Manager for Node.js

Yarn

Yarn is a faster alternative to npm that also helps manage dependencies for JavaScript projects. Yarn has built-in caching for faster installs and uses a lock file to ensure consistent package versions across different machines.

Yarn: A Faster Package Manager

Homebrew

Homebrew is a package manager for macOS (and Linux) that allows you to install command-line tools and software easily.

Homebrew: Easy Package Management

pip

pip is the default package manager for Python that helps you install and manage Python libraries and dependencies.

pip - Python Package Installer
pip – Python Package Installer

Using package managers can save you a lot of time by managing all the dependencies your app needs and making sure they are up to date.

4. Containerization and Virtualization

Containers allow developers to package an app and its dependencies together, making it easier to run the app in different environments, such as development, testing, and production. Virtualization tools are also helpful for testing your app in different environments.

Docker

Docker is a tool that enables developers to package applications and their dependencies into containers, and these containers can run consistently on any machine, whether on your local computer, a cloud server, or in a production environment.

Docker: The Ultimate Tool for Containerization

Kubernetes

Kubernetes is a system for automating the deployment, scaling, and management of containerized applications, which is ideal for larger projects where you need to manage multiple containers.

Kubernetes: Automate Container Management

Vagrant

Vagrant is a tool for building and maintaining virtual machine environments, it allows you to create a virtual machine with the required software and dependencies for your app, making it easier to share development environments across teams.

Vagrant: Simplify Virtual Machine Management

Using Docker and Kubernetes ensures your app will run smoothly in different environments, reducing “works on my machine” issues.

5. Database Management Tools

Most modern apps need to interact with a database to store and retrieve data. Whether you’re using a relational database like MySQL or a NoSQL database like MongoDB, managing and interacting with these databases is an essential part of app development.

MySQL Workbench

MySQL Workbench is a graphical tool for managing MySQL databases, it offers an easy-to-use interface for writing queries, creating tables, and managing your database.

MySQL Workbench: Database Management Tool

pgAdmin

pgAdmin is a management tool for PostgreSQL databases, offering a rich set of features for interacting with your database, writing queries, and performing administrative tasks.

pgAdmin: PostgreSQL Management Tool

MongoDB Compass

MongoDB Compass is a GUI for MongoDB that allows you to visualize your data, run queries, and interact with your NoSQL database.

MongoDB Compass: A GUI for MongoDB

DBeaver

DBeaver is a universal database management tool that supports multiple databases, including MySQL, PostgreSQL, SQLite, and others.

DBeaver: Database Management Tool

Having a good database management tool helps you efficiently interact with and manage your app’s database.

6. API Development Tools

Modern apps often rely on APIs (Application Programming Interfaces) to interact with other services or allow third-party apps to interact with your app. API development tools help you design, test, and manage APIs efficiently.

Postman

Postman is a popular tool for testing APIs, which allows you to send HTTP requests, view responses, and automate API tests. Postman is especially helpful during the development and testing phase of your app.

Postman: The Ultimate API Testing Tool

Swagger/OpenAPI

Swagger/OpenAPI is a framework for designing, building, and documenting RESTful APIs. Swagger can generate interactive API documentation that makes it easier for other developers to understand and use your API.

Swagger/OpenAPI: Design and Document APIs

Insomnia

Insomnia is another API testing tool similar to Postman, but with a focus on simplicity and ease of use. It’s great for developers who want a lightweight tool to test APIs without too many distractions.

Insomnia: Simple API Testing

Using API development tools can make it easier to test and debug your app’s integration with external services.

7. Testing Tools

Testing is a crucial step in building modern apps, which ensures that your app works correctly and provides a good user experience. Whether you’re testing individual pieces of code (unit testing) or the entire app (end-to-end testing), the right tools are essential.

JUnit

JUnit is a framework for writing and running unit tests in Java. It’s widely used in the Java development community.

JUnit: Java Unit Testing Framework

Mocha

Mocha is a JavaScript testing framework that runs in Node.js and in the browser, and helps you write tests for your app’s behavior.

Mocha: JavaScript Testing Framework

Selenium

Selenium is a tool for automating web browsers, allowing you to perform end-to-end testing of your web app’s UI.

Selenium: Automate Web Browsers

Jest

Jest is a testing framework for JavaScript that works well with React and other JavaScript frameworks. Jest offers fast and reliable tests with great debugging features.

Jest: A Powerful JavaScript Testing Framework

Good testing tools help you identify bugs early, improve the quality of your app, and ensure that it works as expected.

Continuous Integration and Continuous Deployment (CI/CD) Tools

CI/CD is a modern practice that involves automating the process of testing, building, and deploying your app. CI/CD tools help you ensure that your app is always in a deployable state and can be released to production quickly and reliably.

Jenkins

Jenkins is a popular open-source automation server that allows you to automate building, testing, and deploying your app, it integrates with many version control systems and other tools.

Jenkins: The Ultimate CI/CD Automation Tool

Travis CI

Travis CI is a cloud-based CI/CD service that integrates easily with GitHub and automates the process of testing and deploying your app.

Travis CI: Automate Your Builds and Deployments

CircleCI

CircleCI is a fast, cloud-based CI/CD tool that integrates with GitHub, Bitbucket, and GitLab, and helps automate the testing and deployment of your app.

CircleCI: Automate Your Builds and Deployments

GitLab CI/CD

GitLab CI/CD offers built-in CI/CD features, allowing you to manage the entire software development lifecycle from code to deployment in one platform.

Simplify Your DevOps with GitLab CI/CD

CI/CD tools help automate the repetitive tasks of building, testing, and deploying, saving developers a lot of time and reducing the chances of human error.

9. Cloud Platforms and Hosting Services

For modern apps, hosting them in the cloud is often the best option, as cloud platforms provide scalable infrastructure, security, and high availability for your app.

Amazon Web Services (AWS)

Amazon Web Services (AWS) is a comprehensive cloud platform offering a wide range of services, including computing, storage, databases, machine learning, and more. AWS is ideal for large-scale apps with high traffic.

AWS: Cloud Computing Platform

Microsoft Azure

Microsoft Azure is a cloud platform offering various services, including hosting, storage, AI, and databases, which is a popular choice for enterprises and developers building apps on Microsoft technologies.

Microsoft Azure: Cloud Computing Platform

Google Cloud Platform (GCP)

Google Cloud Platform (GCP) offers tools for building, deploying, and scaling applications. GCP is especially popular for apps that rely on machine learning and big data.

Google Cloud Platform (GCP)

Heroku

Heroku is a platform-as-a-service (PaaS) for building, running, and scaling apps, which is great for smaller apps or when you need a quick and easy way to deploy your app.

Heroku: Platform as a Service

Cloud platforms provide the infrastructure your app needs to run in a scalable, secure, and cost-effective manner.

Conclusion

Building modern apps requires a combination of the right tools to handle different aspects of the development process. Whether you’re writing code, managing dependencies, testing your app, or deploying it to the cloud, having the right tools can make a huge difference in your productivity and the quality of your app.

By using the tools mentioned above, you’ll be well-equipped to build, test, and deploy modern apps efficiently. Happy coding!


man vs tldr: Why The tldr Command is Better And How You Can Use It

$
0
0

https://www.maketecheasier.com/linux-tldr-command

Man Vs Tldr Which Is Better And Why Feature Image

To avoid any confusion, I must first state that this article is dealing with the man and tldr commands in Linux. While man pages are incredibly detailed, they can be intimidating, especially for those just starting out. Instead, you can use the tldr command to get a short, simple, and easy-to-understand explanation of any Linux command.

In this guide, we’ll dive deep into what tldr is, how to use it, and why it’s a better alternative to the traditional man command.

The Man Command

The man command, referred to manual, is the traditional way to access documentation for commands in Unix-like operating systems. When you type man along with a command, it pulls up the manual page for that specific command, providing detailed information about its usage, options, and examples.

For example, you can get a detailed overview of the ls command by executing this:

manls
Viewing Ls Command Using Man Command

This opens a manual page listing all the available options. The information is organized into sections like NAME, SYNOPSIS, DESCRIPTION, OPTIONS, and EXAMPLES. While this structure makes it easy to navigate, it can also be quite extensive.

The man command can be incredibly useful for advanced users who need in-depth knowledge, but it may feel like wading through a vast amount of text for beginners or even intermediate users. The sheer volume of information can overwhelm you, and you can easily lose your way in it.

What Is Tldr?

tldr stands for too long; didn’t read, a phrase originating on the internet to describe a summary of a long text piece. Unlike man pages, tldr pages focus on the most useful options and provide clear, real-world examples.

For example, when you run tldr ls in the terminal, the tldr command will provide you with a brief overview of the ls command, along with some of its most commonly used options:

tldr ls
Viewing ls command information including its example using the tldr Command.

As you can see, tldr pages are much more concise and to the point, making it easier for new users to quickly understand and start using a command.

How to Use Tldr

To access tldr pages conveniently, install a supported client. One of the main clients is Node.js, which serves as the original client for the tldr project. To explore other client applications available for different platforms, you can refer to the TLDR clients wiki page.

You can install Node.js using the package manager corresponding to your Linux distribution. For example, on Debian-based distributions such as Linux Mint or Ubuntu, run this:

sudoaptinstall nodejs npm

Once you’ve installed Node.js and its package manager npm, you can globally install the tldr client by running this:

sudo npm install-g tldr
Installing Tldr Using Npm

If you prefer, you can also install tldr as a Snap package by executing:

sudo snap install tldr

After installation, the tldr client allows you to view simplified, easy-to-understand versions of command-line manual pages. For instance, to get a concise summary of the tar command, simply type:

tldr tar
Viewing Tar Command Using Tldr

You can also search for specific commands using keywords with the --search option:

tldr --search"Keyword"

Additionally, you can list all available commands using the -l option:

tldr -l

You can also simply run tldr in the terminal to explore all other tldr command options:

Tldr Command Options

If you prefer a browser-based experience, the official tldr website offers the same content in a web-friendly format. It includes features like a search bar with autocomplete and labels indicating whether a command is specific to Linux or macOS.

Tldr Web Browser Page


Basics of Pandas: 10 Core Commands for Data Analysis

$
0
0

https://www.tecmint.com/pandas-commands-for-data-analysis

Basics of Pandas: 10 Core Commands for Data Analysis

Pandas is a popular and widely-used Python library used for data manipulation and analysis, as it provides tools for working with structured data, like tables and time series, making it an essential tool for data preprocessing.

Whether you’re cleaning data, looking at datasets, or getting data ready for machine learning, Pandas is your go-to library. This article introduces the basics of Pandas and explores 10 essential commands for beginners.

What is Pandas?

Pandas is an open-source Python library designed for data manipulation and analysis, which is built on top of NumPy, another Python library for numerical computing.

Pandas introduces two main data structures:

  • Series: A one-dimensional labeled array capable of holding any data type (e.g., integers, strings, floats).
  • DataFrame: A two-dimensional labeled data structure, similar to a spreadsheet or SQL table, where data is organized in rows and columns.

To use Pandas, you need to install it first using the pip package manager:

pip install pandas

Once installed, import it in your Python script:

import pandas as pd

The alias pd is commonly used to make Pandas commands shorter and easier to write.

Now let’s dive into the essential commands!

1. Loading Data

Before working with data, you need to load it into a Pandas DataFrame using the read_csv() function, which is commonly used to load CSV files:

data = pd.read_csv('data.csv')
print(data.head())
  • read_csv('data.csv'): Reads the CSV file into a DataFrame.
  • head(): Displays the first five rows of the DataFrame.

This command is crucial for starting any data preprocessing task.

2. Viewing Data

To understand your dataset, you can use the following commands:

  • head(n): View the first n rows of the DataFrame.
  • tail(n): View the last n rows of the DataFrame.
  • info(): Get a summary of the DataFrame, including column names, non-null counts, and data types.
  • describe(): Get statistical summaries of numerical columns.

These commands help you quickly assess the structure and contents of your data.

print(data.info())
print(data.describe())

3. Selecting Data

To select specific rows or columns, use the following methods:

Select a single column:

column_data = data['ColumnName']

Select multiple columns:

selected_data = data[['Column1', 'Column2']]

Select rows using slicing:

rows = data[10:20]  # Rows 10 to 19

Select rows and columns using loc or iloc:

# By labels (loc)
subset = data.loc[0:5, ['Column1', 'Column2']]

# By index positions (iloc)
subset = data.iloc[0:5, 0:2]

4. Filtering Data

Filtering allows you to select rows based on conditions.

filtered_data = data[data['ColumnName'] > 50]

You can combine multiple conditions using & (AND) or | (OR):

filtered_data = data[(data['Column1'] > 50) & (data['Column2'] < 100)]

This is useful for narrowing down your dataset to relevant rows.

5. Adding or Modifying Columns

You can create new columns or modify existing ones:

Add a new column:

data['NewColumn'] = data['Column1'] + data['Column2']

Modify an existing column:

data['Column1'] = data['Column1'] * 2

These operations are essential for feature engineering and data transformation.

6. Handling Missing Data

Real-world datasets often contain missing values and Pandas provides tools to handle them:

Check for missing values:

print(data.isnull().sum())

Drop rows or columns with missing values:

data = data.dropna()
data = data.dropna(axis=1)

Fill missing values:

data['ColumnName'] = data['ColumnName'].fillna(0)
data['ColumnName'] = data['ColumnName'].fillna(data['ColumnName'].mean())

Handling missing data ensures your dataset is clean and ready for analysis.

7. Sorting Data

To sort your dataset by one or more columns, use the sort_values() function:

sorted_data = data.sort_values(by='ColumnName', ascending=True)

For multiple columns:

sorted_data = data.sort_values(by=['Column1', 'Column2'], ascending=[True, False])

Sorting is helpful for organizing data and finding patterns.

8. Grouping Data

The groupby() function is used to group data and perform aggregate operations:

grouped_data = data.groupby('ColumnName')['AnotherColumn'].sum()

Common aggregation functions include:

  • sum(): Sum of values.
  • mean(): Average of values.
  • count(): Count of non-null values.

Example:

grouped_data = data.groupby('Category')['Sales'].mean()

This command is essential for summarizing data.

9. Merging and Joining DataFrames

To combine multiple DataFrames, use the following methods:

Concatenate:

combined_data = pd.concat([data1, data2], axis=0)

Merge:

merged_data = pd.merge(data1, data2, on='KeyColumn')

Join:

joined_data = data1.join(data2, how='inner')

These operations allow you to combine datasets for a comprehensive analysis.

10. Exporting Data

After processing your data, you may need to save it using the to_csv() function:

data.to_csv('processed_data.csv', index=False)

This command saves the DataFrame to a CSV file without the index column. You can also export to other formats like Excel, JSON, or SQL.

Conclusion

Pandas is an indispensable tool for data preprocessing, offering a wide range of functions to manipulate and analyze data.

The 10 commands covered in this article provide a solid foundation for beginners to start working with Pandas. As you practice and explore more, you’ll discover the full potential of this powerful library.


How to Use PyTest for Unit Testing in Python

$
0
0

https://www.tecmint.com/unit-testing-python-code-with-pytest

How to Use PyTest for Unit Testing in Python

When you’re writing code in Python, it’s important to make sure that your code works as expected. One of the best ways to do this is by using unit tests, which help you check if small parts (or units) of your code are working correctly.

In this article, we will learn how to write and run effective unit tests in Python using PyTest, one of the most popular testing frameworks for Python.

What are Unit Tests?

Unit tests are small, simple tests that focus on checking a single function or a small piece of code. They help ensure that your code works as expected and can catch bugs early.

Unit tests can be written for different parts of your code, such as functions, methods, and even classes. By writing unit tests, you can test your code without running the entire program.

Why Use PyTest?

PyTest is a popular testing framework for Python that makes it easy to write and run tests.

It’s simple to use and has many useful features like:

  • It allows you to write simple and clear test cases.
  • It provides advanced features like fixtures, parameterized tests, and plugins.
  • It works well with other testing tools and libraries.
  • It generates easy-to-read test results and reports.

Setting Up PyTest in Linux

Before we start writing tests, we need to install PyTest. If you don’t have PyTest installed, you can install it using the Python package manager called pip.

pip install pytest

Once PyTest is installed, you’re ready to start writing tests!

Writing Your First Test with PyTest

Let’s start by writing a simple function and then write a test for it.

Step 1: Write a Simple Function

First, let’s create a Python function that we want to test. Let’s say we have a function that adds two numbers:

# add.py
def add(a, b):
    return a + b

This is a simple function that takes two numbers a and b, adds them together, and returns the result.

Step 2: Write a Test for the Function

Now, let’s write a test for the add function. In PyTest, tests are written in separate files, typically named test_*.py to make it easy to identify test files.

Create a new file called test_add.py and write the following test code:

# test_add.py
from add import add

def test_add_numbers():
    assert add(2, 3) == 5
    assert add(-1, 1) == 0
    assert add(0, 0) == 0

Explanation of the above code:

  • We import the add function from the add.py file.
  • We define a test function called test_add_numbers(). In PyTest, a test function should start with the word test_.
  • Inside the test function, we use the assert statement to check if the result of calling the add function matches the expected value. If the condition in the assert statement is True, the test passes; otherwise, it fails.

Step 3: Run the Test

To run the test, open your terminal and navigate to the directory where your test_add.py file is located and then run the following command:

pytest

PyTest will automatically find all the test files (those that start with test_) and run the tests inside them. If everything is working correctly, you should see an output like this:

Verifying Python Code Functionality

The dot (.) indicates that the test passed. If there were any issues, PyTest would show an error message.

Writing More Advanced Tests

Now that we know how to write and run a basic test, let’s explore some more advanced features of PyTest.

Testing for Expected Exceptions

Sometimes, you want to test if your code raises the correct exceptions when something goes wrong. You can do this with the pytest.raises() function.

Let’s say we want to test a function that divides two numbers. We want to raise an exception if the second number is zero (to avoid division by zero errors).

Here’s the divide function:

# divide.py
def divide(a, b):
    if b == 0:
        raise ValueError("Cannot divide by zero")
    return a / b

Now, let’s write a test for this function that checks if the ValueError is raised when we try to divide by zero:

# test_divide.py
from divide import divide
import pytest

def test_divide_numbers():
    assert divide(10, 2) == 5
    assert divide(-10, 2) == -5
    assert divide(10, -2) == -5

def test_divide_by_zero():
    with pytest.raises(ValueError):
        divide(10, 0)

Explanation of the code:

  • We added a new test function called test_divide_by_zero().
  • Inside this function, we use pytest.raises(ValueError) to check if a ValueError is raised when we call the divide function with zero as the second argument.

Run the tests again with the pytest command. If everything is working correctly, you should see this output:

Test Your Code with PyTest

Using Fixtures for Setup and Cleanup

In some cases, you may need to set up certain conditions before running your tests or clean up after the tests are done. PyTest provides fixtures to handle this.

A fixture is a function that you can use to set up or tear down conditions for your tests. Fixtures are often used to create objects or connect to databases that are needed for the tests.

Here’s an example of using a fixture to set up a temporary directory for testing file operations:

# test_file_operations.py
import pytest
import os

@pytest.fixture
def temporary_directory():
    temp_dir = "temp_dir"
    os.mkdir(temp_dir)
    yield temp_dir  # This is where the test will run
    os.rmdir(temp_dir)  # Cleanup after the test

def test_create_file(temporary_directory):
    file_path = os.path.join(temporary_directory, "test_file.txt")
    with open(file_path, "w") as f:
        f.write("Hello, world!")
    
    assert os.path.exists(file_path)

Explanation of the code:

  • We define a fixture called temporary_directory that creates a temporary directory before the test and deletes it afterward.
  • The test function test_create_file() uses this fixture to create a file in the temporary directory and checks if the file exists.

Run the tests again with the pytest command. PyTest will automatically detect and use the fixture.

Parameterize Your Tests with Pytest

Sometimes, you want to run the same test with different inputs. PyTest allows you to do this easily using parametrize.

Let’s say we want to test our add function with several pairs of numbers. Instead of writing separate test functions for each pair, we can use pytest.mark.parametrize to run the same test with different inputs.

# test_add.py
import pytest
from add import add

@pytest.mark.parametrize("a, b, expected", [
    (2, 3, 5),
    (-1, 1, 0),
    (0, 0, 0),
    (100, 200, 300)
])
def test_add_numbers(a, b, expected):
    assert add(a, b) == expected

Explanation of the code:

  • We use the pytest.mark.parametrize decorator to define multiple sets of inputs (a, b, and expected).
  • The test function test_add_numbers() will run once for each set of inputs.

Run the tests again with the pytest command, which will run the test four times, once for each set of inputs.

Conclusion

In this article, we’ve learned how to write and run effective unit tests in Python using PyTest to catch bugs early and ensure that your code works as expected.

PyTest makes it easy to write and run these tests, and with its powerful features, you can handle more complex testing needs as you grow in your Python journey.

Setting Up a Development Environment for Python, Node.js, and Java on Fedora

$
0
0

https://www.tecmint.com/fedora-development-setup

Setting Up a Development Environment for Python, Node.js, and Java on Fedora

Fedora is a popular Linux distribution known for its cutting-edge features and stability, making it an excellent choice for setting up a development environment.

This tutorial will guide you through setting up a development environment for three widely-used programming languages: Python, Node.js, and Java. We will cover the installation process, configuration, and common tools for each language.

Prerequisites

Before we begin, ensure you have a working installation of Fedora. You should have administrative (root) access to the system, as installing software requires superuser privileges.

If you’re using a non-root user, you can use sudo for commands requiring administrative rights.

Step 1: Setting Up Python Development Environment in Fedora

Python is one of the most popular programming languages, known for its simplicity and versatility. Here’s how you can set up a Python development environment on Fedora.

1.1 Install Python in Fedora

Fedora comes with Python pre-installed, but it’s always a good idea to ensure you have the latest version. You can check the current version of Python by running:

python3 --version

To install the latest version of Python, run the following command:

sudo dnf install python3 -y

1.2 Install pip (Python Package Installer)

pip is a package manager for Python, and it’s essential for installing third-party libraries.

sudo dnf install python3-pip -y

Verify the installation by running:

pip3 --version

1.3 Set Up a Virtual Environment

A virtual environment allows you to create isolated Python environments for different projects, ensuring that dependencies don’t conflict.

To set up a virtual environment, run the following commands.

sudo dnf install python3-virtualenv -y
python3 -m venv myenv
source myenv/bin/activate

To deactivate the virtual environment, simply run:

deactivate

1.4 Install Essential Python Libraries

To make development easier, you may want to install some essential Python libraries.

pip install numpy pandas requests flask django

1.5 Install an Integrated Development Environment (IDE)

While you can use any text editor for Python, an IDE like PyCharm or Visual Studio Code (VSCode) can provide advanced features like code completion and debugging.

To install VSCode on Fedora, run:

sudo rpm --import https://packages.microsoft.com/keys/microsoft.asc
echo -e "[code]\nname=Visual Studio Code\nbaseurl=https://packages.microsoft.com/yumrepos/vscode\nenabled=1\ngpgcheck=1\ngpgkey=https://packages.microsoft.com/keys/microsoft.asc" | sudo tee /etc/yum.repos.d/vscode.repo > /dev/null
dnf check-update
sudo dnf install code

Alternatively, you can download PyCharm from the official website.

Step 2: Setting Up Node.js Development Environment in Fedora

Node.js is a popular runtime for building server-side applications with JavaScript and here’s how to set up Node.js on Fedora.

2.1 Install Node.js in Fedora

Fedora provides the latest stable version of Node.js in its official repositories.

sudo dnf install nodejs -y

You can verify the installation by checking the version.

node --version

2.2 Install npm (Node Package Manager) in Fedora

npm is the default package manager for Node.js and is used to install and manage JavaScript libraries. It should be installed automatically with Node.js, but you can check the version by running:

npm --version

2.3 Set Up a Node.js Project in Fedora

To start a new Node.js project, create a new directory for your project.

mkdir my-node-project
cd my-node-project

Next, initialize a new Node.js project, which will create a package.json file, which will contain metadata about your project and its dependencies.

npm init

Install dependencies. For example, to install the popular express framework, run:

npm install express --save

Create a simple Node.js application in index.js.

const express = require('express');
const app = express();
const port = 3000;

app.get('/', (req, res) => {
  res.send('Hello World!');
});

app.listen(port, () => {
  console.log(`Server is running at http://localhost:${port}`);
});

Run the application.

node index.js

2.4 Install an IDE or Text Editor

For Node.js development, Visual Studio Code (VSCode) is a great option, as it provides excellent support for JavaScript and Node.js.

sudo dnf install code -y

Alternatively, you can use Sublime Text.

Step 3: Setting Up Java Development Environment in Fedora

Java is one of the most widely used programming languages, especially for large-scale applications.

Here’s how to set up Java on Fedora.

3.1 Install OpenJDK in Fedora

Fedora provides the OpenJDK package, which is an open-source implementation of the Java Platform.

sudo dnf install java-17-openjdk-devel -y

You can verify the installation by checking the version.

java -version

3.2 Set Up JAVA_HOME Environment Variable in Fedora

To ensure that Java is available system-wide, set the JAVA_HOME environment variable.

First, find the path of the installed Java version:

sudo update-alternatives --config java

Once you have the Java path, add it to your .bashrc file.

echo "export JAVA_HOME=/usr/lib/jvm/java-17-openjdk">> ~/.bashrc
echo "export PATH=$JAVA_HOME/bin:$PATH">> ~/.bashrc
source ~/.bashrc

3.3 Install Maven (Optional) in Fedora

Maven is a popular build automation tool for Java projects.

sudo dnf install maven -y

Verify the installation.

mvn -version

3.4 Set Up a Java Project in Fedora

To set up a simple Java project, create a new directory for your project.

mkdir MyJavaProject
cd MyJavaProject

Create a new Java file Main.java.

public class Main {
    public static void main(String[] args) {
        System.out.println("Hello, World!");
    }
}

Compile the Java file and run the application.

javac Main.java
java Main

3.5 Install an IDE for Java in Fedora

For Java development, IntelliJ IDEA or Eclipse are excellent choices.

sudo dnf install intellij-idea-community -y

Alternatively, you can download the latest version from the official website.

Step 3: Additional Tools for Development in Fedora

Regardless of the language you are working with, there are some additional tools that can improve your development experience.

3.1 Version Control with Git

Git is essential for managing source code and collaborating with others.

sudo dnf install git -y
git --version

3.2 Docker for Containerization in Fedora

Docker allows you to containerize your applications for easy deployment.

sudo dnf install docker -y
sudo systemctl enable --now docker

Verify Docker installation.

docker --version

3.3 Database Setup (Optional) in Fedora

If your application requires a database, you can install MySQL, PostgreSQL, or MongoDB.

For example, to install MySQL, run:

sudo dnf install mysql-server -y
sudo systemctl enable --now mysqld
Conclusion

In this tutorial, we’ve covered how to set up development environments for Python, Node.js, and Java on Fedora. We also touched on setting up essential tools like Git, Docker, and databases to enhance your development workflow.

With these steps, you can begin developing applications in any of these languages, leveraging Fedora’s powerful development tools.


Kill a Process Running on a Specific Port in Linux (via 4 Methods)

$
0
0

https://linuxtldr.com/kill-a-process-running-on-a-specific-port-in-linux

Kill a Process Running on a Specific Port in Linux (via 4 Methods)

A newbie user often struggles to identify the process behind a specific listening port. Indeed, it’s not all their fault, as some listening ports are started and managed by the OS. However, they may forget the name or struggle to find the process ID of the service they manually started.

The running (or unresponsive) process must be stopped to free the occupied port and make it available for other processes. Let’s assume you are running an Apache server that uses ports 80 (for HTTP) and 443 (for HTTPS). You won’t be able to launch an Nginx server that shares these common ports until the Apache server is stopped.

It’s one of the many scenarios, and listening ports are often overlooked by users until a process fails to launch due to port unavailability. Hence, in this quick guide, I’ll show you how to identify and kill a process running on a specific port in Linux.

Ezoic

Table of Contents

How to Kill a Process Running on a Specific Port in Linux

There are many ways to find and terminate processes running on a certain port. However, IT Guy, SysAdmin, or network engineers often favor using the CLI tool for this job. In such cases, you can use the “killport“, “fuser“, “lsof“, “netstat“, and “ss” commands as detailed in the following sections.

Method 1: Kill a Process Running on a Specific Port Using killport

Killport is a fantastic CLI tool for killing a process running on a specific port by using only the port number, without needing a service name or process ID. The only inconvenience is that it’s an external tool, but you can quickly install it on your Linux system by following our installation guide.

Ezoic

Once you have it installed, you can quickly terminate the process running on a certain port. Let’s assume you have an Apache server running on port 80. To stop it, simply execute this command:

$ sudo killport 80

Output:

kill process running on a specific port using killport

Well, ignore the last “No such process” message—it’s simply the response to the last kill signal sent to the process. The key point is that the port is now available for use by any other process.

Ezoic

Method 2: Kill a Process Running on a Specific Port Using fuser

Fuser is another great tool used for identifying processes using specific files, file systems, or sockets. Despite using it to identify processes running on specific sockets (or ports), you can use it to troubleshoot issues related to file locking, process management, and system resources.

It comes preinstalled on some popular Linux distributions like Ubuntu, Fedora, and Manjaro, but if it’s not available on your system, you can install the “psmisc” package that contains “fuser” and other command-line utilities.

# On Debian, Ubuntu, Kali Linux, Linux Mint, Zorin OS, Pop!_OS, etc.
$ sudo apt install psmisc

# On Red Hat, Fedora, CentOS, Rocky Linux, AlmaLinux, etc.
$ sudo dnf install psmisc

# On Arch Linux, Manjaro, BlackArch, Garuda, etc.
$ sudo pacman -S psmisc

# On OpenSUSE system
$ sudo zypper install psmisc

To find out the process running on a specific port, you can specify the port number and its TCP or UDP protocol in the “fuser” command.

Ezoic
$ sudo fuser 80/tcp

The above command will return the process ID in charge of handling the specified port.

finding out which process is running on a particular port

Instead of printing the running process ID, you can use the “-k” option with the above command to terminate the process associated with that process ID.

$ sudo fuser -k 80/tcp

Output:

killing the process running on a specific port

Once you terminate the process with this method, you may need to wait a 60-second delay before the process fully shuts down. This is implemented as a security measure to avoid potential data corruption or conflicts. If you want to immediately stop the running process, you can specify the process ID in the “sudo kill -9 <PID>” command.

Method 3: Kill a Process Running on a Specific Port Using lsof

Lsof is another powerful tool used to identify the process responsible for managing specific files, directories, network sockets, and other system resources on the active system. It comes pre-installed with nearly all Linux distributions, requiring no additional installation.

Ezoic

To identify the process name and ID associated with a specific port, use the following command, followed by the port number you wish to check:

$ sudo lsof -i :80

The above command will return the output in multiple columns, with your focus areas being solely the “COMMAND” and “PID” columns.

list process name and PID of particular port

Once you have the process ID, you can use the “kill” command to terminate the process.

$ sudo kill -9 36749 36751 36752

Output:

killing the process running for a specific port

The “-9” option sends the “SIGKILL” signal to aggressively terminate the process, while you can alternatively use the “-1” option to hang up the process (less secure) and the “-15” option to gently kill the process (default).

Method 4: Kill a Process Running on a Specific Port Using netstat and ss

Netstat and ss are among the most widely used tools for SysAdmins to quickly pinpoint a process name and process ID associated with a specific port. However, netstat is considered depricated, and some major Linux distributions have removed it, requiring the installation of the “net-tools” package for usage.

The ss command can be found in most Linux systems, and it’s basically an improved version of netstat. Both tools use almost identical command syntaxes, with the “-tnlp” option being the most common to identify the listening port’s process name and process ID, where each option follows.

Ezoic
  • -t“: Shows the TCP sockets
  • -n“: Avoid resolving the service names
  • -l“: Show the listening sockets
  • -p“: Show the process ID and name

To find out the process name or ID of port 80, you can use either the netstat or ss command with the “-tnlp” option, along with the grep command, to filter out the data for only the specified port number.

$ sudo netstat -tnlp | grep -i :80
$ sudo ss -tnlp | grep -i :80

Output:

find process name and id using the port number

Instead of specifying the port number in the grep command, you can also use the service name to identify its process ID and listening port.

$ sudo netstat -tnlp | grep -i apache
$ sudo ss -tnlp | grep -i apache

Output:

find process name and id using the service name

Finally, to kill the corresponding process, you can specify its process ID with the following command:

$ sudo kill -9 41005

Output:

terminating process listening to specific port

When terminating the process using the “kill -p” command, ensure that the service is not actively being used by any other process, as forcefully terminating it could lead to data corruption or loss.

Final Word

In this article, you learned different ways to terminate a process running on a specific port that would work for almost all major Linux distributions, such as Debian, Ubuntu, Red Hat, Fedora, Arch, Manjaro, etc. Well, if you have any questions or queries, feel free to tell us in the comment section.


How to Use awk to Perform Arithmetic Operations in Loops

$
0
0

https://www.tecmint.com/awk-arithmetic-operations

How to Use awk to Perform Arithmetic Operations in Loops


The awk command is a powerful tool in Linux for processing and analyzing text files, which is particularly useful when you need to perform arithmetic operations within loops.

This article will guide you through using awk for arithmetic operations in loops, using simple examples to make the concepts clear.

What is awk?

awk is a scripting language designed for text processing and data extraction, which reads input line by line, splits each line into fields, and allows you to perform operations on those fields. It’s commonly used for tasks like pattern matching, arithmetic calculations, and generating formatted reports.

The basic syntax of awk is:

awk 'BEGIN { initialization } { actions } END { finalization }' file
  • BEGIN: Code block executed before processing the input.
  • actions: Code block executed for each line of the input.
  • END: Code block executed after processing all lines.

Performing Arithmetic Operations in Loops

Let’s explore how to use awk to perform arithmetic operations within loops with the following useful examples to demonstrate key concepts.

Example 1: Calculating the Sum of Numbers

Suppose you have a file named numbers.txt containing the following numbers:

5
10
15
20

You can calculate the sum of these numbers using awk:

awk '{ sum += $1 } END { print "Total Sum:", sum }' numbers.txt

Explanation:

  • { sum += $1 }: For each line, the value of the first field $1 is added to the variable sum.
  • END { print "Total Sum:", sum }: After processing all lines, the total sum is printed.
Number Sum Calculation

Example 2: Calculating the Average

To calculate the average of the numbers:

awk '{ sum += $1; count++ } END { print "Average:", sum / count }' numbers.txt

Explanation:

  • count++: Increments the counter for each line.
  • sum / count: Divides the total sum by the count to calculate the average.
Calculate the Average of a Set of Numbers

Example 3: Multiplication Table

You can use awk to generate a multiplication table for a given number. For example, to generate a table for 5:

awk 'BEGIN { for (i = 1; i <= 10; i++) print "5 x", i, "=", 5 * i }'

Explanation:

  • for (i = 1; i <= 10; i++): A loop that runs from 1 to 10.
  • print "5 x", i, "=", 5 * i: Prints the multiplication table.
Multiplication table with awk

Example 4: Factorial Calculation

To calculate the factorial of a number (e.g., 5):

awk 'BEGIN { n = 5; factorial = 1; for (i = 1; i <= n; i++) factorial *= i; print "Factorial of", n, "is", factorial }'

Explanation:

  • n = 5: The number for which the factorial is calculated.
  • factorial *= i: Multiplies the current value of factorial by i in each iteration.
Factorial Calculation Example

Example 5: Summing Even Numbers

To sum only the even numbers from a file:

awk '{ if ($1 % 2 == 0) sum += $1 } END { print "Sum of Even Numbers:", sum }' numbers.txt

Explanation:

  • if ($1 % 2 == 0): Checks if the number is even.
  • sum += $1: Adds the even number to the sum.
Calculate the Sum of Even Numbers
Conclusion

The awk command is a versatile tool for performing arithmetic operations in loops. By combining loops, conditions, and arithmetic operators, you can handle a wide range of tasks efficiently.

Practice these examples and experiment with your own scripts to unlock the full potential of awk!

Viewing all 1417 articles
Browse latest View live