Quantcast
Channel: Sameh Attia
Viewing all 1407 articles
Browse latest View live

Zato—Agile ESB, SOA, REST and Cloud Integrations in Python

$
0
0
http://www.linuxjournal.com/content/zato%E2%80%94agile-esb-soa-rest-and-cloud-integrations-python

Zato is a Python-based platform for integrating applications and exposing back-end services to front-end clients. It's an ESB (Enterprise Service Bus) and an application server focused on data integrations. The platform doesn't enforce any limits on architectural style for designing systems and can be used for SOA (Service Oriented Architecture), REST (Representational State Transfer) and for building systems of systems running in-house or in the cloud.
At its current version of 1.1 (at the time of this writing), Zato supports HTTP, JSON, SOAP, SQL, AMQP, JMS WebSphere MQ, ZeroMQ, Redis NoSQL and FTP. It includes a browser-based GUI, CLI, API, security, statistics, job scheduler, HAProxy-based load balancer and hot-deployment. Each piece is extensively documented from the viewpoint of several audiences: architects, admins and programmers.
Zato servers are built on top of gevent and gunicorn frameworks that are responsible for handling incoming traffic using asynchronous notification libraries, such as libevent or libev, but all of that is hidden from programmers' views so they can focus on their job only.
Servers always are part of a cluster and run identical copies of services deployed. There is no limit on how many servers a single cluster can contain.
Each cluster keeps its configuration in Redis and an SQL database. The former is used for statistics or data that is frequently updated and mostly read-only. The latter is where the more static configuration shared between servers is kept.
Users access Zato through its Web-based GUI, the command line or API.
Zato promotes loose coupling, reusability of components and hot-deployment. The high-level goal is to make it trivial to access or expose any sort of information. Common integration techniques and needs should be, at most, a couple clicks away, removing the need to reimplement the same steps constantly, slightly differently in each integration effort.
Everything in Zato is about minimizing the interference of components on each other, and server-side objects you create can be updated easily, reconfigured on fly or reused in other contexts without influencing any other.
This article guides you through the process of exposing complex XML data to three clients using JSON, a simpler form of XML and SOAP, all from a single code base in an elegant and Pythonic way that doesn't require you to think about the particularities of any format or transport.
To speed up the process of retrieving information by clients, back-end data will be cached in Redis and updated periodically by a job-scheduled service.
The data provider used will be US Department of the Treasury's real long-term interest rates. Clients will be generic HTTP-based ones invoked through curl, although in practice, any HTTP client would do.

The Process and IRA Services

The goal is to make it easy and efficient for external client applications to access long-term US rates information. To that end, you'll make use of several features of Zato:
Zato encourages the division of each business process into a set of IRA services—that is, each service exposed to users should be:
  • Interesting: services should provide a real value that makes potential users pause for a moment and, at least, contemplate using the service in their own applications for their own benefit.
  • Reusable: making services modular will allow you to make use of them in circumstances yet unforeseen—to build new, and possibly unexpected, solutions on top of lower-level ones.
  • Atomic: a service should have a well defined goal, indivisible from the viewpoint of a service's users, and preferably no functionality should overlap between services.
The IRA approach closely follows the UNIX philosophy of "do one thing and do it well" as well as the KISS principle that is well known and followed in many areas of engineering.
When you design an IRA service, it is almost exactly like defining APIs between the components of a standalone application. The difference is that services connect several applications running in a distributed environment. Once you take that into account, the mental process is identical.
Anyone who already has created an interesting interface of any sort in a single-noded application written in any programming language will feel right like home when dealing with IRA services.
From Zato's viewpoint, there is no difference in whether a service corresponds to an S in SOA or an R in REST; however, throughout this article, I'm using the the former approach.

Laying Out the Services

The first thing you need is to diagram the integration process, pull out the services that will be implemented and document their purpose. If you need a hand with it, Zato offers its own API's documentation as an example of how a service should be documented (see https://zato.io/docs/progguide/documenting.html and https://zato.io/docs/public-api/intro.html):
  • Zato's scheduler is configured to invoke a service (update-cache) refreshing the cache once in an hour.
  • update-cache, by default, fetches the XML for the current month, but it can be configured to grab data for any date. This allows for reuse of the service in other contexts.
  • Client applications use either JSON or simple XML to request long-term rates (get-rate), and responses are produced based on data cached in Redis, making them super-fast. A single SIO Zato service can produce responses in JSON, XML or SOAP. Indeed, the same service can be exposed independently in completely different channels, such as HTTP or AMQP, each using different security definitions and not interrupting the message flow of other channels.
Figure 1. Overall Business Process

Implementation

The full code for both services is available as a gist on GitHub, and only the most interesting parts are discussed.
linuxjournal.update-cache
Steps the service performs are:
  • Connect to treasury.gov.
  • Download the big XML.
  • Find interesting elements containing the business data.
  • Store it all in Redis cache.
Key fragments of the service are presented below.
When using Zato services, you are never required to hard-code network addresses. A service shields such information and uses human-defined names, such as "treasury.gov"; during runtime, these resolve into a set of concrete connection parameters. This works for HTTP and any other protocol supported by Zato. You also can update a connection definition on the fly without touching the code of the service and without any restarts:

1 # Fetch connection by its name
2 out = self.outgoing.plain_http.get('treasury.gov')
3
4 # Build a query string the backend data source expects
5 query_string = {
6 '$filter':'month(QUOTE_DATE) eq {} and year(QUOTE_DATE) eq
{}'.format(month, year)
7 }
8
9 # Invoke the backend with query string, fetch
# the response as a UTF-8 string
10 # and turn it into an XML object
11 response = out.conn.get(self.cid, query_string)
lxml is a very good Python library for XML processing and is used in the example to issue XPath queries against the complex documentreturned:

1 xml = etree.fromstring(response)
2
3 # Look up all XML elements needed (date and rate) using XPath
4 elements = xml.xpath('//m:properties/d:*/text()',
↪namespaces=NAMESPACES)
For each element returned by the back-end service, you create an entry in the Redis cache in the format specified by REDIS_KEY_PATTERN—for instance, linuxjournal:rates:2013:09:03 with a value of 1.22:

1 for date, rate in elements:
2
3 # Create a date object out of string
4 date = parse(date)
5
6 # Build a key for Redis and store the data under it
7 key = REDIS_KEY_PATTERN.format(
8 date.year, str(date.month).zfill(2),
↪str(date.day).zfill(2))
9 self.kvdb.conn.set(key, rate)
10
12 # Leave a trace of our activity
13 self.logger.info('Key %s set to %s', key, rate)
linuxjournal.get-rate
Now that a service for updating the cache is ready, the one to return the data is so simple yet powerful that it can be reproduced in its entirety:

1 class GetRate(Service):
2 """ Returns the real long-term rate for a given date
3 (defaults to today if no date is given).
4 """
5 class SimpleIO:
6 input_optional = ('year', 'month', 'day')
7 output_optional = ('rate',)
8
9 def handle(self):
10 # Get date needed either from input or current day
11 year, month, day = get_date(self.request.input)
12
13 # Build the key the data is cached under
14 key = REDIS_KEY_PATTERN.format(year, month, day)
15
16 # Assign the result from cache directly to response
17 self.response.payload.rate = self.kvdb.conn.get(key)
A couple points to note:
  • SimpleIO was used—this is a declarative syntax for expressing simple documents that can be serialized to JSON or XML in the current Zato version, with more to come in future releases.
  • Nowhere in the service did you have to mention JSON, XML or even HTTP at all. It's all working on a high level of Python objects without specifying any output format or transport method.
This is the Zato way. It promotes reusability, which is valuable because a generic and interesting service, such as returning interest rates, is bound to be desirable in situations that cannot be predicted.
As an author of a service, you are not forced into committing to a particular format. Those are configuration details that can be taken care of through a variety of means, including a GUI that Zato provides. A single service can be exposed simultaneously through multiple access channels each using a different data format, security definition or rate limit independently of any other.

Installing Services

There are several ways to install a service:
  • Hot-deployment from the command line.
  • Hot-deployment from the browser.
  • Adding it to services-sources.txt—you can specify a path to a single module, to a Python package or a Python-dotted name by which to import it.
Let's hot-deploy what you have so far from the command line, assuming a Zato server is installed in /opt/zato/server1. You can do this using the cp command:

$ cp linuxjournal.py /opt/zato/server1/pickup-dir
$
Now in the server log:

INFO - zato.hot-deploy.create:22 - Creating tar archive
INFO - zato.hot-deploy.create:22 - Uploaded package id:[21],
↪payload_name:[linuxjournal.py]
Here's what just happened:
  • The server to be deployed was stored in an SQL database, and each server from a cluster was notified of the deployment of new code.
  • Each server made a backup of currently deployed services and stored it in the filesystem (by default, there's a circular log of the last 100 backups kept).
  • Each server imported the service and made it available for use.
All those changes were introduced throughout the whole cluster with no restarts and no reconfiguration.

Using the GUI to Configure the Resources Needed

Zato's Web admin is a GUI that can be used to create server objects that services need quickly, check runtime statistics or gather information needed for debugging purposes.
The Web admin is merely a client of Zato's own API, so everything it does also can be achieved from the command line or by user-created clients making API calls.
On top of that, server-side objects can be managed "en masse" using a JSON-based configuration that can be kept in a config repository for versioning and diffing. This allows for interesting workflows, such as creating a base configuration on a development environment and exporting it to test environments where the new configuration can be merged into an existing one, and later on, all that can be exported to production.
Figures 2–6 show the following configs:
  • Scheduler's job to invoke the service updating the cache.
  • Outgoing HTTP connection definitions for connecting to treasury.gov.
  • HTTP channels for each client—there is no requirement that each client be given a separate channel but doing so allows one to assign different security definitions to each channel without interfering with any other.
Figure 2. Scheduler Job Creation Form
Figure 3. Outgoing HTTP Connection Creation Form
Figure 4. JSON Channel Creation Form
Figure 5. Plain XML Channel Creation Form
Figure 6. SOAP Channel Creation Form

Testing It

update-cache will be invoked by the scheduler, but Zato's CLI offers the means to invoke any service from the command line, even if it's not mounted on any channel, like this:

$ zato service invoke /opt/zato/server1 linuxjournal.update-cache
↪--payload '{}'
(None)
$
There was no output, because the service doesn't produce any. However, when you check the logs you notice:

INFO - Key linuxjournal:rates:2013:09:03 set to 1.22
Now you can invoke get-rate from the command line using curl with JSON, XML and SOAP. The very same service exposed through three independent channels will produce output in three formats, as shown below (output slightly reformatted for clarity).
Output 1:

$ curl localhost:17010/client1/get-rate -d
↪'{"year":"2013","month":"09","day":"03"}'
↪{"response": {"rate": "1.22"}}
$
Output 2:

$ curl localhost:17010/client2/get-rate -d '
20130903'


K295602460207582970321705053471448424629
ZATO_OK


1.22


$
Output 3:

$ curl localhost:17010/client3/get-rate \
-H "SOAPAction:get-rates" -d '


2013
09
03


'


K175546649891418529601921746996004574051
ZATO_OK


1.22


$

IRA Is the Key

IRA (Interesting, Reusable, Atomic) is the key you should always keep in mind when designing services that are to be successful.
Both the services presented in the article meet the following criteria:
  • I: focus on providing data interesting to multiple parties.
  • R: can take part in many processes and be accessed through more than one method.
  • A: focus on one job only and do it well.
In this vein, Zato makes it easy for you to expose services over many channels and to incorporate them into higher-level integration scenarios, thereby increasing their overall attractiveness (I in IRA) to potential client applications.
It may be helpful to think of a few ways not to design services:
  • Anti-I: update-cache could be turned into two smaller services. One would fetch data and store it in an SQL database; the other would grab it from SQL and put it into Redis. Even if such a design could be defended by some rationale, neither of the pair of services would be interesting for external applications. A third service wrapping these two should be created and exposed to client apps, in the case of it being necessary for other systems to update the cache. In other words, let's keep the implementation details inside without exposing them to the whole world.
  • Anti-R: hard-coding nontrivial parameters is almost always a poor idea. The result being that a service cannot be driven by external systems invoking it with a set of arguments. For instance, creating a service that is limited to a specific year only ensures its limited use outside the original project.
  • Anti-A: returning a list of previous queries in response to a request may be a need of one particular client application, but contrary to the needs of another. In cases when a composite service becomes necessary, it should not be obliged upon each and every client.
Designing IRA services is like designing a good programming interface that will be released as an open-source library and used in places that can't be predicted initially.

Born Out of Practical Experience

Zato it not only about IRA but also about codifying common admin and programming tasks that are of a practical nature:
  • Each config file is versioned automaticallyand kept in a local bzr repository, so it's always possible to revert to a safe state. This is completely transparent and needs no configuration nor management.
  • A frequent requirement before integration projects are started, particularly if certain services already are available on the platform, is to provide usage examples in the form of message requests and responses. Zato lets you specify that one-in-n invocations of a service be stored for a later use, precisely so that such requirements can be fulfilled by admins quickly.
Two popular questions asked regarding production are: 1) What are my slowest services? and 2) Which services are most commonly used? To answer these, Zato provides statisticsthat can be accessed via Web admin, CLI or API. Data can be compared over arbitrary periods or exported to CSV as well.
Figure 7. Sample Statistics

Summary

Despite being a relatively new project, Zato is already a lightweight yet complete solution that can be used in many integration and back-end scenarios. Regardless of the project's underlying integration principles, such as SOA or REST, the platform can be used to deliver scalable architectures that are easy to use, maintain and extend.

Become a GCC expert with these little-known command-line options

$
0
0
http://www.openlogic.com/wazi/bid/332308/become-a-gcc-expert-with-these-little-known-command-line-options


The GNU Compiler Collection (GCC) is easy to use, but it offers so many command-line options that no one can remember them all. Here are five uncommon command-line options you can use to get the most out of GCC.
To illustrate these examples, I used GCC 4.7.3 running on Ubuntu Linux 13.04 with Bash 4.2.45.

-save-temps

In simplest terms, the GCC compilation process internally follows four stages:
  • In the first stage, the preprocessor expands all the macros and header files, and strips off comments.
  • In the second stage, the compiler acts on the preprocessed code to produce assembly instructions.
  • In the third stage, the assembler converts the assembly instructions into machine-level code (object files).
  • In the final stage, the linker resolves all the unresolved symbols and combines all the object files to produce an executable.
When you compile a C/C++ source file using gcc, your final output is an executable program. But in some situations you might want to know how the preprocessor expanded a particular macro, or you might just want to take a look at the assembly instructions. To see the intermediate output produced after each of the compilation stages, use the -save-temps option.
For instance, suppose you compile the program helloworld.c using the -save-temps option:
$ gcc -Wall -save-temps helloworld.c -o helloworld
Along with the final executable, gcc produces three other files. helloworld.i is the output of the preprocessing stage, helloworld.s is the output of the compilation stage, and helloworld.o is the output of the assembly stage.

-Wextra

Many developers use the option -Wall to enable warnings during the compilation process, but -Wall does not report all possible warnings. It leaves out, for example, warnings about:
  • Missing parameter type
  • Comparison of a pointer with integer zero using >, <, >=, or <=.
  • Ambiguous virtual bases
If the compiler does not warn you about these problems, your program might produce undesired results when you run it. Consider the following code:
#include

void func(a)
{
printf("\n func() is passed parameter [%d]\n",a);
return;
}

int main(void)
{
printf("\n HELLO \n");
func(0xFFFFF);

return 0;
}
As you can see, the type of the argument "a" is not specified in function func(). This could be a typo on the part of the programmer who, for example, meant to declare "a" as a "long long" integer, but without that declaration the compiler will assume the default type of variable "a" as int. If you compile this code with the -Wall option, gcc does not produce any warning, and the program could produce undesired results. For example, if a "long long" value that is larger than the maximum value that an "int" can hold is passed as an argument to func(), the program will behave incorrectly.
If you compile the same code with the -Wextra option enabled, you should see the following output:
$ gcc -Wall -Wextra helloworld.c -o helloworld
helloworld.c: In function 'func':
helloworld.c:4:6: warning: type of 'a' defaults to 'int' [-Wmissing-parameter-type]
Once you know about this problem, you can easily fix it by explicitly mentioning the type of function argument "a."
-Wextra offers similar warnings for pointer comparison problems. Consider the following code:
#include

void func()
{
int a = -1;
int *ptr = &a;

if(ptr >= 0)
{
a = a+1;
}
printf("\n a = [%d]\n",a);
return;
}

int main(void)
{
printf("\n HELLO \n");
func();

return 0;
}
The pointer "ptr" is being compared with the integer zero in the function func(). This statement is useless, as ptr clearly contains the address of the variable "a," which will always be a positive value. The programmer must have missed the dereference operator * before ptr while comparing its value with zero. Just as in the previous example, if you compile this code with the -Wall option, gcc does not produce any warning, but the program will produce wrong result (a=0) in the output. On the other hand, when you use -Wextra, gcc reports:
$ gcc -Wall -Wextra helloworld.c -o helloworld
helloworld.c: In function 'func':
helloworld.c:9:12: warning: ordered comparison of pointer with integer zero [-Wextra]
As soon as you see a warning related to pointer comparison with zero, you immediately know you have a typo in your code, which you can easily fix by replacing (ptr>=0) with ((*ptr)>=0) in this case.
Read the gcc man page for other warnings -Wextra produces.

-Wfloat-equal

New programmers sometimes try to compare floating point variables using the == operator – something you should never do because of the way floating point numbers are represented internally. The gcc compiler's -Wfloat-equal option produces a warning whenever it encounters a floating point comparison. Consider:
#include

void func(float a, float b)
{
printf("\n Inside func() \n");
if(a == b)
{
printf("\n a == b\n");
}
return;
}


int main(void)
{
printf("\n HELLO \n");
func(1.345, 1.345678);

return 0;
}
Here, the float arguments to the function func() are being compared using the == operator. When you compile this code without using the -Wfloat-equal option, you'll see no warning, but with it, you should see output like this:
$ gcc -Wfloat-equal helloworld.c -o helloworld
helloworld.c: In function 'func':
helloworld.c:7:10: warning: comparing floating point with == or != is unsafe [-Wfloat-equal]
If you see that your code is directly comparing floats, you should drop the direct comparison and think of better logic to solve the problem.

-g

If you use the GNU debugger (GDB) to debug, or Valgrind to detect memory leaks in your program, always compile the program with the -g option, which produces debugging information in the operating system's native format. Other tools can use this information to produce detailed output.
To see how it works, suppose the source file helloworld.c contains following code:
#include
#include
#include

void func()
{
char *p = (char*) malloc(10);
printf("\n Inside func() \n");
return;
}

int main(void)
{
printf("\n HELLO \n");
func();

return 0;
}
If you compile the code without the -g option and run Valgrind's memcheck tool, you'll see a problem – a memory leak:
$ valgrind --tool=memcheck --leak-check=yes ./helloworld
==3471== Memcheck, a memory error detector
==3471== Copyright (C) 2002-2012, and GNU GPL'd, by Julian Seward et al.
==3471== Using Valgrind-3.8.1 and LibVEX; rerun with -h for copyright info
==3471== Command: ./helloworld
==3471==

HELLO

Inside func()
==3471==
==3471== HEAP SUMMARY:
==3471== in use at exit: 10 bytes in 1 blocks
==3471== total heap usage: 1 allocs, 0 frees, 10 bytes allocated
==3471==
==3471== 10 bytes in 1 blocks are definitely lost in loss record 1 of 1
==3471== at 0x4C2CD7B: malloc (in /usr/lib/valgrind/vgpreload_memcheck-amd64-linux.so)
==3471== by 0x40058D: func (in /home/himanshu/practice/helloworld_dir/helloworld)
==3471== by 0x4005B6: main (in /home/himanshu/practice/helloworld_dir/helloworld)
==3471==
==3471== LEAK SUMMARY:
==3471== definitely lost: 10 bytes in 1 blocks
==3471== indirectly lost: 0 bytes in 0 blocks
==3471== possibly lost: 0 bytes in 0 blocks
==3471== still reachable: 0 bytes in 0 blocks
==3471== suppressed: 0 bytes in 0 blocks
==3471==
==3471== For counts of detected and suppressed errors, rerun with: -v
==3471== ERROR SUMMARY: 1 errors from 1 contexts (suppressed: 2 from 2)
The memcheck tool is able to detect the memory leak, but it is unable to say where the leak actually takes place. Without that information, you could have a big problem tracking down the leak when you're working on projects that contain large source files.
If instead you compile the code with the -g option before you run memcheck, the tool can pinpoint the problem:
$ valgrind --tool=memcheck --leak-check=yes ./helloworld
==3517== Memcheck, a memory error detector
==3517== Copyright (C) 2002-2012, and GNU GPL'd, by Julian Seward et al.
==3517== Using Valgrind-3.8.1 and LibVEX; rerun with -h for copyright info
==3517== Command: ./helloworld
==3517==

HELLO

Inside func()
==3517==
==3517== HEAP SUMMARY:
==3517== in use at exit: 10 bytes in 1 blocks
==3517== total heap usage: 1 allocs, 0 frees, 10 bytes allocated
==3517==
==3517== 10 bytes in 1 blocks are definitely lost in loss record 1 of 1
==3517== at 0x4C2CD7B: malloc (in /usr/lib/valgrind/vgpreload_memcheck-amd64-linux.so)
==3517== by 0x40058D: func (helloworld.c:7)
==3517== by 0x4005B6: main (helloworld.c:16)
==3517==
==3517== LEAK SUMMARY:
==3517== definitely lost: 10 bytes in 1 blocks
==3517== indirectly lost: 0 bytes in 0 blocks
==3517== possibly lost: 0 bytes in 0 blocks
==3517== still reachable: 0 bytes in 0 blocks
==3517== suppressed: 0 bytes in 0 blocks
==3517==
==3517== For counts of detected and suppressed errors, rerun with: -v
==3517== ERROR SUMMARY: 1 errors from 1 contexts (suppressed: 2 from 2)
You might also want to profile your program. Code profiling can tell you things such as how much time each function consumes, how many times a function gets called, and which parts of your program are slow and need improvement. In Linux, a popular code profiling tools is the GNU profiler, or gprof. This tool requires the code to be compiled (and linked) using gcc's -pg option. GNU gprof produces detailed profiling information in form of flat profile and call graph.

@file

All of these options may be useful, and you may want to use some or all of them together for all of your compiles. If you find yourself using many command-line options while compiling your programs, you can put all the options in a file and pass the file name to gcc to use all the flags in the file together. For instance, you could create a file named options that contains the line -Wall -Wextra -Wfloat-equal, then pass the file name as a command-line option to gcc:
$ gcc @options helloworld.c -o helloworld
Keeping your gcc compiler options in an options file makes managing multiple command-line options easy.

How to Chroot SFTP Users on Linux for maximum security

$
0
0
http://linuxaria.com/article/how-to-chroot-sftp-users-on-linux-for-maximum-security?lang=en

A chroot on Unix operating systems is an operation that changes the apparent root directory for the current running process and its children. A program that is run in such a modified environment cannot name (and therefore normally not access) files outside the designated directory tree. The term “chroot” may refer to the chroot(2) system call or the chroot(8) wrapper program. The modified environment is called a “chroot jail”. From Wikipedia.
Why it is required? If you want to set up your Linux box as a web hosting server for its users, you may need to give SFTP access. But they can get access to whole system Linux tree, just for reading but still very unsecure. So it is mandatory to lock them in their home directory.
There are many other applications, it’s just a common example, so lets start its configuration.


Linux Box Detail:

Its mine Linux Box, your Linux system may vary. Only thing to take care is the openssh-server version, because openssh-server-5.3p1 support SFTP chroot. Older version supports but its tricky, please let me k now if you want to know that too.
Operating System: CentOS 6.3/x86_64
Kernel Version: 2.6.32-279.19.1.el6/x86_64
Openssh Server Version: openssh-server-5.3p1-81.el6_3/x86_64
chroot

sshd Server Configuration:

Add the following tail output to your Linux box’s SSH
server configuration file /etc/ssh/sshd_config.
[rahulpanwar@myhost ~]# tail -6 /etc/ssh/sshd_config
#Subsystem sftp /usr/libexec/openssh/sftp-server
Subsystem sftp internal-sftp
Match Group www-hosting
ChrootDirectory %h
ForceCommand internal-sftp
AllowTcpForwarding no
Then restart sshd service to enable this configuration.
[rahulpanwar@myhost ~]# sudo /etc/init.d/sshd restart

Create Chroot Users:

[rahulpanwar@myhost ~]# sudo mkdir /etc/skel/public_html
[rahulpanwar@myhost ~]# sudo groupadd www-hosting
[rahulpanwar@myhost ~]# sudo useradd -s /sbin/nologin -g www-hosting linuxexplore.com

Setting Permissions:

[rahulpanwar@myhost ~]# sudo chown root:www-hosting /home/linuxexplore.com
[rahulpanwar@myhost ~]# sudo chmod 755 /home/linuxexplore.com
That’s all now create multiple users for web hosting, and offer the secure sftp access to your customers.

Shell Script to Create Web Hosting Users:

#!/bin/bash
HOSTING_DIR="/etc/skel/public_html"
CHROOT_GRP="www-hosting"
USR_NAME="$1"

[ ! -d "$HOSTING_DIR" ] && mkdir -p $HOSTING_DIR
grep ^"${CHROOT_GRP}:" /etc/group || /usr/sbin/groupadd www-hosting
grep ^"${USR_NAMEP}:" /etc/passwd || /usr/sbin/useradd -s /sbin/nologin -g $CHROO_GRP $USR_NAME
chown root:$CHROOT_GRP /home/$USR_NAME
chmod 755 /home/$USR_NAME

Selinux Configuration:

Disable the selinux permanently or configure it for read write user’s home directory in SSH chroot.
[rahulpanwar@myhost ~]# sudo setsebool -P ssh_chroot_rw_homedirs on
[rahulpanwar@myhost ~]# sudo restorecon -R /home/$USERNAME

Troubleshooting

sshd[3505]: fatal: bad ownership or modes for chroot directory "/home/linuxexplore.com"
It’s ChrootDirectory ownership problem, sshd will reject sftp connections to accounts that are set to chroot into any directory that has ownership/permissions that sshd doesn’t consider secure. sshd’s apparently strict ownership/permissions requirements dictate that every directory in the chroot path must be owned by root and only writable for the owner. So, for example, if the chroot environment is in a user’s home directory both /home and /home/username must be owned by root and have permissions like 755 or 750 ( group ownership should allow user to access ).
If you are using sftp with public key check the following link:
http://www.centos.org/modules/newbb/viewtopic.php?topic_id=37903&forum=59
If chroot environment is in user’s home directory, make sure user have access to its home directory, or user would not be able to access its publickey, produce the error given in above CentOS forum link.

Code performance with gprof

$
0
0
http://www.linuxuser.co.uk/tutorials/code-performance-with-gprof

Learn how gprof can help you to identify the performance bottlenecks in your program’s source code


Code profiling is an important aspect of software development. It is mostly done to identify those code snippets that consume more time than expected, or to understand and trace the call flow of functions. This not only aids in debugging many tricky problems, but also helps the programmer to improve the software’s performance.
Although performance requirements vary from program to program, it’s always advantageous to have minimum performance bottlenecks in the final product. For example, a video player will usually have very strict speed requirements while a calculator might not have the same kind of requirements. Even so, a better-performing calculator will always be preferred.
There are many tools available for code profiling in Linux, but one of the popular tools is the GNU profiler – gprof. It is a free program that comes as a part of GNU binary utils and is based on BSD gprof.
The sample code (sampleCode.c – on the disc) used in this guide is written in the C programming language and compiled using GCC 4.7.3. All the commands are executed on Bash 4.2.45 and the gprof version used is 2.23.2. The whole test environment is built on Ubuntu 13.04.
Profile your code with gprof

Resources

Gprof
Gprof code

Step-by-step

Step 01 Compile profiling-enabled code
In order to profile a code, the first step is to enable profiling while the code is being compiled and linked. In most cases, the command line option -pg should enable profiling.
If compilation and linking commands are used separately, then this option is to be used in both cases. For example:
gcc -Wall -c sampleCode.c -pg
gcc -Wall sampleCode.o -o sampleCode -pg
And if compilation and linking is being done in the same command then this option also needs to be added. For example:
gcc -Wall sampleCode.c -o sampleCode -pg
Step 02 Execute the binary – part 1
After the program is compiled (and linked) for profiling, the next step is to execute it. One important point to remember is that the program execution should happen in such a way that all the code blocks (or at least the ones you want to profile) get executed. So make sure that command-line arguments and inputs are given to the program accordingly.
Here is how the profiling-enabled executable program ‘sampleCode’ was executed:
./sampleCode
Count = [1000000000]
So you can see that the program ‘sampleCode’ executed and exited normally.
Step 03 Execute the binary – part 2
Once the program is executed, it produces a file named gmon.out.
ls gmon.out
gmon.out
This file contains the profiling data of the code blocks that were actually hit during the program execution. It is not a regular text file and therefore cannot be read normally. This can be confirmed by using the file command in Linux.
file gmon.out
gmon.out: GNU prof performance data - version 1
Note 1: The file gmon.out is not produced if the program abnormally terminates because of, say, an unhandled signal, by calling _exit() function directly etc.
Note 2: This file gets created in the working directory of the program at the time of its exit. So, make sure that the program has required permissions for the same.
Note 3: A profiling-enabled program always produces a file named gmon.out. So, make sure that an existing file with this name is not overwritten.
Step 04 Execute gprof
Once the profiling data (gmon.out) is available, the gprof tool can be used to analyse and produce meaningful data from it. Here is the general syntax of the gprof command :
gprof [command-line-options] [executable- file-name] [profiling-data-file-name] > [output-file]
So, the gprof command accepts the executable filename, profiling data filename and the required command-line options to produce human- readable profiling information which can be redirected to an output file.
But, in the simplest form, the command-line tool gprof does not require any argument (the arguments within [ ] are not mandatory). When no argument is supplied, gprof looks for a.out as the default executable-file-name and gmon.out as profiling-data-file-name in the current directory, and the default output is produced on standard output – stdout.
Let’s run gprof in our case :
gprof sampleCode gmon.out > prof_output
The command above redirects the output of gprof to a file named prof_output. This file will now contain human-readable profiling information in the form of a flat profile and call graph (more on these later).
Step 05 Annotated source
The annotated source listing gives an idea about the number of times each line of the program was executed. To get the annotated source listing …
First compile the source code with the -g option. This option enables debugging:
gcc -Wall -pg -g sampleCode.c -o sampleCode
Next, while running the gprof command, use the command-line option -A to produce the annotated source listing:
gprof -A sampleCode gmon.out > prof_ output
Step 06 Flat profile
The flat profile (see screen grab at top of page) shows how much time your program spent in each function, and how many times that function was called. If you simply want to know which functions burn most of the cycles, it is stated concisely here.
The different columns in the Flat Profile table represent :
% time – The percentage of the total running time of the program used by this function.
cumulative seconds – A running sum of the number of seconds accounted for by this function and those listed above it.
self seconds – The number of seconds accounted for by this function alone. This is the major sort for this listing.
calls – The number of times this function was invoked (if this function is profiled, else blank).
self ms/call – The average number of milliseconds spent in this function per call (if this function is profiled, else blank).
total ms/call – The average number of milliseconds spent in this function and its descendants per call (if this function is profiled, else blank).
name – The name of the function. This is the minor sort for this listing. The index shows the location of the function in the gprof listing. If the index is in parentheses, it shows where it would appear in the gprof listing if it were to be printed.
Step 07 Call graph
The Call Graph (see screen below) shows, for each function, which functions called it, which other functions it called, and how many times. There is also an estimate of how much time was spent in the subroutines of each function. This can suggest places where you might try to eliminate function calls that use a lot of time.
Each entry in this table consists of several lines. The line with the index number at the left- hand margin lists the current function. The lines above it list the functions that called this function, and the lines below it list the functions this one called. This line lists:
index – A unique number given to each element of the table. Index numbers are sorted numerically. The index number is printed next to every function name so it is easier to look up where the function is in the table.
% time – This is the percentage of the ‘total’ time that was spent in this function and its children. Note that due to different viewpoints, functions excluded by options etc, these numbers will not add up to 100%.
self – This is the total amount of time spent in this function. For the function’s parents, this is the amount of time that was propagated directly from the function into this parent. For the function’s children, this is the amount of time that was propagated directly from the child into the function.
children – This is the total amount of time propagated into this function by its children.
For the function’s parents, it’s the amount of time that was propagated from the function’s children into this parent. For the function’s children, this is the amount of time that was propagated from the child’s children to the function.
called – This is the number of times the
function was called. If the function called itself recursively, the number only includes non- recursive calls and is followed by a ‘+’ and the number of recursive calls.
For the function’s parents, this is the number of times this parent called the function / the total number of times the function was called. For the function’s children, this is the number of times the function called this child / the total number of times the child was called
name – The name of the current function. The index number is printed after it. If the function is a member of a cycle, the cycle number is printed between the function’s name and the index number.
For the function’s parents, this is the name of the parent. For the function’s children, this is the name of the child.
Step 08 Exclude a particular function
To exclude a particular function from the flat profile or call graph, use the -P or -Q option respectively, along with the function name as
the argument.
For example, the following command would exclude the flat profile- and call graph-related details of func_a :
gprof -b -Pfunc_a -Qfunc_a sampleCode gmon.out > prof_output
Step 09 Profile a particular function
To fetch the flat profile and call graph information of only a particular function, use the -p and -q options respectively along with the function name as the argument.
For example, the following command would produce the flat profile- and call graph-related details of func_a:
gprof -b -pfunc_a -qfunc_a sampleCode gmon.out > prof_output
Step 10 Suppress verbose blurbs
By default, the gprof output contains detailed explanation of each column of flat profile and call graph. This is good for beginners, but you may want to suppress these details once you know everything. The command-line option -b (or -brief) can be used for this purpose.

Seven expert tools for advanced string search in PostgreSQL

$
0
0
http://www.openlogic.com/wazi/bid/334546/seven-expert-tools-for-advanced-string-search-in-postgresql


You can improve PostgreSQL text search performance by executing searches directly in the database interface layer. Advanced text search mechanisms include SELECT LIKE queries, queries with regular expressions, the Levenshtein algorithm, Trigram, TSvector and TSquery, and Metaphone.

To get started, first make sure you have installed the latest stable version of PostgreSQL on your CentOS server. Pick the correct RPM package for your architecture from the download page and run the necessary commands to install PostgreSQL:

wget http://yum.postgresql.org/9.3/redhat/rhel-6-i386/pgdg-centos93-9.3-1.noarch.rpm
rpm -ivH pgdg-centos93-9.3-1.noarch.rpm
yum install postgresql93-devel postgresql93-server postgresql93-contrib

Next, initialize the PostgreSQL cluster, start the server, enter the command-line interface, and create a new database:

service postgresql-9.3 initdb
Initializing database: [ OK ]
/etc/init.d/postgresql-9.3 start
Starting postgresql-9.3 service: [ OK ]
su postgres
bash-4.1$ psql
postgres=# create database vehicles;
CREATE DATABASE

Connect to the new database, set up tables, and add some sample data for a test case:
postgres=# \c vehicles;
You are now connected to database "vehicles" as user "postgres".
vehicles=# CREATE TABLE cars(id SERIAL PRIMARY KEY NOT NULL, name TEXT NOT NULL, description TEXT NOT NULL);
CREATE TABLE
vehicles=# INSERT INTO cars(name, description) VALUES ('BMW X5', 'Luxury German SUV with front-engine and four-wheel-drive'), ('Mercedes SLR', 'Luxury German grand tourer with front-engine and rear-wheel-drive'), ('Cadillac Escalade', 'Luxury USA SUV with front-engine and rear-wheel-drive or four-wheel-drive'),('Volkswagen Phaeton', 'Luxury German sedan with front-engine and four-wheel drive'), ('Ford Probe', 'USA sports coupe with front-engine and rear-wheel drive'), ('Honda City', 'Japanese compact car with front-engine and front-wheel drive'), ('KIA Sportage', 'South-Korean crossover with front-engine and rear-wheel-drive or four-wheel-drive'),('Skoda Yeti', 'Czech compact SUV with front-engine and front-wheel-drive or four-wheel-drive');
INSERT 0 8
vehicles=# CREATE TABLE engines_manufacturers(id SERIAL PRIMARY KEY NOT NULL, manufacturer_name TEXT NOT NULL);
CREATE TABLE
vehicles=# INSERT INTO engines_manufacturers(manufacturer_name) VALUES ('BMW'),('McLaren'),('GM'),('Mercedes Benz'),('Ford Motor Company'),('VW'),('Hyundai-Kia'),('Peugeot Citroen Moteurs'),('Honda Motor Company');
INSERT 0 9
vehicles=# CREATE TABLE cars_engines(cars_id INT REFERENCES cars NOT NULL, engines_id INT REFERENCES engines_manufacturers NOT NULL, UNIQUE(cars_id,engines_id));
CREATE TABLE
vehicles=# INSERT INTO cars_engines(cars_id,engines_id) VALUES(1,1),(2,2),(3,3),(4,6),(5,5),(6,9),(7,7),(8,6);
INSERT 0 8

Standard string search methods

PostgreSQL comes with two built-in mechanisms for string searches. Let's start with the one based on the standard SQL LIKE query structure. LIKE and ILIKE (case-insensitive) syntax can include the wild-card characters % and _ before and after the searched string. The percent sign replaces any given sequence of characters, while the underscore replaces a single character. For instance, this query lists records that include "luxury" and "suv" in any case in their description fields:

vehicles=# SELECT name, description FROM cars WHERE description ILIKE '%luxury%suv%';
name | description
-------------------+---------------------------------------------------------------------------
BMW X5 | Luxury German SUV with front-engine and four-wheel-drive
Cadillac Escalade | Luxury USA SUV with front-engine and rear-wheel-drive or four-wheel-drive
(2 rows)

You can also search for strings in text based on POSIX-style regular expressions. The ~ match operator must precede a regular expression. You can use the optional ! operator to inverse the logic (not match) and the * operator for case-insensitive search. The following query list all non-German cars from our database built by VW:

vehicles=# SELECT cars.name as Cars, engines_manufacturers.manufacturer_name as Manufacturer FROM cars INNER JOIN cars_engines ON cars.id = cars_engines.cars_id INNER JOIN engines_manufacturers ON cars_engines.engines_id = engines_manufacturers.id WHERE engines_manufacturers.manufacturer_name ILIKE 'vw' AND cars.description !~* '.*german.*';
cars | manufacturer
------------+--------------
Skoda Yeti | VW
(1 row)

Fuzzy string matching

In addition to the standard solutions, PostgreSQL has several contributed packages that allow you to perform more complicated text searches. You'll find them in the PostgreSQL contrib package (in our case postgresql93-contrib), which we installed earlier.

The Levenshtein algorithm calculates the distance between two strings based on the total number of steps that should be completed to change one of the strings into the other. To determine the number of steps, it adds one point for each new character added, existing character removed, and replaced character.

Install and verify the fuzzystrmatch extension, which implements the Levenshtein algorithm, by running the command CREATE EXTENSION fuzzystrmatch;. You can then use the function to see the closest car name to a particular string – for example, "Sportage." Notice that even the difference in case adds one point to the calculation:

vehicles=# SELECT id, name FROM cars WHERE levenshtein(name, 'sportage') <=5;
id | name
----+--------------
7 | KIA Sportage
(1 row)
vehicles=# SELECT id, name FROM cars WHERE levenshtein(name, 'sportage') <=4;
id | name
----+------
(0 rows)
vehicles=# SELECT id, name FROM cars WHERE levenshtein(lower(name), lower('sportage')) <=4;
id | name
----+--------------
7 | KIA Sportage
(1 row)

Trigram

Another tool for string searches, Trigram, splits the chosen string into substrings of three consecutive characters. The query result lists the string with most matching trigrams. That makes it especially useful if you enter a string in your query that may have slight misspellings. According to the PostgreSQL documentation each word is considered to have two spaces prefixed and one space suffixed when determining the set of trigrams contained in the string.

Install Trigram by executing the command CREATE EXTENSION pg_trgm; then query on the string "Ford":

vehicles=# select show_trgm('Ford');
show_trgm
-----------------------------
{" f"," fo",for,ord,"rd "}
(1 row)

You can directly use the specific Trigram SELECT FROM WHERE % construction, but when you have a really large table with many records, you should optimize the searching process by creating a special index on the text column you plan to search before running the actual SELECT query. The Generalized Index Search Tree (GIST) provides fast text searches by converting the text into a vector of trigrams:

vehicles=# CREATE INDEX cars_name_trigram ON cars USING gist(name gist_trgm_ops);
CREATE INDEX

You can then look for a car model in your table even without spelling it correctly. Trigram's default similarity threshold is 0.3. You can change it to anything between 0 and 1; the smaller it gets, the more spelling error-tolerant it becomes.

vehicles=# select show_limit();
show_limit
------------
0.3
(1 row)
vehicles=# SELECT * FROM cars WHERE name % 'Folkswagen';
id | name | description
----+--------------------+------------------------------------------------------------
4 | Volkswagen Phaeton | Luxury German sedan with front-engine and four-wheel drive
(1 row)
vehicles=# SELECT * FROM cars WHERE name % 'Folkswagon';
id | name | description
----+------+-------------
(0 rows)
vehicles=# select set_limit(0.2);
set_limit
-----------
0.2
(1 row)
vehicles=# SELECT * FROM cars WHERE name % 'Folkswagon';
id | name | description
----+--------------------+------------------------------------------------------------
4 | Volkswagen Phaeton | Luxury German sedan with front-engine and four-wheel drive
(1 row)

TSvector and TSquery

TSvector and TSquery allow full-text searches based on several words from an entire sentence. TSvector splits the full text against which you want to run the query into an array of tokens (words) called lexemes, which are stored in TSvector along with their position in the text. TSquery performs the actual query. You can specify the language whose dictionary should be used and the words that should be matched. The words are united with the combining operator &. The vector and the query interact via the full-text query operator @@. For example, you can see the luxury SUVs from your database with a query such as:

vehicles=# SELECT name, description FROM cars WHERE to_tsvector(description) @@ to_tsquery('english', 'luxury & SUVs');
name | description
-------------------+---------------------------------------------------------------------------
BMW X5 | Luxury German SUV with front-engine and four-wheel-drive
Cadillac Escalade | Luxury USA SUV with front-engine and rear-wheel-drive or four-wheel-drive
(2 rows)

As you can see, PostgreSQL returns the correct result even if one of the searched words is written in a plural form recognized as such by the dictionary used.

You can run the queries for text searches in different languages. PostgreSQL bundles more than a dozen text search dictionaries:

vehicles=# \dFd
List of text search dictionaries
Schema | Name | Description
------------+-----------------+-----------------------------------------------------------
pg_catalog | danish_stem | snowball stemmer for danish language
pg_catalog | dutch_stem | snowball stemmer for dutch language
pg_catalog | english_stem | snowball stemmer for english language
pg_catalog | finnish_stem | snowball stemmer for finnish language
pg_catalog | french_stem | snowball stemmer for french language
pg_catalog | german_stem | snowball stemmer for german language
pg_catalog | hungarian_stem | snowball stemmer for hungarian language
pg_catalog | italian_stem | snowball stemmer for italian language
pg_catalog | norwegian_stem | snowball stemmer for norwegian language
pg_catalog | portuguese_stem | snowball stemmer for portuguese language
pg_catalog | romanian_stem | snowball stemmer for romanian language
pg_catalog | russian_stem | snowball stemmer for russian language
pg_catalog | simple | simple dictionary: just lower case and check for stopword
pg_catalog | spanish_stem | snowball stemmer for spanish language
pg_catalog | swedish_stem | snowball stemmer for swedish language
pg_catalog | turkish_stem | snowball stemmer for turkish language
(16 rows)

Here again, full-text search with really large tables can be quite slow. You can use the Generalized Inverted Index (GIN) to significantly increase the searching speed and improve the performance. It needs more time to be generated compared to GIST, but it runs faster. GIN indexes are preferred when you work with mostly static data, since queries will be completed much faster. GIST indexes are updated much faster when new data is inserted in the corresponding table, so they are more suitable for dynamic data.

vehicles=# CREATE INDEX cars_vector_search ON cars USING gist(to_tsvector('english', description));                          CREATE INDEX

Metaphone

Finally, the Metaphone algorithm, which is installed with the fuzzystrmatch extension, matches the searched string by the way it sounds. Metaphone allows more liberty than the other text searching tools described above when it comes to the way a searched word is spelled. It is the most spelling error-tolerant tool listed in the article.

vehicles=# SELECT metaphone('Honda City', 5);
metaphone
-----------
HNTST
(1 row)

A similar function, dmetaphone (short for double metaphone) generates two output strings based on the way a source string sounds, from the results of the dmetaphone() and dmetaphone_alt() functions. Usually they return same results, but when it comes to non-English names the results might be different, depending on the pronunciation. Using dmetaphone instead of metaphone gives you better chance to match the misspelled word with the original one stored in your database.
You can run several sample queries to become acquainted with the functions:

vehicles=# select manufacturer_name, metaphone(manufacturer_name,11), dmetaphone(manufacturer_name), dmetaphone_alt(manufacturer_name) from engines_manufacturers where engines_manufacturers.id=8;
manufacturer_name | metaphone | dmetaphone | dmetaphone_alt
-------------------------+-------------+------------+----------------
Peugeot Citroen Moteurs | PJTSTRNMTRS | PJTS | PKTS
(1 row)
vehicles=# SELECT manufacturer_name FROM engines_manufacturers WHERE metaphone(engines_manufacturers.manufacturer_name, 2) = metaphone('Pejo', 2);
manufacturer_name
-------------------------
Peugeot Citroen Moteurs
(1 row)

With a word like Peugout, in this example, the pronunciation and the spelling differ. In this case dmetaphone gives you two options instead of one with metaphone. In the second query, if you lower the max_output_length value, you have a better chance to match the manufacturer name you are looking for.

Next, you can search for the car models of a manufacturer which name is misspelled:

SELECT cars.name as Cars, engines_manufacturers.manufacturer_name as Manufacturer FROM cars INNER JOIN cars_engines ON cars.id = cars_engines.cars_id INNER JOIN engines_manufacturers ON cars_engines.engines_id = engines_manufacturers.id WHERE metaphone(engines_manufacturers.manufacturer_name, 6) = metaphone('FW', 6);
cars | manufacturer
--------------------+--------------
Volkswagen Phaeton | VW
Skoda Yeti | VW
(2 rows)

To decide which algorithm to use, carefully analyze the data in your database records and the requirements for your project defined during the design stage. Sometimes one solutions works better and faster that the other. Or you can combine several solutions in a single query in order to get the best result.

The techniques described in this article allow application developers to save programming time and improve performance by completing text searches directly on the database level. Using the PostgreSQL syntax makes code easier for other IT specialists to understand.

10 Linux/Unix Bash and KSH Shell Job Control Examples

$
0
0
http://www.cyberciti.biz/howto/unix-linux-job-control-command-examples-for-bash-ksh-shell

Unix / Llnux shell job control series
Linux and Unix are multitasking operating systems i.e. a system that can run multiple tasks (process) during the same period of time. In this new blog series, I am going to list the Linux and Unix job control commands that you can use for multitasking with the Bash or Korn or POSIX shell.

What is a job control?

Job control is nothing but the ability to stop/suspend the execution of processes (commands) and continue/resume their execution as per your requirements. This is done using your operating system and shell such as bash/ksh or POSIX shell.

Who provides a facility to control jobs?

The Bash / Korn shell, or POSIX shell provides a facility to control jobs.

Say hello to job table

Your shell keeps a table of current jobs, called job table. When you type command the shell assigns a jobID (also known as JOB_SPEC). A jobID or JOB_SPEC is nothing but small integer numbers.

#1: Creating your first Linux/Unix job

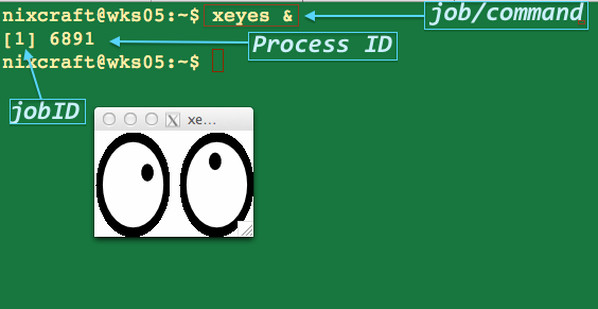
I am going to run a command called xeyes that displays two googly eyes on screen, enter:
$ xeyes &
Sample outputs:
Fig.01: Running the xeyes command in the background

I started a job in the background with an ampersand (&). The shell prints a line that looks like the following:
[1] 6891
In this example, two numbers are output as follows
  • [1] : The xeyes job, which was started in the background, was job number 1.
  • 6891 : A process ID of job number 1.
I am going to start a few more jobs:
## Start a text editor, system load average display for X, and sleepcommand ##
gedit /tmp/hello.c &
xload &
sleep100000&
 

#2: List the current jobs

To see the status of active jobs in the current shell, type:
$ jobs
$ jobs -l

Sample outputs:
[1]   9379 Running                 xeyes &
[2] 9380 Running gedit /tmp/hello.c &
[3]- 9420 Running xload &
[4]+ 9421 Running sleep 100000 &
A brief description of each field is given below:
FieldValueDescriptionExample(s)
1[1]jobID or JOB_SPEC - Job number to use with the fg, bg, wait, kill and other shell commands. You must prefix the job number with a percent sign (%).
A plus sign (+) identifies the default or current job.
A minus sign (-) identifies the previous job.
%1
fg %1
kill %2
29379Process ID - An identification unique number that is automatically assigned to each process when it is created on the system.kill 9379
3Runningstate - The state of job:
Running - The job is currently running and has not been suspended by a signal.
Stopped - The job was suspended.
N/A
4xeyes &command - The command that was given to the shell.script &
firefox url&
You can also use ps command to list the processes running on the system:
$ ps

#3: Stop or suspend running jobs

Hit the [Ctrl]-[Z] key or use kill command as follows:
kill -s stop PID
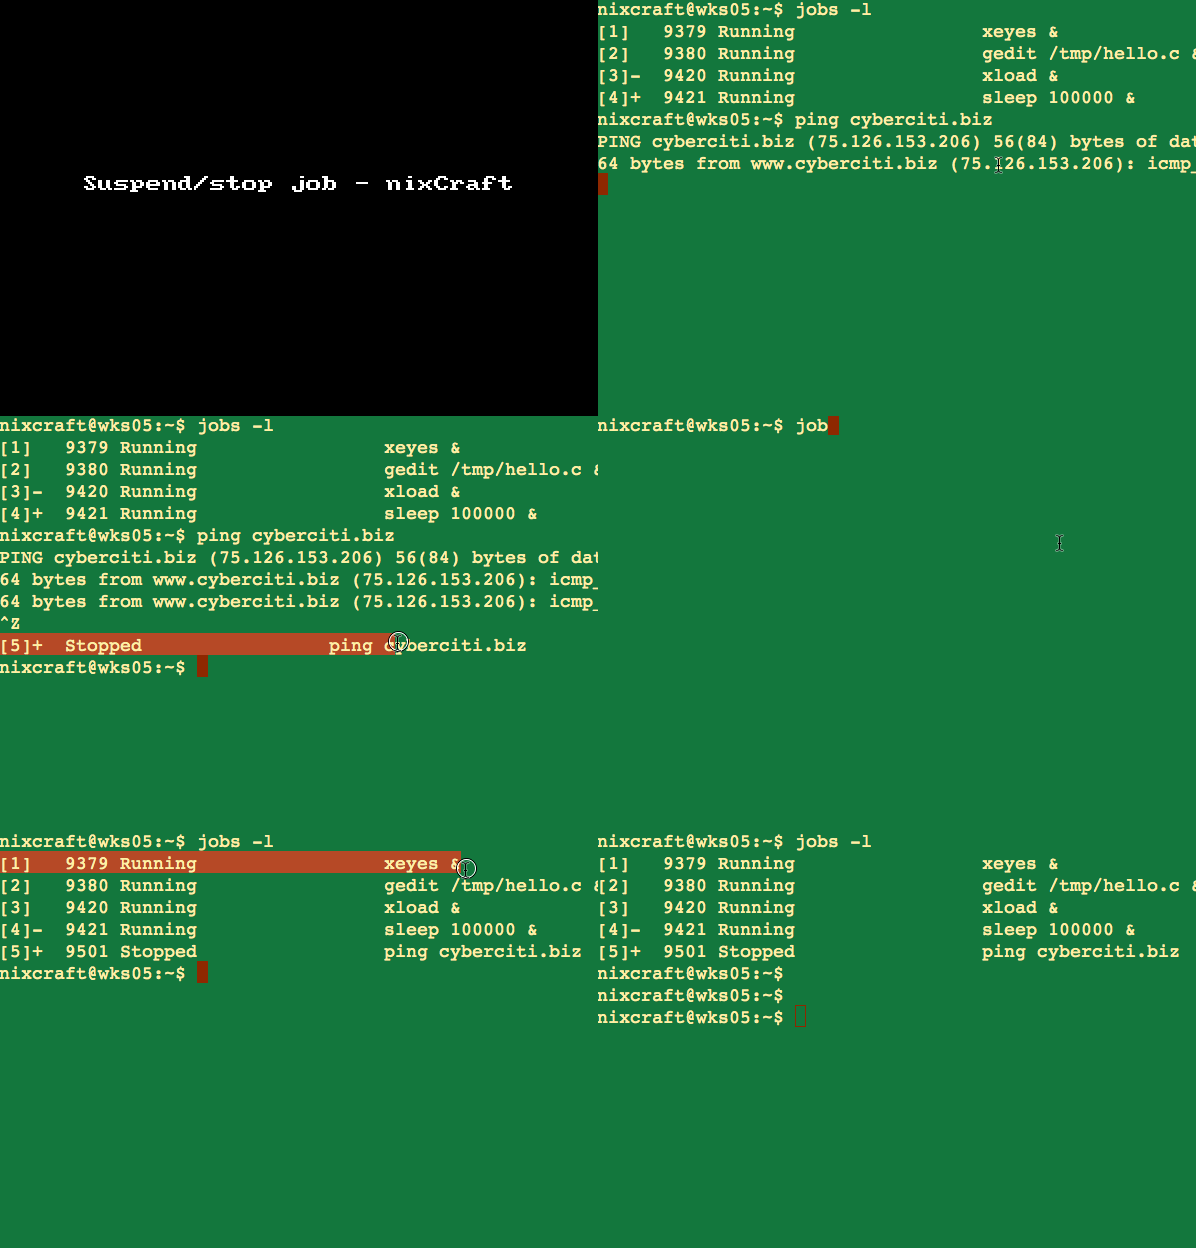
In this example, start ping command and use the Ctrl-Z key sequence to stop the ping command job:
Animated gif 01: Suspending ping command job

#4: Resume suspended/stopped job in the foreground

Let us resume or bring stopped ping job to the foreground and make it the current job with the help of fg command. The syntax is as follows:
## Job id number 5forpingcommand ##
fg %5
I can also state any job whose command line begins with the string "ping":
## %String ##
fg %ping
Sample outputs:
64 bytes from www.cyberciti.biz (75.126.153.206): icmp_req=3 ttl=53 time=265 ms
64 bytes from www.cyberciti.biz (75.126.153.206): icmp_req=4 ttl=53 time=249 ms
64 bytes from www.cyberciti.biz (75.126.153.206): icmp_req=5 ttl=53 time=267 ms
^C

#5: Resume suspended/stopped job in the background

In this example, I am going to update all installed packages on Red Hat or CentOS Linux production server using yum command background job:
# yum -y update &>/root/patch.log &
However, due to some reason (say load issue) I decided to stop this job for 20 minutes:
# kill -s stop %yum
Sample outputs:
[7]+  Stopped                 yum -y update &>/root/patch.log &

Restart a stopped background yum process with bg

Now, I am going to resume stopped the yum -y update &>/root/patch.log & job, type:
# bg %7
OR
# bg %yum
Sample outputs:
[7]+ yum -y update &>/root/patch.log &

#6: Kill a job / process

To stop/kill a yum command process, enter the following kill command whose jobID was 7:
# kill %7
OR
# kill pid
Sample outputs:
[7]+  Terminated              yum -y update &>/root/patch.log &
On Linux/FreeBSD/OS X Unix you can use killall command to kill process by name instead of PID or jobID.

#7 Why does shell kill off all my background jobs when I logout?

In this example, I am going to start pdfwriter.py job to generate pdf files for this site in bulk:
 
~/scripts/www/pdfwriter.py --profile=faq --type=clean --header=logo\
--footer-left "nixCraft is GIT UL++++ W+++ C++++ M+ e+++ d-" \
--footer-right "Page [of] of [total]"&
 
As soon as I logout from shell, pdfwriter.py job will be killed by my shell. To overcome this problem use disown shell builting command to tell the shell not to send a HUP signal, type:
$ ~/scripts/www/pdfwriter.py --profile=faq .... &
$ disown
$ exit

#8 Prevent job from being killed on logout using an external command called nohup

You can also use nohup command to execute jobs after you exit from a shell prompt:
$ nohup ~/scripts/www/pdfwriter.py --profile=faq .... &
$ exit

#9: Finding the PID of last job

To find the the process ID of the most recently executed background (asynchronous) command, use bash shell special parameter $!
$ gedit foo.txt &
$ echo "PID of most recently executed background job - $!"

Sample outputs:
PID of most recently executed background job - 9421

#10: Wait for job completion

The wait command waits for given process ID or jobID (job specification) , and reports its termination status. The syntax is as follows:
 
/path/to/large-job/command/foo &
wait $!
/path/to/next/job/that-is-dependents/on-foo-command/bar
 
Here is one of my working script:
#!/bin/bash
# A shell script wrapper to create pdf files for our blog/faq section
########################################################################
# init() - Must be run first
# Purpose - Create index filein$_tmpfor all our wordpress databases
########################################################################
init(){
_php="/usr/bin/php"
_phpargs="-d apc.enabled=0"
_base="~/scripts"
_tmp="$_base/tmp"
_what="$1"
for i in$_what
do
[[ ! -d "$_tmp/$i"]]&& /bin/mkdir"$_tmp/$i"
$_php$_phpargs -f "$_base/php/rawsqlmaster${i}.php"> "$_tmp/$i/output.txt"
done
}
 
#####################################################
# Without index file, we can out generate pdf files
#####################################################
init blog
 
###########################################################
# Do not run the rest of the script until init() finished
###########################################################
wait $!
 
## Alright, create pdf files
~/scripts/www/pdfwriter.py --profile=blog --type=clean --header=logo\
--footer-left "nixCraft is GIT UL++++ W+++ C++++ M+ e+++ d-" \
--footer-right "Page [of] of [total]"
 

Linux and Unix job control command list summery

CommandDescriptionExample(s)
&Put the job in the backgroundcommand &
%nSet the job with the given n (number)command %1
%WordRefer the job whose command line begins with the Wordcommand %yum
%?WordRefer any job whose command line contains the Wordcommand %?ping
%%
%+
Refer to the current jobkill %%
kill %+
%-Refer to the previous jobbg %-
CTRL-Z
kill -s stop jobID
Suspend or stop the jobkill -s stop %ping
jobs
jobs -l
List the active jobsjobs -l
bgPut jobs to the backgroundbg %1
bg %ping
fgPut job to the foregroundfg %2
fg %apt-get

A note about shell built-in and external commands

Run the following type command to find out whether given command is internal or external:
 
type -a fgbgjobsdisown
 
Sample outputs:
fg is a shell builtin
fg is /usr/bin/fg
bg is a shell builtin
bg is /usr/bin/bg
jobs is a shell builtin
jobs is /usr/bin/jobs
disown is a shell builtin
In almost all cases, you need to use shell built-in commands. All external commands such as /usr/bin/fg or /usr/bin/jobs works in a different shell environment, and can not use parent shell's environment.

Conclusion

I hope you enjoyed this blog post series (rss feed) and I suggest that you read the following for more information:

Stupid ssh tricks

$
0
0
http://linuxaria.com/howto/stupid-ssh-tricks?lang=en

I use ssh everyday and it’s my main tool to connect and manage servers, so I’m always interested in articles about ssh.
Today I present an interesting article on this subject, written by Corey Quinn and posted on the sysadvent blog
Every year or two, I like to look back over my client’s SSH configuration file and assess what I’ve changed.
This year’s emphasis has been on a few options that center around session persistence. I’ve been spending a lot of time on the road this year, using SSH to log into remote servers over terrible hotel wireless networks. As a result, I’ve found myself plagued by SSH session resets. This can be somewhat distracting when I’m in the midst of a task that requires deep concentration— or in the middle of editing a configuration file without the use of screen or tmux.
ServerAliveInterval 60
This triggers a message from the client to the server every sixty seconds requesting a response, in the event that data haven’t been received from the server in that time. This message is sent via SSH’s encrypted channel.


ServerAliveCountMax 10
This sets the number of server alive messages that will be sent. Combined with ServerAliveInterval, this means that the route to the server can vanish for 11 minutes before the client will forcibly disconnect. Note that in many environments, the system’s TCP timeout will be reached before this.
TCPKeepAlive no
Counterintuitively, setting this results in fewer disconnections from your host, as transient TCP problems can self-repair in ways that fly below SSH’s radar. You may not want to apply this to scripts that work via SSH, as “parts of the SSH tunnel going non-responsive” may work in ways you neither want nor expect!
ControlMaster auto
ControlPath ~/.ssh/%r@%h:%p
ControlPersist 4h
These three are a bit interesting. ControlMaster auto permits multiple SSH sessions to opportunistically reuse an existing connection, the socket for which lives at ControlPath (in this case, a socket file that lives at ~/.ssh/$REMOTE_LOGIN_USENAME@$HOST:$SSH_PORT). Should that socket not exist, it will be created— and thanks to ControlPersist, it will continue to exist for four hours. Taken as a whole, this has the effect of causing subsequent SSH connections (including scp, rsync (provided you’re using SSH as a transport), and sftp) to be able to skip the SSH session establishment.
As a quick test, my initial connection with these settings takes a bit over 2 seconds to complete. Subsequent connections to that same host complete in 0.3 seconds — almost an order of magnitude faster. This is particularly useful when using a configuration management that’s establishing repeated SSH connections to the same host, such as ansible, or salt-ssh. It’s worth mentioning that ControlMaster was introduced in OpenSSH 4.0, whereas ControlPersist didn’t arrive until OpenSSH 5.6.
The last trick is a bit off the topic of SSH, as it’s not (strictly speaking) SSH based. Mosh (from “mobile shell”) is a project that uses SSH for its initial authentication, but then falls over to a UDP-based transport. It offers intelligent local echoing over latent links (text that the server hasn’t acknowledged shows up as underlined locally), and persists through connection changes. Effectively, I can start up a mosh session, close my laptop, and go to another location. When I connect to a new wireless network, the session resumes seamlessly. This has the effect of making latent links far more comfortable to work with; I’m typing this post in vim on a server that’s currently 6000 miles and 150ms away from my laptop, for instance.
As an added benefit, mosh prioritizes Ctrl-C; if you’ve ever accidentally catted a 3GB log file, you’ll appreciate this little nicety! Ctrl-C stops the flood virtually instantly.
I will say that mosh is relatively new, and implements a different cryptography scheme than SSH does. As a result, you may not be comfortable running this across the open internet. Personally, I run it over OpenVPN only; while I have no reason to doubt its cryptography implementation, I tend to lean more toward a paranoid stance when it comes to new cryptographic systems.
Ideally this has been enlightening; SSH has a lot of strange options that allow for somewhat nifty behavior in the face of network issues, and mosh is a bit of a game-changer around this space as well.

How to develop an Android app using Apache Cordova and jQuery Mobile

$
0
0
http://www.openlogic.com/wazi/bid/332279/how-to-develop-an-android-app-using-apache-cordova-and-jquery-mobile


Apache Cordova is a platform for building native mobile applications using common web technologies, including HTML, CSS, and JavaScript. It offers a set of APIs that allow mobile application developers to access native mobile functions such as audio, camera, and filesystem using JavaScript. Another developer tool, jQuery Mobile, is one of the best mobile web application frameworks. It allows developers to create rich web applications that are mobile-friendly. You can use Apache Cordova with jQuery Mobile to create a complete Android application.
To create, develop, build, and test a Cordova application, you can use the Cordova command-line interface. From the Cordova CLI you can create new Cordova projects, build them on mobile platforms, and run them on real devices or within emulators.
Before you install the Cordova CLI, install the Android SDK and Node.js, and be sure you have Apache Ant installed, then use the Node.js command sudo npm install -g cordova to install Cordova. The latest Cordova version is 3.3.0.
Create a Cordova project by running the command cordova create voicememo com.xyz.voicememo VoiceMemo. The first parameter tells Cordova to generate a voicememo directory for the project. The directory will contain a www subdirectory that includes the application's home page (index.html), along with various resources under css, js, and img directories. The command also creates a config.xml file that contains important metadata Cordova needs to generate and distribute the application.
The second and the third parameters are optional. The second parameter, com.xyz.voicememo, provides a project namespace. For an Android project, such as the one we are building, the project namespace maps to a Java package with the same name. The last parameter, VoiceMemo, provides the application's display text. You can edit both of these values later in the config.xml file.
Now you have a Cordova project that you can use as a base for generating platform-specific code. Before you generate Android code, run the commands
cd voicememo
cordova platform add android
The cordova platform command depends on Apache Ant. After you run it, you will find a new platforms/android subdirectory under the voicememo directory.
To generate Android-specific code under platforms/android, build the project using the cordova build command under the voicememo directory. You can then run and test the generated Android project in the Cordova emulator by executing the command cordova emulate android.
Note: The Cordova project recommends you make your code changes in the root www directory, and not in the platforms/android/assets/www directory, because the platforms directory is overwritten every time you execute a cordova build command after you use Cordova CLI to initialize the project.
Figure 1
The home page of the VoiceMemo application, which represents the list of voice memos.
From the Voice Listing page, users can click on three buttons: New, to create a new recording; About, to open the application's About page; and Remove All Memos, to remove the saved voice memos.
When users click the New button, they are forwarded to the voice recording page:
Figure 2
Here users can enter the title and description of a voice memo, then click the Record button to invoke the voice recording application of the Android mobile device. When a recording is completed, users are returned to the voice recording page and can play back the recording or save it.To work with voice recording and playback in Cordova, you can install several plugins; the first two below are mandatory. Run the following commands from the voicememo directory:
  • Media Capture plugin, for media capture:
    cordova plugin add https://git-wip-us.apache.org/repos/asf/cordova-plugin-media-capture.git
  • Media plugin, for working with media:
    cordova plugin add https://git-wip-us.apache.org/repos/asf/cordova-plugin-media.git
  • Device plugin, for accessing device information:
    cordova plugin add https://git-wip-us.apache.org/repos/asf/cordova-plugin-device.git
  • Dialog plugin, for displaying native-looking messages:
    cordova plugin add https://git-wip-us.apache.org/repos/asf/cordova-plugin-dialogs.git
  • File plugin, for accessing the mobile filesystem:
    cordova plugin add https://git-wip-us.apache.org/repos/asf/cordova-plugin-file.git
Apply these plugins to your Cordova project by running the cordova build command.
At this point you're done with the preparation of the application. You can now start writing the application custom code.
Let's look at the VoiceMemo application directory hierarchy. The www directory contains the following subdirectories:
Figure3
  • css contains the custom application Cascading Style Sheet.
  • jqueryMobile contains the jQuery Mobile framework and plugins JStorage and Page Params.
  • js contains all the custom application JavaScript code. It has three subdirectories:
    • api contains the application managers (VoiceManager and CacheManager) and utility files.
    • model contains the application model. In this application we have a single object that represents a Voice item called VoiceItem.
    • vc contains the application view controllers, which include the application action handlers. Action handlers usually create model objects and populate them with UI data, pass them to the application APIs, and display the results on the application view or page.
Finally, also under www, index.html contains all of the application pages, which for this project comprise three jQuery pages:
  • Voice Listing (home page)
  • Voice Recording
  • About
The following code snippet shows the Voice Listing jQuery page code in the index.html file.

Let's walk through the code. The page has a header (the div whose data-role="header") that contains two navigation buttons to the About page and to the Voice Recording page. It has content (the div whose data-role="content") that contains the list of the voice recordings that are populated when the page is shown. Finally, it has a footer (the div whose data-role="footer") that contains a button to remove all of the voice memos from the list.
Now let's look at the page view controller JavaScript object, which includes the action handlers of the page (voiceList.js). voiceList.js is included in the index.html page, so when it is loaded by the browser the script is automatically executed to register the JavaScript event handlers for this jQuery page.
(function() {

var voiceManager = VoiceManager.getInstance();

$(document).on("pageinit", "#voiceList", function(e) {

$("#removeAllVoices").on("tap", function() {
e.preventDefault();

voiceManager.removeAllVoices();

updateVoiceList();
});
});

$(document).on("pageshow", "#voiceList", function(e) {
e.preventDefault();

updateVoiceList();
});

function updateVoiceList() {
var voices = voiceManager.getVoices();

$("#voiceListView").empty();

if (jQuery.isEmptyObject(voices)) {
$("
  • No Memos Available

  • ").appendTo("#voiceListView");
    } else {
    for (var voice in voices) {
    $("
  • " +
    voices[voice].title + "

  • ").appendTo("#voiceListView");
    }
    }

    $("#voiceListView").listview('refresh');
    }
    })();
    The "pageinit" event handler, which is called once in the page initialization, registers the voice recordings removal tap event handler. The voice recordings removal tap event handler removes the list of voice recordings by calling the removeAllVoices() method of the VoiceManager object, then updates the voice listview.
    The "pageshow" event handler, which is called every time the page is shown – it is triggered on the "to" transition page, after the transition animation completes – updates the voice list view with the current saved voice recordings. To do this it retrieves the current saved voice recordings by calling the getVoices() method of VoiceManager, then adds the voice items to the list view so that if any voice item in the list is clicked, its ID will be passed to the voice recording page to display the voice item details.
    Note: In a jQuery Mobile list view you must call listview('refresh') to see list view updates.
    The next code snippet shows the Voice Recording page code in the index.html file:


    Home


    Record Voice


    Back


    The Voice Recording page has header and content sections. The content div contains the voice recording elements (title, description, and the voice recording file) and a Save button. Let's see the page view controller JavaScript object, which includes the action handlers of the page (recordVoice.js). Like the event handler JavaScript we just looked at, recordVoice.js is included in the index.html page and is automatically executed when it is loaded by the browser.
    (function() {

    var voiceManager = VoiceManager.getInstance();

    $(document).on("pageinit", "#voiceRecording", function(e) {
    e.preventDefault();

    $("#saveVoice").on("tap", function() {
    e.preventDefault();

    var voiceItem = new VoiceItem($("#title").val() || "Untitled",
    $("#desc").val() || "",
    $("#location").val() || "",
    $("#vid").val() || null);

    voiceManager.saveVoice(voiceItem);

    $.mobile.changePage("#voiceList");
    });

    $("#recordVoice").on("tap", function() {
    e.preventDefault();

    var recordingCallback = {};

    recordingCallback.captureSuccess = handleCaptureSuccess;
    recordingCallback.captureError = handleCaptureError;

    voiceManager.recordVoice(recordingCallback);
    });

    $("#playVoice").on("tap", function() {
    e.preventDefault();

    var playCallback = {};

    playCallback.playSuccess = handlePlaySuccess;
    playCallback.playError = handlePlayError;

    voiceManager.playVoice($("#location").val(), playCallback);
    });

    });

    $(document).on("pageshow", "#voiceRecording", function(e) {
    e.preventDefault();

    var voiceID = ($.mobile.pageData && $.mobile.pageData.voiceID) ? $.mobile.pageData.voiceID : null;
    var voiceItem = new VoiceItem("", "", "");

    if (voiceID) {

    //Update an existing voice
    voiceItem = voiceManager.getVoiceDetails(voiceID);
    }

    populateRecordingFields(voiceItem);

    if (voiceItem.location.length > 0) {
    $("#playVoice").closest('.ui-btn').show();
    } else {
    $("#playVoice").closest('.ui-btn').hide();
    }
    });

    $(document).on("pagebeforehide", "#voiceRecording", function(e) {
    voiceManager.cleanUpResources();
    });

    function populateRecordingFields(voiceItem) {
    $("#vid").val(voiceItem.id);
    $("#title").val(voiceItem.title);
    $("#desc").val(voiceItem.desc);
    $("#location").val(voiceItem.location);
    }

    function handleCaptureSuccess(mediaFiles) {
    if (mediaFiles && mediaFiles[0]) {
    currentFilePath = mediaFiles[0].fullPath;

    $("#location").val(currentFilePath);

    $("#playVoice").closest('.ui-btn').show();
    }
    }

    function handleCaptureError(error) {
    displayMediaError(error);
    }

    function handlePlaySuccess() {
    console.log("Voice file is played successfully ...");
    }

    function handlePlayError(error) {
    displayMediaError(error);
    }

    function displayMediaError(error) {
    if (error.code == MediaError.MEDIA_ERR_ABORTED) {
    AppUtil.showMessage("Media aborted error");
    } else if (error.code == MediaError.MEDIA_ERR_NETWORK) {
    AppUtil.showMessage("Network error");
    } else if (error.code == MediaError.MEDIA_ERR_DECODE) {
    AppUtil.showMessage("Decode error");
    } else if (error.code == MediaError.MEDIA_ERR_NONE_SUPPORTED) {
    AppUtil.showMessage("Media is not supported error");
    } else {
    console.log("General Error: code = " + error.code);
    }
    }
    })();
    The "pageinit" event handler registers the voice save, record, and play tap event handlers. The voice saving tap event handler saves a voice recording by calling the saveVoice() method of the VoiceManager object. The user is then forwarded to the voice listing page using $.mobile.changePage("#voiceList"). This page can be used either to create a new voice recording or update an existing one. In the second case, the voice ID is passed from the list view of the Voice Listing page and is saved in a hidden field "vid" to be used by VoiceManager for updating the existing voice recording. In the first case, the "vid" hidden field value is empty, which signals VoiceManager that this is a new voice recording and not an update to an existing one.
    The voice ID is retrieved on the "pageshow" event of the voice recording page. If there is a passed voice ID from the Voice Listing page then the code retrieves the full voice recording information using voiceManager.getVoiceDetails(voiceID) and populates the form elements using the retrieved information. Finally, in the "pageshow" handler, if there is an existing voice recording (that is, voiceItem.location.length > 0) then the program displays the Play button to allow users to play the voice recording.
    Note that the application automatically passes parameters between the two pages thanks to the jQuery Mobile Page parameters plugin, which is included on the index.html page.
    In the voice recording tap event handler, the code starts voice recording by calling voiceManager.recordVoice(recordingCallback). The recording callback contains two attributes: VoiceManager calls captureSuccess if the voice capture process succeeds, and captureError it fails. With the captureSuccess callback (handleCaptureSuccess), the full voice recording path is stored in a hidden field to be used later to play the voice. With the captureError callback (handleCaptureError), an error message is displayed.
    The voice playing tap event handler starts voice playback by calling voiceManager.playVoice(voiceLocation, playCallback). The playing callback contains two attributes: playSuccess and playError. VoiceManager calls playSuccess if voice play succeeds, and playError if it fails. The handlePlaySuccess callback prints a statement in the console log to indicate that voice play succeeded, while the handlePlayError callback displays an error message to the user.
    The jQuery Mobile framework calls the "pagebeforehide" event before a page is hidden. This event handler calls voiceManager.cleanUpResources() to stop any recording that is currently playing and to clean up the media object.
    So much for the two main pages of the application. Here's the complete code of the index.html file:


    Voice Memo


    Home


    Record Voice


    Back


    This sample is developed for education purposes


    Let's look at the application APIs – that is, the scripts listed at the end of index.html, which are placed before the view controller objects so they can be used by them. The following code snippet shows the VoiceManager object, which is the main API object used by the view controller objects (voiceList and recordVoice):
    var VoiceManager = (function () {     
    var instance;

    function createObject() {
    var cacheManager = CacheManager.getInstance();
    var VOICES_KEY = "voices";
    var voiceMap;
    var audioMedia;

    return {
    getVoices: function () {
    voiceMap = cacheManager.get(VOICES_KEY) || {};

    return voiceMap;
    },
    getVoiceDetails: function (voiceID) {
    voiceMap = cacheManager.get(VOICES_KEY) || {};

    return voiceMap[voiceID];
    },
    saveVoice: function (voiceItem) {
    voiceMap = cacheManager.get(VOICES_KEY) || {};

    voiceMap[voiceItem.id] = voiceItem;

    cacheManager.put(VOICES_KEY, voiceMap);
    },
    removeAllVoices: function() {
    cacheManager.remove(VOICES_KEY);
    },
    recordVoice: function (recordingCallback) {
    navigator.device.capture.captureAudio(recordingCallback.captureSuccess,
    recordingCallback.captureError,
    {limit: 1});
    },
    playVoice: function (filePath, playCallback) {
    if (filePath) {

    //You have to make this in order to make this working on Android ...
    filePath = filePath.replace("file:/","file://");

    this.cleanUpResources();

    audioMedia = new Media(filePath, playCallback.playSuccess, playCallback.playError);

    // Play audio
    audioMedia.play();
    }
    },
    cleanUpResources: function() {
    if (audioMedia) {
    audioMedia.stop();
    audioMedia.release();
    audioMedia = null;
    }
    }
    };
    };

    return {
    getInstance: function () {
    if (!instance) {
    instance = createObject();
    }

    return instance;
    }
    };
    })();
    As you can see, VoiceManager is a singleton object that has seven methods:
    Method NameDescription
    getVoices()Get all of the saved voices from the mobile local storage using the CacheManager object.
    getVoiceDetails(voiceID)Get the voice details using the voice ID from the mobile local storage using the CacheManager object.
    saveVoice(voiceItem)Save the voice item object in the mobile local storage using the CacheManager object.
    RemoveAllVoices()Remove all the voice items from the mobile local storage using CacheManager object.
    recordVoice(recordingCallback)Use Cordova navigator.device.capture.captureAudio to capture the voice recording. Call recordingCallback.captureSuccess if the operation succeeds and recordingCallback.captureError if it fails.
    playVoice(filePath, playCallback)Uses Cordova Media object to play the voice recording, whose full location is specified in the filePath parameter. Call playCallback.playSuccess if the operation succeeds and playCallback.playError if it fails.
    CleanUpResources()Stop any playing recording and clean up media resources.
    VoiceManager uses CacheManager to persist, update, delete, and retrieve the voice items. The next code snippet shows the CacheManager object.
    var CacheManager = (function () {     
    var instance;

    function createObject() {
    return {
    put: function (key, value) {
    $.jStorage.set(key, value);
    },
    get: function (key) {
    return $.jStorage.get(key);
    },
    remove: function (key) {
    return $.jStorage.deleteKey(key);
    }
    };
    };

    return {
    getInstance: function () {

    if (!instance) {
    instance = createObject();
    }

    return instance;
    }
    };
    })();

    CacheManager is a singleton object that uses jStorage to access local storage. CacheManager has three methods:
    Method NameDescription
    put(key, value)Add an entry in the local storage with (key, value) pairs.
    get(key)Get the entry value whose key is specified as a parameter.
    remove(key)Remove the entry whose key is specified as a parameter.
    The final code snippet shows the VoiceItem object, which represents the voice item with the attributes of title, description, location, and ID.
    var VoiceItem = function(title, desc, location, id) {
    this.title = title || "";
    this.desc = desc || "";
    this.location = location || "";
    this.id = id || "Voice_" + (new Date()).getTime();
    };

    VoiceItem.prototype.toString = function () {
    return "Title = " + this.title + ", " +
    "Description = " + this.desc + ", " +
    "Location = " + this.location + ", " +
    "ID = " + this.id;
    };
    At this point I've walked you through the application logic and what happens when users interact with each screen. Now let's see how it works. You can run the application from the command line under the voicememo directory with the command cordova emulate android. If you want to try it yourself you can download the complete code.
    After you've run the cordova build command, you should find the generated Android APK file under the platforms/android/bin directory, and you can deploy it on your Android phone or tablet.

    Conclusion

    At this point I hope you can see how to design and implement a complete native Android mobile application that uses Apache Cordova as a platform for accessing mobile native features and jQuery Mobile as a powerful mobile application framework. Armed with this knowledge, you can start developing your own native Android applications using your HTML, CSS, and JavaScript skills.

    Will DuckDuckGo eventually destroy Google in search?

    $
    0
    0
    http://www.itworld.com/open-source/400624/will-duckduckgo-destroy-google-search

    Today in Open Source: DuckDuckGo gains more users as privacy concerns mount. Plus: An exhaustive list of Open Source software, and the Ubuntu phone may be delayed until 2015

    By , ITworld |  Open Source, Google, open source8
    DuckDuckGo gains larger user base
    Fierce Content Management is reporting that DuckDuckGo grew quite a bit over the last year, probably due to privacy concerns on the part of users.
    DuckDuckGo reported phenomenal growth last year, and it's no wonder.
    In a time when our privacy is continually being eroded, and every day there seems to be a new revelation about government surveillance, many people are looking away from major search engines like Google and Bing and moving to DuckDuckGo, a service that guarantees it doesn't save your search information.

    Image credit: Fierce Content Management
    More at Fierce Content Management

    Image credit: DuckDuckGo
    I'm very glad to see DuckDuckGo doing so well recently. I highly recommend using it when you want your searches to be private. It's a much better option than Google, Bing, Yahoo or some of the other better known search engines.
    This report makes me wonder how long Google will be king of the search engines. More and more people are disturbed at the tracking and bubbling that happens when you use Google. Privacy is becoming a major issue for people on the web, particularly while searching for information.
    I actually had a friend of mine who is not very tech-savvy ask me about this. He was worried that Google was tracking his searches and sharing it with the government. I was surprised to hear this from him as it's the sort of thing that he doesn't usually pay attention to in the media.
    Sure enough though it had gotten through to him and he was worried. So I gave him the URL for DuckDuckGo and told him to use that instead of Google if privacy mattered to him.
    I also showed him the DuckDuckGo site, and let him scan the DuckDuckGo pages that explain the differences between DuckDuckGo and Google:
    Don't Track Us
    Don't Bubble Us
    He was impressed and also somewhat shocked at the mechanics of Google's search experience.
    It might seem very early for me to ponder this, but I can't help but think that Google's days are numbered as the number one search engine. It might or might not be DuckDuckGo that dethrones Google, but the issue of privacy is beginning to matter to even non-tech-savvy users.
    I suspect that a quiet tidal wave of anger about privacy is forming out there, and I wonder if it will someday sweep Google and the other large search engines away. I doubt any of those companies are worried about this in the short term, but it's something they had better pay attention to over the long haul.
    What's your take on this? Will DuckDuckGo or some other privacy protecting search engine eventually destroy Google? Tell me your thoughts in the comments.
    A guide to Open Source software
    Datamation has a very long (12 pages!) guide to Open Source software.
    For the fifth year in a row, Datamation is closing out the year with a big, big list of all the software we've featured on our monthly open source software guides. This year's list is the longest ever with 1,180 projects in 143 different categories from Accessibility to Wine and Beer.
    We refreshed the list with all the new applications we've highlighted this year, and we dropped those that hadn't been updated in a while. Please note that the list is organized by category and alphabetically within each category — the numbers don't indicate rank or quality.
    More at Datamation
    Kudos to Datamation for the exhaustive list, but twelve pages is a bit much to expect people to click through. It would be nice if there was a single page alternative for folks who don't want to keep clicking over and over to see the list.
    Anyway, check out the list if you're looking for more Open Source applications. There's bound to be something on there that you'll find useful, if you can manage to click all the way to the end.
    Ubuntu phone may be delayed until 2015
    The Register is reporting that the Ubuntu phone may be delayed until 2015.
    When Canonical CEO Jane Silber first announced plans to port Ubuntu to phones last year, she said the goal was to ship the first handsets with the OS preloaded by the end of 2013.
    That didn't happen, and from the sound of it, Ubuntu fans probably shouldn't hold their breath for a dedicated Ubuntu phone this year, either. Even if one does appear, it will likely be a limited-run device targeting niche use cases.
    "Longer-term we would love to see the major OEM/Carriers shipping Ubuntu handsets," Ubuntu community manager Jono Bacon wrote in a recent Reddit AMA session. "This is a long road though with many components, and I would be surprised if we see anything like this before 2015."
    More at The Register
    It sounds like Firefox OS will be the most prominent alternative to Android and iOS phones for the immediate future. It's a shame that Canonical has not been able to launch an Ubuntu phone. Piggybacking off of a limited selection of Android phones just isn't going to cut it.

    Get better Apache load balancing with mod_cluster

    $
    0
    0
    http://www.openlogic.com/wazi/bid/330406/get-better-apache-load-balancing-with-mod_cluster


    Mod_cluster is an innovative Apache module for HTTP load balancing and proxying. It implements a communication channel between the load balancer and back-end nodes to make better load-balancing decisions and redistribute loads more evenly.
    Why use mod_cluster instead of a traditional load balancer such as Apache's mod_balancer and mod_proxy or even a high-performance hardware balancer? Thanks to its unique back-end communication channel, mod_cluster takes into account back-end servers' loads, and thus provides better and more precise load balancing tailored for JBoss and Tomcat servers. Mod_cluster also knows when an application is undeployed, and does not forward requests for its context (URL path) until its redeployment. And mod_cluster is easy to implement, use, and configure, requiring minimal configuration on the front-end Apache server and on the back-end servers.

    How to install mod_cluster

    You can use mod_cluster either with JBoss or Tomcat back-end servers. We'll install and configure mod_cluster with Tomcat under CentOS; using it with JBoss or on other Linux distributions is a similar process. I'll assume you already have at least one front-end Apache server and a few back-end Tomcat servers installed.
    To install mod_cluster, first download the latest mod_cluster httpd binaries. Make sure to select the correct package for your hardware architecture – 32- or 64-bit.
    Unpack the archive to create four new Apache module files: mod_advertise.so, mod_manager.so, mod_proxy_cluster.so, and mod_slotmem.so. We won't need mod_advertise.so; it advertises the location of the load balancer through multicast packets, but we will use a static address on each back-end server. Copy the other three .so files to the default Apache modules directory (/etc/httpd/modules/ for CentOS).
    Before loading the new modules in Apache you have to remove the default proxy balancer module (mod_proxy_balancer.so) because it is not compatible with mod_cluster. Edit the Apache configuration file (/etc/httpd/conf/httpd.conf) and remove the line LoadModule proxy_balancer_module modules/mod_proxy_balancer.so. Create a new configuration file and give it a name such as /etc/httpd/conf.d/mod_cluster.conf. Use it to load mod_cluster's modules:
    LoadModule slotmem_module modules/mod_slotmem.so
    LoadModule manager_module modules/mod_manager.so
    LoadModule proxy_cluster_module modules/mod_proxy_cluster.so
    In the same file add the rest of the settings you'll need for mod_cluster. For example:
    Listen 192.168.204.203:9999


    Order deny,allow
    Allow from all 192.168


    ManagerBalancerName mymodcluster
    EnableMCPMReceive


    ProxyPass / balancer://mymodcluster/
    The above directives create a new virtual host listening on port 9999 on the Apache server you want to use for load balancing, on which the load balancer will receive information from the back-end application servers. In this example, the virtual host is listening on IP address 192.168.204.203, and for security reasons it allows connections only from the 192.168.0.0/16 network.
    The directive ManagerBalancerName defines the name of the cluster – mymodcluster in this example. The directive EnableMCPMReceive allows the back-end servers to send updates to the load balancer. The standard ProxyPass and ProxyPassReverse directives instruct Apache to proxy all requests to the mymodcluster balancer.
    That's all you need for a minimal configuration of mod_cluster on the Apache load balancer. At next server restart Apache will automatically load the file mod_cluster.conf from the /etc/httpd/conf.d directory. To learn about more options that might be useful in specific scenarios, check mod_cluster's documentation.
    While you're changing Apache configuration, you should probably set the log level in Apache to debug when you're getting started with mod_cluster, so that you can trace the communication between the front- and the back-end servers and troubleshoot problems more easily. To do so, edit Apache's configuration file and add the line LogLevel debug, then restart Apache.

    How to set up Tomcat for mod_cluster

    Mod_cluster works with Tomcat version 6 and 7. To set up the Tomcat back ends you have to deploy a few JAR files and make a change in Tomcat's server.xml configuration file.
    The necessary JAR files extend Tomcat's default functionality so that it can communicate with the proxy load balancer. You can download the JAR file archive by clicking on "Java bundles" on the mod_cluster download page. It will be saved under the name mod_cluster-parent-1.2.6.Final-bin.tar.gz.
    Create a new directory such as /root/java_bundles and extract the files from mod_cluster-parent-1.2.6.Final-bin.tar.gz there. Inside the directory /root/java_bundlesJBossWeb-Tomcat/lib/*.jar you will find all the necessary JAR files for Tomcat, including two Tomcat version-specific JAR files – mod_cluster-container-tomcat6-1.2.6.Final.jar for Tomcat 6 and mod_cluster-container-tomcat7-1.2.6.Final.jar for Tomcat 7. Delete the one that does not correspond to your Tomcat version.
    Copy all the files from /root/java_bundlesJBossWeb-Tomcat/lib/ to your Tomcat lib directory – thus if you have installed Tomcat in /srv/tomcat, run the command cp /root/java_bundles/JBossWeb-Tomcat/lib/* /srv/tomcat/lib/.
    Next, edit your Tomcat's server.xml file (/srv/tomcat/conf/server.xml). After the default listeners add the following line:

    This instructs Tomcat to send its mod_cluster-related information to IP 192.168.204.203 on TCP port 9999, which is what we set up as Apache's dedicated vhost for mod_cluster.
    While that's enough for a basic mod_cluster setup, you should also configure a unique, intuitive JVM route value on each Tomcat instance so that you can easily differentiate the nodes later. To do so, edit the server.xml file and extend the Engine property to contain a jvmRoute, like this: . Assign a different value, such as node2, to each Tomcat instance. Then restart Tomcat so that these settings take effect.
    To confirm that everything is working as expected and that the Tomcat instance connects to the load balancer, grep Tomcat's log for the string "modcluster" (case-insensitive). You should see output similar to:
    Dec 23, 2013 8:34:00 AM org.jboss.modcluster.ModClusterService init
    INFO: MODCLUSTER000001: Initializing mod_cluster ${project.version}
    Dec 23, 2013 8:34:11 AM org.jboss.modcluster.ModClusterService connectionEstablished
    INFO: MODCLUSTER000012: Catalina connector will use /192.168.204.204
    This shows that mod_cluster has been successfully initialized and that it will use the connector for 192.168.204.204, the configured IP address for the main listener.
    Also check Apache's error log. You should see confirmation about the properly working back-end server:
    [Mon Dec 23 08:36:22 2013] [debug] proxy_util.c(2026): proxy: ajp: has acquired connection for (192.168.204.204)
    [Mon Dec 23 08:36:22 2013] [debug] proxy_util.c(2082): proxy: connecting ajp://192.168.204.204:8009/ to 192.168.204.204:8009
    [Mon Dec 23 08:36:22 2013] [debug] proxy_util.c(2209): proxy: connected / to 192.168.204.204:8009
    [Mon Dec 23 08:36:22 2013] [debug] mod_proxy_cluster.c(1366): proxy_cluster_try_pingpong: connected to backend
    [Mon Dec 23 08:36:22 2013] [debug] mod_proxy_cluster.c(1089): ajp_cping_cpong: Done
    [Mon Dec 23 08:36:22 2013] [debug] proxy_util.c(2044): proxy: ajp: has released connection for (192.168.204.204)
    This Apache error log shows that an AJP connection with 192.168.204.204 was successfully established and confirms the working state of the node, then shows that the load balancer closed the connection after the successful attempt.
    You can start testing by opening in a browser the example servlet SessionExample, which is available in a default installation of Tomcat. Access this servlet through a browser at the URL http://balancer_address/examples/servlets/servlet/SessionExample. In your browser you should see first a session ID that contains the name of the back-end node that is serving your request – for example, Session ID: 5D90CB2C0AA05CB5FE13111E4B23E630.node2. Next, through the servlet's web form, create different session attributes. If you have a properly working load balancer with sticky sessions you should always (that is, until your current browser session expires) access the same node, with the previously created session attributes still available. To test further to confirm load balancing is in place, at the same time open the same servlet from another browser. You should be redirected to another back-end server where you can conduct a similar session test.
    As you can see, mod_cluster is easy to use and configure. Give it a try to address sporadic single-back-end overloads that cause overall application slowdowns.

    How to set password policy on Linux

    $
    0
    0
    http://xmodulo.com/2013/12/set-password-policy-linux.html

    User account management is one of the most critical jobs of system admins. In particular, password security should be considered the top concern for any secure Linux system. In this tutorial, I will describe how to set password policy on Linux.
    I assume that you are using PAM (Pluggable Authentication Modules) on your Linux system, which is the case on all recent Linux distros.

    Preparation

    Install a PAM module to enable cracklib support, which can provide additional password checking capabilities.
    On Debian, Ubuntu or Linux Mint:
    $ sudo apt-get install libpam-cracklib
    The cracklib PAM module is installed by default on CentOS, Fedora, or RHEL. So no further installation is necessary on those systems.
    To enforce password policy, we need to modify an authentication-related PAM configuration file located at /etc/pam.d. Policy change will take effect immediately after change.
    Note that the password rules presented in this tutorial will be enforced only when non-root users change passwords, but not the root.

    Prevent Reusing Old Passwords

    Look for a line that contains both "password" and "pam_unix.so", and append "remember=5" to that line. It will prevent five most recently used passwords (by storing them in /etc/security/opasswd).
    On Debian, Ubuntu or Linux Mint:
    $ sudo vi /etc/pam.d/common-password
    password     [success=1 default=ignore]    pam_unix.so obscure sha512 remember=5
    On Fedora, CentOS or RHEL:
    $ sudo vi /etc/pam.d/system-auth
    password   sufficient   pam_unix.so sha512 shadow nullok try_first_pass use_authtok remember=5

    Set Minimum Password Length

    Look for a line that contains both "password" and "pam_cracklib.so", and append "minlen=10" to that line. This will enforce a password of length (10 - <# of types>), where <# of types> indicates how many different types of characters are used in the password. There are four types (upper-case, lower-case, numeric, and symbol) of characters. So if you use a combination of all four types, and minlen is set to 10, the shorted password allowed would be 6.
    On Debian, Ubuntu or Linux Mint:
    $ sudo vi /etc/pam.d/common-password
    password   requisite    pam_cracklib.so retry=3 minlen=10 difok=3
    On Fedora, CentOS or RHEL:
    $ sudo vi /etc/pam.d/system-auth
    password   requisite   pam_cracklib.so retry=3 difok=3 minlen=10

    Set Password Complexity

    Look for a line that contains "password" and "pam_cracklib.so", and append "ucredit=-1 lcredit=-2 dcredit=-1 ocredit=-1" to that line. This will force you to include at least one upper-case letter (ucredit), two lower-case letters (lcredit), one digit (dcredit) and one symbol (ocredit).
    On Debian, Ubuntu or Linux Mint:
    $ sudo vi /etc/pam.d/common-password
    password   requisite    pam_cracklib.so retry=3 minlen=10 difok=3 ucredit=-1 lcredit=-2 dcredit=-1 ocredit=-1
    On Fedora, CentOS or RHEL:
    $ sudo vi /etc/pam.d/system-auth
    password   requisite   pam_cracklib.so retry=3 difok=3 minlen=10 ucredit=-1 lcredit=-2 dcredit=-1 ocredit=-1

    Set Password Expiration Period

    To set the maximum period of time the current password is valid, edit the following variables in /etc/login.defs.
    $ sudo vi /etc/login.defs
    PASS_MAX_DAYS   150
    PASS_MIN_DAYS 0
    PASS_WARN_AGE 7
    This will force every user to change their password once every six months, and send out a warning message seven days prior to password expiration.
    If you want to set password expiration on per-user basis, use chage command instead. To view password expiration policy for a specific user:
    $ sudo chage -l xmodulo
    Last password change                                    : Dec 30, 2013
    Password expires : never
    Password inactive : never
    Account expires : never
    Minimum number of days between password change : 0
    Maximum number of days between password change : 99999
    Number of days of warning before password expires : 7
    By default, a user's password is set to never expire.
    To change the password expiration period for user xmodulo:
    $ sudo chage -E 6/30/2014 -m 5 -M 90 -I 30 -W 14 xmodulo
    The above command will set the password to expire on 6/30/2014. In addition, the minimum/maximum number of days between password changes is set to 5 and 90 respectively. The account will be locked 30 days after a password expires, and a warning message will be sent out 14 days before password expiration.

    SSH from a web browser tutorial

    $
    0
    0
    http://www.linuxuser.co.uk/tutorials/ssh-from-a-web-browser-tutorial

    There are times when you are stuck using a locked-down machine. As long as you have a browser, though, you can still connect to your remote machines. Here’s how…


    SSH is the de facto way of securely connecting to remote machines where you need to get work done. Normally, this is achieved through an SSH client application installed on your desktop. Unfortunately, there are situations where this is just not feasible, for any number of reasons. In this tutorial we will look at a few different options for how to regain a command- line connection to your remote machines.
    No matter how locked down a machine may be, you will almost always have a web browser available. We can leverage this and get an SSH connection established through this browser. There are several different technologies that can be used to give us this connection. The first option we will look at is a purely browser-based application that requires nothing extra on either the client side or the server side. Naturally, the available options are limited, but it is one of the leanest options. The issue is that you need to use a supported browser. The second option is a Java-based one. A Java applet is loaded into your browser to handle the actual SSH connection management. Unfortunately, this is only an option if you have Java installed and are allowed to run Java applets in the browser. The third option is even leaner on the client side than the first option, and has the added advantage of running in almost any browser. The downside is that it requires you to install a piece of server-side code to facilitate the actual SSH connection management.
    Hopefully, by the end of this tutorial, you will have found an option that fits your situation and helps you manage your remote machines no matter where you are.

    There is an URL always available pointing you to a goo.gl URL containing an FAQ for Secure Shell
    There is an URL always available pointing you to a goo.gl URL containing an FAQ for Secure Shell

    Resources

    Secure Shell
    Shellinabox
    MindTerm
    DropPages
    Pancake
    Step 01 Finding an SSH client plug-in
    Both Chrome and Firefox have SSH clients in their respective app stores. In this tutorial, we will be looking at Secure Shell from the Chrome store and FireSSH from the Firefox store.
    Step 02 Installation
    In the case of both browsers, installation should be straightforward. All you need to do is find the relevant app in the browser store and click on the Install button. Most browsers also require a restart before the SSH client is ready to use.
    Step 03 Open a new connection
    For the rest of this tutorial, we will use the Chrome version. To open a new connection, simply click on the ‘Secure Shell’ icon on the browser homepage. This will open up a connection window where you can enter the host, username and password.
    Step 04 Terminal Options
    ‘Secure Shell’ in Chrome does not have a terminal preferences window yet, so you need to open a JavaScript console (by clicking the menu item View>Developer>JavaScript Console) and entering the changes you want to make. For example, you can set the background colour with the following: term_.prefs_.set(’background-color’, ’wheat’)
    Step 05 Working in SSH
    You can do almost everything with ‘Secure Shell’ that you would normally do with a regular client. You can do port forwarding by including the relevant options when you make the original connection. You place these types of options in the SSH Arguments box.

    shellinabox
    Working in SSH
    Step 06 Closing connections
    You close your connection the same way you would with any other SSH client, by typing in exit. When the connection closes, ‘Secure Shell’ offers you the option to reconnect (R), choose another connection (C), or simply finish and exit (x). If you choose ‘x’, the current browser window will stay open but will be inactive.
    Step 07 Saving connections
    All of your previous connections get stored as a list that becomes available at the top of the connection screen. Clicking on one of these stored connections lets you edit the SSH options before firing off and connecting to the remote machine.
    Step 08 Finding a Java plug-in client
    There is a Java applet that you can use called MindTerm. In this case, you need to wrap MindTerm in a simple webpage in order to get the browser to load it for you and host it somewhere visible. You can also run it directly as a Java app.
    Step 09 Installation
    If you need to host MindTerm somewhere non-local, you can place it on a hosting service if you have one. If not, you can get a Dropbox account and host it there as a static webpage. There are services like DropPages or Pancake.io that will help you here.
    Step 10 Open a new connection
    The screenshot above is made using the MindTerm jar file standalone. The behaviour is the same in the browser. When it starts up, it asks you to enter either a server alias or a server hostname. If this is a new machine, it will ask you whether you want to save it as an alias.
    Step 11 Connection options
    The advantage of a Java applet is that you have more tools available to you. Clicking on the menu item Settings>Terminal… will pop up a full preferences window where you can set the terminal type, font type and size, and colours, among other items.

    Connection options
    Connection options
    Step 12 Working in SSH
    With MindTerm, you also have easy access to all of the SSH connection options. Clicking on the menu item Settings>Connection… will pop up a new window where you can set port forwarding, as well as more esoteric items such as the type of cipher or the type of compression to use.
    Step 13 Closing connections
    You close your session with the exit command, just like with a regular SSH client. Once the connection is shut down, MindTerm resets itself and is ready for a new connection to a new host.
    Step 14 Saving connections
    Whenever you connect to a new host, MindTerm asks you whether you want to save it in the list of hosts under an optional alias. To get access to these saved connections, you will need to click on the menu item File>Connect…. This will pop up a connection window where you can select the server from a drop-down box.
    Step 15 Client/server browser-based SSH
    The previous two methods have an advantage where all of the SSH connections are essentially only through the client and the server. This also means that the machine you are working on also needs to allow network connections on the ports that you need, most often port 22. But what can you do if your desktop is locked down to only allowing HTTP traffic? In this case, you need to move the workhorse part of your SSH connection off to another machine, and connect to it over HTTP with your browser. The most common choice for this is shellinabox.
    Step 16 Installation
    Once you download the source, you need to install it with the usual ./configure; ./make; ./make install step that should be in most Linux users’ repertoire of skills. You do this on the remote host that you want to connect to.
    Step 17 Starting the server
    Once shellinabox is installed, starting it is done by simply starting up shellinaboxd on the remote host. There are tons of options available as command-line parameters. The most common ones are options like –port=x, and –verbose.
    Step 18 Starting the client
    To start the client, you simply need to open your browser and enter the URL to the remote machine. It will look like http://mymachine.com:4200, where you might have changed the port being used. This will open up a terminal where you can enter your username and password.
    Step 19 Connecting to a different machine
    Once you log in, you can always just SSH to another machine. But if this is something that you always do, you can get shellinabox to do this for you by using the option -s /:SSH:mynewhost.com. This means you could have connection tunnels to multiple different machines, each with its own port.
    Step 20 Connection options
    Because this is the leanest of the web- based SSH clients available, you simply don’t have the same level of configuration options.
    Right-clicking in the terminal window will bring up a set of options that get saved in a web cookie that survives over sessions.
    Step 21 Working with SSH
    Unlike the other methods, you do not have the option to set up more complicated options, like SSH tunnelling. All you get on the client side is pure HTML, with nothing else. If you need more, you will need to use one of the other methods.
    Step 22 Closing connections
    Like every other SSH client, you shut down your connection with the exit command. This leaves your browser window open with a button popping up in the centre labelled Connect. Clicking on this button will refresh the screen and reopen the connection to your remote host.

    Closing connections
    Closing connections
    Step 23 Saving connections
    Unfortunately, there is no real way to ‘store’ a set of connection strings to different machines within shellinabox. The best option open to you is to configure a series of daemons on different ports tunnelling to different machines, and then you can save the URLs to these servers as bookmarks in your browser.
    Step 24 Where to now?
    Hopefully this tutorial will have shown you some options that are available when you get stuck with an overly locked down machine. If these don’t fit your exact situation, don’t be afraid to look for some of the other options available out in the wild.

    10 snazzy music production tools for Ubuntu/Linux

    $
    0
    0
    http://www.techdrivein.com/2014/02/10-music-production-tools-for-ubuntu-linux.html

    Like many other niches, music production was not really a Linux forte. But that's changing now and like what happened to the video editing scene, popular music production tools are finding its way into Linux. Though I love listening to all kinds of music, I'm no music production expert. And hence I can't pass informative judgments on any of the applications you're going to read about in the article below. Consider this blogpost as a brief introduction to different music production tools available for Ubuntu and Linux, and not as a review per se. So here we go again. 10 useful music production tools for Ubuntu and Linux.

    Bitwig Studio DAW for Linux

    Bitwig Studio Digital Audio Workstation
    • Bitwig Studio is a multi-platform (supports Windows, Mac and Linux) music-creation tool for production, performance and DJing.
    • Bitwig Studio is made by developers that used to work on Ableton Live, a Windows only Digital Audio Workstation (DAW). And like Lightworks for video editing, Bitwig Studio will be a professional grade music production tool with support for Linux platform. 
    • Expected release date: March 26, 2014. Know more.
    ------------------------------------------------------------------------------------------------------------------------
    Ardour audio mixing software linux

    Ardour: Audio mixing software for Linux
    • Record, edit and mix audio using Ardour. Supports Linux and Mac. 
    • Ardour is open source and is released under GPLv2/GPLv3 license.
    • Ardour is a great example of commercial free-libre software. Users who download from ardour.org are asked to pay at least $1 for downloading prebuilt binaries of Ardour; those users then have the right to obtain minor updates until the next major release. 
    • Another option is to subscribe by paying $1, $4 or $10 per month. Subscribers can download prebuilt binaries of all updates during the subscription period.
    • Without paying anything, users can download the full source code for all platforms.
    ------------------------------------------------------------------------------------------------------------------------
    Renoise DAW for linux

    Renoise Digital Audio Workstation
    • Renoise is a Digital Audio Workstation (DAW) with a unique top-down approach to music composition known as a tracker interface.
    • Features include full MIDI and MIDI sync support, VST 2.0 plugin support, ASIO multi I/O cards support, integrated sampler and sample editor, internal real-time DSP effects with unlimited number of effects per track, master and send tracks, full automation of all commands, hi-fi .WAV rendering (up to 32 bit 96 kHz), Rewire support, etc.
    • A full version of Renoise cost USD 78.00, which is noticeably cheaper than competing digital audio workstations (DAWs) such as Ableton Live and even the upcoming Bitwig Studio which costs around USD 749 and USD 400 (rumored) respectively. 
    ------------------------------------------------------------------------------------------------------------------------
    top DAW on linux
    Tracktion Music Production Software for Linux
    • Tracktion is yet another high-profile entrant into the Linux music production scene.
    • Tracktion is a digital audio workstation for recording and editing audio and MIDI. The project was started with the intention of creating the most easy-to-use music production tool out there. Tracktion is proprietary though.
    • Support for a wide range of audio formats including  WAV, AIFF and Ogg-Vorbis.
    • Tracktion beta version for Linux is free now. Get it here
    ------------------------------------------------------------------------------------------------------------------------

    top music production tools on Linux

    Rosegarden Digital Audio Workstation (Linux exclusive)
    • Rosegarden is an open source digital audio workstation for Linux, based around a MIDI sequencer that features a rich understanding of music notation and includes basic support for digital audio.
    • Ideal for composers, musicians, and students working from a small studio or home recording environments. Quite easy to learn and runs exclusively on Linux.
    ------------------------------------------------------------------------------------------------------------------------
    10 best music production tools for linux
    Hydrogen: Advanced drum machine for Linux
    • Hydrogen is an advanced drum machine for Linux, an electronic musical instrument designed to imitate the sound of drums or similar percussion instruments.  
    • Hydrogen's interface uses Qt library and the entire code-base is released to the public under the GNU General Public License. 
    ------------------------------------------------------------------------------------------------------------------------

    MIXXX professional DJing software for Linux

    Mixxx: Linux's very own professional DJing software
    • Mixxx is a free and open source digital DJing software that allows mixing music in your Linux system with ease. 
    • Mixxx started off as a humble project for a doctoral thesis way back in 2001. Today it is a full-fledged application that is downloaded over one million times annually.
    • It is licensed under the GPL (v2.0 or later) and runs on all major desktop operating systems.
    • More download options here.
    ------------------------------------------------------------------------------------------------------------------------

    edit mp3 in ubuntu using audacity

    Audacity: Record and edit music in Linux with ease
    • Audacity is the most well-known application here, and perhaps the most basic too.
    • Audacity is a free and open source, cross-platform software for recording and editing all kinds of music and audio. It is one of the most downloaded software in SourceForge, with nearly 100 million downloads. 
    • More download options for Audacity can be found here
    ------------------------------------------------------------------------------------------------------------------------
    best music production tools linux
    LMMS: Linux MultiMedia Studio
    • LMMS is yet another free and open-source, cross-platform software that allows you to produce music with your computer. This include creating of melodies and beats, synthesizing and mixing of sounds and arranging samples.
    • LMMS is available for Linux and Windows. Download here
    ------------------------------------------------------------------------------------------------------------------------

    top 10 music production tools on linux and Ubuntu

    JACK: Jack Audio Connection Kit
    • Jack Audio Connection Kit (JACK) is perhaps the most important tool as far as music production on Linux is concerned. It is a professional sound server daemon that provides real-time, low latency connections for both audio and MIDI data between applications that implement its API.
    • It can connect a number of different applications to an audio device, as well as allowing them to share audio between themselves.
    • Most of the open-source applications listed above and plenty more out there does use its API. See this exhaustive list for yourself. 
    • The server is free software, licensed under the GNU GPL, while the library is licensed under the more permissive GNU LGPL.
    • Download options here.

    How to convert an HTML web page to PNG image on Linux

    $
    0
    0
    http://xmodulo.com/2014/02/convert-html-web-page-png-image-linux.html

    One of the easiest way to screen capture a particular web page as a PNG image is by using CutyCapt, which is a convenient command line Linux tool for converting any HTML webpage to a variety of vector and bitmat image formats (e.g., SVG, PDF, PS, PNG, JPEG, TIFF, GIF). Internally, CutyCapt uses WebKit rendering engine to export webpage rendering output to an image file. Built with Qt, CutyCapt is actually a cross-platform application available for other platforms such as Windows as well.
    In this tutorial, I will describe how to convert an HTML web page to PNG image format using CutyCapt.

    Install CutyCapt on Linux

    Here are distro-specific instructions to install CutyCapt on Linux.

    Install CutyCapt on Debian, Ubuntu or Linux Mint

    $ sudo apt-get install cutycapt

    Install CutyCapt on Fedora

    $ sudo yum install subversion qt-devel qtwebkit-devel gcc-c++ make
    $ svn co svn://svn.code.sf.net/p/cutycapt/code/ cutycapt
    $ cd cutycapt/CutyCapt
    Before compilation on Fedora, you need to patch source code.
    Open CutyCapt.hpp with a text editor, and add the following two lines at the beginning of the file.
    #include 
    #include
    Finally, compile and install CutyCapt as follows.
    $ qmake-qt4
    $ make
    $ sudo cp CutyCapt /usr/local/bin/cutycapt

    Install CutyCapt on CentOS or RHEL

    First enable EPEL repository on your Linux. Then follow the same procedure as in Fedora to build and install CutyCapt.

    Convert HTML to PNG with CutyCapt

    To take a screenshot of an HTML page as a PNG image, simply run CutyCapt in the following format.
    $ cutycapt --url=http://www.cnn.com --out=cnn.png
    To save an HTML page to a different format (e.g., PDF), simply specify the output file appropriately.
    $ cutycapt --url=http://www.cnn.com --out=cnn.pdf
    The following shows command-line options of cutycapt.

    Convert HTML to PNG with CutyCapt on a Headless Server

    While CutyCapt is a CLI tool, it requires an X server running. If you attempt to run CutyCapt on a headless server, you will get the error:
    cutycapt: cannot connect to X server :0
    If you want to run CutyCapt on a headless server without X windows, you can set up Xvfb (lightweight "fake" X11 server) on the server, so that CutyCapt does not complain.
    To install Xvfb on Debian, Ubuntu or Linux Mint:
    $ sudo apt-get install xvfb
    To install Xvfb on Fedora, CentOS or RHEL:
    $ sudo yum install xvfb
    After installing Xvfb, proceed to run CutyCapt as follows.
    $ xvfb-run --server-args="-screen 0, 1280x1200x24" cutycapt --url=http://www.cnn.com --out=cnn.png
    It will launch Xvfb server first, and then use CutyCapt to screen capture the webpage. So it may take longer. If you want to make multiple screenshots, you may want to start Xvfb server as a background daemon beforehand.

    Advanced GDB tips and tricks

    $
    0
    0
    http://www.openlogic.com/wazi/bid/336594/advanced-gdb-tips-and-tricks


    The GNU Debugger (GDB) is one of the most popular debugging tools available on Linux and Unix-like systems. Learn the advanced debugging techniques in this article to improve your development process.
    To create the examples here, I used GDB 7.6.1-ubuntu and GCC 4.8.1, and compiled the C code using the -ggdb option.

    Conditional breakpoints

    Breakpoints are an integral part of a debugger. They let you pause program execution to do things such as examining variable values. While you probably know how to use breakpoints, you can debug your code better and faster by using conditional breakpoints.
    Suppose your code crashes within a loop that runs hundreds or thousands of times. It would be impractical to put a simple breakpoint anywhere in that loop to catch a problem on some unknown iteration. With a conditional breakpoint, however, you can pause your program only when some condition is met.
    Let's see how it works with the code below, which produces a floating point exception error on execution:
    #include 

    int main()
    {
    int num = -1;
    int total = -1;
    int count = 0;
    int values[] = {10, 256, 55, 67, 43, 89, 78, 78, 89, 0};

    while(count < 10)
    {
    num = values[count];
    total = num + 0xffffffff/num;

    printf("\n result = [%d]\n", total);
    count++;
    }

    return 0;
    }
    You suspect that the crash happens when num is zero in line 13. You could put a breakpoint on that line, but the program would halt every time the line is executed. Instead, set a conditional breakpoint by specifying the condition subject to which the breakpoint should hit, which in this case is num==0:
    $ gdb test
    GNU gdb (GDB) 7.6.1-ubuntu
    Copyright (C) 2013 Free Software Foundation, Inc.
    License GPLv3+: GNU GPL version 3 or later
    This is free software: you are free to change and redistribute it.
    There is NO WARRANTY, to the extent permitted by law. Type "show copying"
    and "show warranty" for details.
    This GDB was configured as "i686-linux-gnu".
    For bug reporting instructions, please see:
    ...
    Reading symbols from /home/himanshu/practice/wazi/gdb/test...done.
    (gdb) break 13 if num==0
    Breakpoint 1 at 0x804849c: file test.c, line 13.
    (gdb) run
    Starting program: /home/himanshu/practice/wazi/gdb/test

    result = [429496739]

    result = [16777471]

    result = [78090369]

    result = [64104056]

    result = [99883003]

    Breakpoint 1, main () at test.c:13
    13 total = num + 0xffffffff/num;
    (gdb) n

    Program received signal SIGFPE, Arithmetic exception.
    0x080484aa in main () at test.c:13
    13 total = num + 0xffffffff/num;
    (gdb)
    As you can see, the conditional breakpoint made the program stop when the value of the variable num was zero. I then entered the gdb command n (for next) and confirmed that the crash happens when num is zero.
    If you want to cross-check that the debugger stopped the program execution at the correct condition, you can print the value of the variable num through the p 'num' command.

    Ignore breakpoints

    Sometimes you don't have any clue about the problem condition, so you might want the debugger to tell you the exact number of loop iterations after which the crash occurs, to help you analyze loop conditions. GDB lets you ignore a breakpoint a specified number of times. You can then check the breakpoint information to see the number of loop iterations after which the crash occurs.
    For example, the code shown below also gives a floating point exception on execution. But let's suppose that, because of the way the code was written, it is difficult for you to pinpoint a condition under which the crash occurs:
    #include 

    int main()
    {
    int num = -1;
    int total = -1;
    int count = 50;

    while(count--)
    {
    // a lot of code here

    total = num + 0xffffffff/(count-10);
    printf("\n result = [%d]\n", total);

    // a lot of code here
    }

    return 0;
    }
    You can put a breakpoint at the entry of the loop and ask GDB to ignore it every time. At the end of program execution, use the info command to see how many times the program encountered the breakpoint before the crash happened.
    By the way, here and in all the subsequent examples, I used GDB's -q (for quiet) command-line option to suppress introductory and copyright messages.
    $ gdb -q test
    Reading symbols from /home/himanshu/practice/wazi/gdb/test...done.
    (gdb) break 10
    Breakpoint 1 at 0x8048440: file test.c, line 10.
    (gdb) info breakpoints
    Num Type Disp Enb Address What
    1 breakpoint keep y 0x08048440 in main at test.c:10
    (gdb) ignore 1 50
    Will ignore next 50 crossings of breakpoint 1.
    (gdb) run
    Starting program: /home/himanshu/practice/wazi/gdb/test

    result = [110127365]

    result = [113025454]

    result = [116080196]

    ...
    ...
    ...

    result = [2147483646]

    result = [-2]

    Program received signal SIGFPE, Arithmetic exception.
    0x08048453 in main () at test.c:13
    13 total = num + 0xffffffff/(count-10);
    (gdb) info break 1
    Num Type Disp Enb Address What
    1 breakpoint keep y 0x08048440 in main at test.c:10
    breakpoint already hit 40 times
    ignore next 10 hits
    (gdb)
    Note that the number 1, used in the ignore command and later in the info break 1 command, is the breakpoint number, which you can get from the info breakpoints command.
    In this example the output of the info break 1 command displayed the exact number of iterations (40) after which crash occurred. You now have an idea that something went wrong after exactly 40 loop iterations, which should lead you to the problematic line total = num + 0xffffffff/(count-10);.

    Use watchpoints

    Sometimes a variable whose value is not supposed to be changed is passed as an argument into a series of functions, and when the code flow comes back, you observe that the variable's value was changed. To manually debug this kind of problem, you'd have to debug every function to which the variable was passed. A better approach is to use watchpoints, which help you track the value of a specified variable.
    To set a watchpoint on a global variable, first set a breakpoint to stop program execution at the entry of the main() function. For a non-global variable, set a breakpoint at the entry of the function where the variable is in scope. In either case, once the breakpoint hits, set a watchpoint.
    In the following code, the value of the variable ref_val is passed from the main() function to the func5() function, and when the flow comes back to the main function, we find that the value is changed from 256 to 512.
    #include 

    void func5(int *ptr)
    {
    // a lot of code here
    *ptr = 512;
    }

    void func4(int *ptr)
    {
    // a lot of code here
    func5(ptr);
    }

    void func3(int *ptr)
    {
    // a lot of code here
    func4(ptr);
    }

    void func2(int *ptr)
    {
    // a lot of code here
    func3(ptr);
    }

    void func1(int *ptr)
    {
    // a lot of code here
    func2(ptr);
    }

    int main()
    {
    int ref_val = 256;

    func1(&ref_val);

    printf("\n ref_val = [%d]\n", ref_val);

    return 0;
    }
    To debug this issue, you can put a watchpoint at the entry of each function involved in the call sequence. Here I test func5() first. I set a breakpoint at its entry, and when it is hit, I put the variable *ptr under watchlist using the watch command:
    $ gdb -q test
    Reading symbols from /home/himanshu/practice/wazi/gdb/test...done.
    (gdb) break test.c:func5
    Breakpoint 1 at 0x8048420: file test.c, line 6.
    (gdb) run
    Starting program: /home/himanshu/practice/wazi/gdb/test

    Breakpoint 1, func5 (ptr=0xbffff0bc) at test.c:6
    6 *ptr = 512;
    (gdb) watch *ptr
    Hardware watchpoint 2: *ptr
    (gdb) c
    Continuing.
    Hardware watchpoint 2: *ptr

    Old value = 256
    New value = 512
    func5 (ptr=0xbffff0bc) at test.c:7
    7 }
    (gdb)
    When I continued program execution, GDB displayed the new and old values of the variable being watched, which in this case were different. Just like a breakpoint, a watchpoint stops program execution, but at the point at which the value changes. Once you know the culprit, which is func5() in this case, you can invest your time debugging it.

    Call user-defined or system functions

    Sometimes you might want to test a function by providing inputs to it. To do this, you could change the code that calls that function every time, or add extra code that makes it possible to send inputs to that function through STDIN, which is usually the command line. Alternatively, you can use GDB's call command.
    Suppose you want to test the function user_defined_strlen() defined in the following code. As you can see, it essentially calculates and returns the length of a string passed to it as argument:
    #include 

    unsigned int user_defined_strlen(char *ptr)
    {
    int len = 0;
    printf("\n User-defined strlen() function called with string [%s]\n", ptr);

    if(NULL == ptr)
    {
    printf("\n Invalid string\n");
    return 0;
    }

    while(*(ptr++) != '\0')
    len++;

    printf("\n[%u]\n", len);
    return len;
    }

    int main()
    {
    char *ptr = "some-string";

    user_defined_strlen(ptr);

    return 0;
    }
    You can put a breakpoint at the entry of the main() function. When GDB hits the breakpoint, execute the call command by passing to it a function name, along with arguments to test:
    $ gdb -q test
    Reading symbols from /home/himanshu/practice/wazi/gdb/test...done.
    (gdb) break test.c:main
    Breakpoint 1 at 0x80484bd: file test.c, line 23.
    (gdb) run
    Starting program: /home/himanshu/practice/wazi/gdb/test

    Breakpoint 1, main () at test.c:23
    23 char *ptr = "some-string";
    (gdb) call user_defined_strlen("wazi")

    User-defined strlen() function called with string [wazi]

    [4]
    $1 = 4
    (gdb)
    You can also call standard library functions using the call command. For instance, at the same breakpoint, you can call the strlen() function to cross-check the output of the function:
    (gdb) call strlen("wazi")
    $2 = 4
    (gdb)

    Auto-display variable values

    As a complement to a watchpoint, which stops execution whenever the value of a variable or an expression changes, you can use the display command to print the value of a variable or expression to see how it changes.
    For example, in the code snippet above, if you wanted to display the value of the len variable as the while loop progresses, you could put a breakpoint at the while condition, execute the display command with len as an argument, and step through the code with the n command – or step through the code with n once, and just press Enter at every subsequent GDB prompt, because the debugger repeats the last command by default.
    $ gdb -q test
    Reading symbols from /home/himanshu/practice/wazi/gdb/test...done.
    (gdb) break 14
    Breakpoint 1 at 0x8048486: file test.c, line 14.
    (gdb) run
    Starting program: /home/himanshu/practice/wazi/gdb/test

    User-defined strlen() function called with string [some-string]

    Breakpoint 1, user_defined_strlen (ptr=0x80485c2 "some-string") at test.c:14
    14 while(*(ptr++) != '\0')
    (gdb) display len
    1: len = 0
    (gdb) n
    15 len++;
    1: len = 0
    (gdb) n
    14 while(*(ptr++) != '\0')
    1: len = 1
    (gdb) n
    15 len++;
    1: len = 1
    (gdb) n
    14 while(*(ptr++) != '\0')
    1: len = 2
    (gdb) n
    15 len++;
    1: len = 2
    (gdb) n
    14 while(*(ptr++) != '\0')
    1: len = 3
    (gdb) n
    15 len++;
    1: len = 3
    (gdb) n
    14 while(*(ptr++) != '\0')
    1: len = 4
    (gdb) n
    15 len++;
    1: len = n
    (gdb) n
    14 while(*(ptr++) != '\0')
    1: len = 5
    (gdb) n
    15 len++;
    1: len = 5
    The undisplay command removes an auto-displayed variable or expression previously set with display. It expects an expression number, which you can determine with the info command:
    (gdb) info display
    Auto-display expressions now in effect:
    Num Enb Expression
    1: y len
    (gdb) undisplay 1
    (gdb) n
    15 len++;
    (gdb) n
    14 while(*(ptr++) != '\0')
    (gdb) n
    15 len++;
    (gdb) n
    14 while(*(ptr++) != '\0')
    (gdb) n
    15 len++;

    In conclusion

    As you can see, GDB offers several advanced tools that can help you find the flaws in your programs' code. You probably have your own favorite advanced debugging techniques – please share them in the comments below.

    What is good video editing software on Linux?

    $
    0
    0
    http://xmodulo.com/2014/03/good-video-editing-software-linux.html

    A video editor allows you to handle various post-production video editing jobs which typically involve arranging, cutting, pasting, trimming, and otherwise enhancing (e.g., adding effects to) video clips through the timeline interface. In modern video editing software, things like multi-codec import/transcoding, non-linear video editing, or even HD video support are pretty much standard nowadays.
    In this post, I am going to show ten popular video editing software available on Linux. I will not cover subjective merits such as usability or interface design, but instead highlight notable features of each video editor. If you have tried any particular video editor listed here, feel free to share your experience or opinion.

    1. Avidemux


    • License: GNU GPL
    • Cross-platform (Linux, BSD, MacOS X, Windows)
    • Supports both GUI and command-line modes
    • Support for JavaScript (thanks to SpiderMonky JavaScript engine)
    • Built-in subtitle processing
    • Official website: http://fixounet.free.fr/avidemux

    2. Cinelerra-CV


    • License: GNU GPL
    • Community edition of Cinelerra video editor.
    • Support for video compositing.
    • Drag and drop files from file manager.
    • OpenGL-driven GPU acceleration for video playback.
    • Video/audio effects and transitions.
    • Direct capture from camcorders.
    • Cross-platform (Linux and Windows).
    • Official website: http://cinelerra.org

    3. Flowblade


    • License: GNU GPL v3
    • Support for multiple file types based on FFmpeg
    • Drag and drop files from file manager
    • Support for video and image compositing
    • Image and audio effects
    • Automatic clip placement on the timeline
    • Official website: https://code.google.com/p/flowblade/

    4. Jahshaka


    • License: GNU GPL
    • Cross-platform (Linux, MacOS X, Windows)
    • Support for 2D/3D animation effects and video composting
    • Support for collaborative editing (e.g., editing server and centralized database)
    • Media/asset management
    • GPU based effects
    • Official website: http://www.jahshaka.com

    5. Kdenlive


    • License: GNU GPL v2+
    • Video editor for the KDE desktop
    • Support for multiple file types based on FFmpeg
    • Video/audio effects and transitions
    • Ability ot mix video, audio and still images from different sources
    • Video capture from cameras, webcams, Video4Linux devices or X11 screen
    • Export to Internet video sharing sites such as YouTube, Dailymotion or Vimeo
    • Official website: http://www.kdenlive.org

    6. Lightworks


    • License: Freemium
    • Cross-platform (Linux, BSD, MacOS X, Windows)
    • Multi-language support
    • GPU-accelerated real-time video effects and composting
    • Official website: http://www.lwks.com

    7. LiVES


    • License: GNU GPL
    • Cross-platform (Linux, BSD, MacOS X, Solaris)
    • Multi video formats via mplayer
    • Extendable video/audio effects via plugins
    • Support for remote control via OSC protocol
    • Video capture from FireWire cameras and TV cards
    • Lossless backup and crash recovery
    • Support for clip import from YouTube
    • Official website: http://lives.sourceforge.net

    8. OpenShot


    • License: GNU GPL v3
    • Support for multiple file types based on FFmpeg
    • Drag and drop files from file manager
    • Support for 2D titles (thanks to Inkscape) and 3D-animated titles (thanks to Blender)
    • Digital zooming
    • Animated video transition with preview
    • Support for video compositing and watermark images
    • Scrolling eding credits or texts
    • Official website: http://www.openshot.org

    9. Pitivi


    • License: GNU LGPL
    • Video import, conversion and rendering powered by GStreamer Editing Service
    • Video/audio effects and transitions
    • Detachable UI
    • Multi-language support (thanks to GNOME integration)
    • Official website: http://www.pitivi.org

    10. Shotcut


    • License: GNU GPL
    • Cross-platform (Linux, MacOS X, Windows)
    • Support for multiple file types based on FFmpeg
    • Customizable UI via dockable panels
    • Multi-format timeline (e.g., with different resolutions and frame rates)
    • Video capture from webcam, HDMI, IP streams and X11 screen
    • Drag and drop files from file manager
    • GPU-assisted image processing with OpenGL
    • Official website: http://www.shotcut.org

    Compress your web pages for better performance

    $
    0
    0
    http://www.openlogic.com/wazi/bid/336187/compress-your-web-pages-for-better-performance


    Users always want faster access to web resources. If your website is sluggish and serves pages slowly, would-be visitors won't wait, and will go elsewhere instead. Fortunately, you can employ several tools to compress your code and output and thus send fewer bytes over the Net, enhancing download times and creating a better user experience.
    We'll look at tools that can:
    • Set your web server to compress (zip) all of its output.
    • Minify your JavaScript code, to yield a shorter but equivalent version.
    • Clean up your CSS rules and HTML code and remove unnecessary contents.
    Some of the tools you must apply before deploying your site, and some require configuration changes to Apache or whatever web server you use. We won't be going into any tools that require changing your program logic (for example, using jQuery to dynamically load JavaScript on demand, for a shorter initial download) because that approach can inject interesting bugs into your pages.

    Deflate your output

    Whenever a client browser requests a page from a server, it can specify whether it will accept compressed data (meaning that the client can decompress whatever it receives) by means of the Accept-Encoding request header. The server, if it is able to produce the requested compression, will include the Content-Encoding header in the returned data, showing what method it applied to the data.
    You can easily see how this works with the wget command and Wazi's own servers. If you ask for the page without encoding, you get 76,250 bytes (about 75K):
    > wget -S -nv -O wazi.html www.openlogic.com/wazi
    HTTP/1.1 200 OK
    Cache-Control: private
    Content-Type: text/html; charset=utf-8
    Server: Microsoft-IIS/7.5
    X-AspNet-Version: 2.0.50727
    X-Powered-By: ASP.NET
    Date: Sun, 16 Feb 2014 00:45:24 GMT
    Transfer-Encoding: chunked
    Connection: keep-alive
    Connection: Transfer-Encoding
    2014-02-15 22:45:24 URL:http://www.openlogic.com/wazi [76250] -> "wazi.html" [1]
    However, if you include the Accept-Encoding header, you get the same data, but gzipped, reduced more than 80% to 14,315 bytes, or less than 14K:
    > wget -S -nv -O wazi.compressed --header "Accept-Encoding: gzip, deflate, compress" www.openlogic.com/wazi
    HTTP/1.1 200 OK
    Cache-Control: private
    Content-Type: text/html; charset=utf-8
    Server: Microsoft-IIS/7.5
    X-AspNet-Version: 2.0.50727
    X-Powered-By: ASP.NET
    Vary: Accept-Encoding
    Content-Encoding: gzip
    Content-Length: 14315
    Date: Sun, 16 Feb 2014 00:46:10 GMT
    Connection: keep-alive
    2014-02-15 22:46:10 URL:http://www.openlogic.com/wazi [14315/14315] -> "wazi.compressed" [1]
    All commonly used web browsers support this kind of compression, and routinely ask servers if they can provide compressed data, so enabling this feature for your site is an easy win. To do so with Apache you have to enable mod_deflate; include a LoadModule deflate_module /path/to/your/mod_deflate.so line in your httpd.conf file. The path for the module depends on your distribution, but you can easily determine it by checking out the other current LoadModule lines. If the module doesn't exist, use your favorite package manager to get it; mod_deflate is standard, and available in distribution repositories.
    You also have to specify what kind of MIME type results should be compressed. Edit your .htaccess file to include a list like this:

      AddOutputFilterByType DEFLATE application/javascript
      AddOutputFilterByType DEFLATE application/rss+xml
      AddOutputFilterByType DEFLATE application/x-javascript
      AddOutputFilterByType DEFLATE application/xml
      AddOutputFilterByType DEFLATE application/xhtml+xml
      AddOutputFilterByType DEFLATE text/css
      AddOutputFilterByType DEFLATE text/html
      AddOutputFilterByType DEFLATE text/javascript
      AddOutputFilterByType DEFLATE text/plain
      AddOutputFilterByType DEFLATE text/richtext
      AddOutputFilterByType DEFLATE text/x-component
      AddOutputFilterByType DEFLATE text/xsd
      AddOutputFilterByType DEFLATE text/xsl
      AddOutputFilterByType DEFLATE text/xml
      AddOutputFilterByType DEFLATE image/svg+xml
      AddOutputFilterByType DEFLATE image/x-icon

    Not all files should be compressed; for example, compressing an already compressed ZIP file before sending it to the client would be a waste of time.
    Restart your Apache server, and from that moment on, the web server will be able to honor all data compression requests. If you're using another web server, check the project's documentation; changes along the lines of what we did for Apache will be in order, but since all major servers support data compression, enabling it shouldn't be a hard task.

    Minify your JavaScript

    Even if you are deflating its output, the files that your web server has to send should be as small as possible. Many tools can minify your JavaScript code, producing an equivalent but smaller version. As a side benefit, the software can obfuscate files, meaning that they will be harder to understand by third parties, thus providing some degree of intellectual property protection, and it can optimize them.
    YUI Compressor 2.4.8, developed by the Yahoo! User Interface group, is provided as a Java jar file that you run on Linux, Windows, or OS X. To test it, I used the latest jQuery version 2 uncompressed file, which runs nearly 240K for 10,000 lines of code. For the test I purposely got the bigger development version of jQuery; for actual use on your site you would use the 81K production version.
    To learn about YUI Compressor's options, type java -jar yuicompressor-2.4.8.jar --help. For my test I ran java -jar yuicompressor-2.4.8.jar -o jquery.yui.js jquery-2.1.0.js, and it produced a 127K file, about 50% size of the original. Just to give you a taste of minified code, the start of the new file looks like this:
    /*!
    * jQuery JavaScript Library v2.1.0
    * http://jquery.com/
    *
    * Includes Sizzle.js
    * http://sizzlejs.com/
    *
    * Copyright 2005, 2014 jQuery Foundation, Inc. and other contributors
    * Released under the MIT license
    * http://jquery.org/license
    *
    * Date: 2014-01-23T21:10Z
    */
    (function(b,a){if(typeof module==="object"&&typeof module.exports==="object"){module.exports=b.document?a(b,true):function(c){if(!c.document){throw new Error("jQuery requires a window with a document")}
    return a(c)}}else{a(b)}}(typeof window!=="undefined"?window:this,function(window,noGlobal){var arr=[];var slice=arr.slice;var concat=arr.concat;var push=arr.push;var indexOf=arr.indexOf;var class2type={
    };var toString=class2type.toString;var hasOwn=class2type.hasOwnProperty;var trim="".trim;var support={};var document=window.document,version="2.1.0",jQuery=function(selector,context){return new jQuery.f
    n.init(selector,context)},rmsPrefix=/^-ms-/,rdashAlpha=/-([\da-z])/gi,fcamelCase=function(all,letter){return letter.toUpperCase()};jQuery.fn=jQuery.prototype={jquery:version,constructor:jQuery,selector:
    "",length:0,toArray:function(){return slice.call(this)},get:function(num){return num!=null?(num<0 args="" arguments="" callback.call="" callback="" e="" each:function="" elem="" elems="" first:function="" function="" i="" j="" jquery.each="" jquery.map="" last:function="" len="this.length,j=+i+(i<0?len:0);return" map:function="" num="" onstructor="" pushstack:function="" q:function="" ret.prevobject="this;ret.context=this.context;return" ret="" return="" slice.apply="" slice.call="" slice:function="" this.eq="" this.length="" this.pushstack="" this="" var="">=0&&j


    Three online JavaScript minifying service alternatives
    The javascript-minifier
    page lets you paste your code and get a minified alternative; for a
    command-line process you can also invoke it as a web service, through a
    POST request. Packer is another online alternative, which you can also use as a PHP, Perl, or .NET application. And jscompress is based upon both Packer and JSMin, an old tool by Douglas Crockford.


    Note that comments starting with /*! are kept, so
    copyright and license texts won't be taken out. (Other compressors may
    not make that distinction, and may take out all comments, whatever their
    origin.) The produced code is more compact than the original, and if it
    were further compressed by Apache as we saw earlier, it would go down
    to about 30K, which is just an eighth of the original size.


    We'll revisit YUI Compressor again when we consider how to compress
    CSS, but let's now look at another compressor that offers even more
    options and code trimming.


    Google's Closure
    is in fact more than a minifier, because it not only removes extra
    white space, line end characters, and the like, it also revises your
    JavaScript code into better JavaScript by analyzing your code, removing
    useless bits, and rewriting whatever's left into a smaller, tighter,
    more efficient version. As an extra, it warns about possible JavaScript
    problems. You can use Closure as a web service or a RESTful API, but I
    went with a command-line Java jar version. The latest version is dated 1/10/2014, so it's quite up-to-date.


    Closure has far too many options to list; after unzipping your download, run java -jar compiler.jar --help to check them out. Working again with the jQuery source code, I ran java
    -jar compiler.jar --compilation_level ADVANCED_OPTIMIZATIONS --js
    jquery-2.1.0.js --js_output_file=jquery.closure.advanced.js
    and
    got a file of about 75K, which is smaller than jQuery's own minified
    version. Here is a sample of the code. Notice that it is even harder to
    understand than the YUI Compressor version; in advanced compilation
    mode, Closure changes variable and function names, inlines code, and
    performs several optimizations that go beyond minifying.


    (function(q,W){"object"===typeof module&&"object"===typeof module.jc?module.jc=q.document?W(q,!0):function(q){if(!q.document)throw Error("jQuery requires a window with a document");return W(q)}:W(q)})("
    undefined"!==typeof window?window:this,function(q,W){function ka(a){return a.ownerDocument.defaultView.getComputedStyle(a,null)}function X(a,b){a=b||a;return"none"===d.c(a,"display")||!d.contains(a.owne
    rDocument,a)}function Gb(a,b){return b.toUpperCase()}function d(a,b){return new d.b.la(a,b)}function Ba(a){var b=
    a.length,c=d.type(a);return"function"===c||d.N(a)?!1:1===a.nodeType&&b?!0:"array"===c||0===b||"number"===typeof b&&0")).ob(b.documentEle
    ment),b=T[0].contentDocument,b.write(),b.close(),c=Wa(a,b),T.detach()),Ya[a]=c);return c}function U(a,b,c){var f,e,g=a.style;(c=c||ka(a))&&(e=c.getPropertyValue(b)||c[b]);c&&(""!==e||d.contains(a.ownerDoc [...]
    By employing this kind of tool, your development team can work with clear, fully commented and indented versions of your source code, while end users get a much shorter version that's optimized for speed – a win-win situation!

    Compress CSS and HTML

    Your website consists not only of JavaScript, but also CSS rules and HTML code, so to round things out let's see how to compress such content. YUI Compressor, which we already looked at for JavaScript, can work with CSS files too. I got one of OpenLogic's own CSS files, which is 22K in size and about 1,400 lines long, and ran java -jar yuicompressor-2.4.8.jar wazi.css -o wazi.yui.css. That got the file down to 17K, a 25% size reduction, in a single extra long line.
    .PreviewPanel{border-right:silver thin solid;border-top:silver thin solid;border-left:silver thin solid;border-bottom:silver thin solid}.linksubmission{border:solid 0 red;font:normal 11px Tahoma,Arial,V
    erdana,sans-serif}.linksubmission IMG{border:solid 0 red !important}.linksubmission A{border:solid 0 red !important;text-decoration:none !important;font:normal 11px Tahoma,Arial,Verdana,sans-serif}.Grid
    Header_Monochrome a:visited,.GridHeader_Monochrome a:hover{color:white !important;font:bold 11px Tahoma !important}.GridPager_Monochrome a:visited,.GridPager_Monochrome a:hover{font:normal 11px Tahoma !
    important}.popupHelpTitle{padding-bottom:5px;font-weight:bold;color:black}.nostyle{border:0 solid red !important}.nostyleimg{border:0 solid red !important}.CommandItem{background-color:Transparent;backg
    round-image:none}.Grid{border:1px solid #7c7c94;background-color:#fff;cursor:pointer}.HeadingRow{background-color:#e2e2e2}.HeadingCell{background-color:#e2e2e2;border:1px solid #fff;border-right-color:#
    b5b5b5;border-bottom-color:#b5b5b5;padding:3px}.HeadingCellText{font-family:verdana;font-size:10px;font-weight:bold;text-align:left}.DataRow{background-color:#fff}.DataCell{cursor:default;padding:3px;bo
    rder-right:1px solid #eae9e1;border-bottom:1px solid #eae9e1;font-family:verdana;font-size:10px}.EditDataCell{padding:0 !important;background-color:#e2e2e2;border-width:0 !important}.EditDataField{paddi
    ng:0;padding-left:1px;font-family:verdana;font-size:10px;height:20px;width:98% !important}.DataRow td.FirstDataCell{padding-left:3px}.SelectedRow{background-color:#ffeec2}.SelectedRow td.DataCell{cursor
    :default;padding:2px;padding-left:3px;padding-bottom:3px;font-family:verdana;font-size:10px;border-bottom:1px solid #4b4b6f;border-top:1px solid #4b4b6f;border-right:0}.SelectorCell{background-color:#e2
    e2e2;border:1px solid #fff;border-right-color:#b5b5b5;border-bottom-color:#b5b5b5}.GridFooter{cursor:default;padding:5px}.GridFooter a{color:Black;font-weight:bold;vertical-align:bottom} [...]
    I also tried two online utilities: CSS Minifier and CSS Compressor. The former can be used from the command line or as a web service by doing a POST request. The latter doesn't offer that option but includes extra optimizations, such as changing "0px" to "0," or "#FFFFFF" to "#FFF," and even "#808080" to "gray" (but "black" to "#000"!) so it goes after every possible byte to be reduced.
    For HTML code, htmlcompressor can minify HTML and XML source, and is available as a command-line Java jar file for local usage. It has a large number of available options; type java -jar htmlcompressor-1.5.3.jar --help to check them out. If you are undecided as to which options use, try the -a option, which produces a nice analysis that can help indicate which command-line options you should use. I tested it with the OpenLogic HTML file I used in my deflate tests by using the command java -jar htmlcompressor-1.5.3.jar wazi.html -a. I got the following report:
    ================================================================================
    Setting | Incremental Gain | Total Gain | Page Size |
    ================================================================================
    Compression disabled | 0 (0.0%) | 0 (0.0%) | 75,462 |
    All settings disabled | 79 (0.1%) | 79 (0.1%) | 75,383 |
    Comments removed | 2,042 (2.7%) | 2,121 (2.8%) | 73,341 |
    Multiple spaces removed | 2,492 (3.4%) | 4,613 (6.1%) | 70,849 |
    No spaces between tags | 457 (0.6%) | 5,070 (6.7%) | 70,392 |
    No surround spaces (min) | 0 (0.0%) | 5,070 (6.7%) | 70,392 |
    No surround spaces (max) | 4 (0.0%) | 5,074 (6.7%) | 70,388 |
    No surround spaces (all) | 147 (0.2%) | 5,221 (6.9%) | 70,241 |
    Quotes removed from tags | 1,101 (1.6%) | 6,322 (8.4%) | 69,140 |
    attr. removed | 95 (0.1%) | 6,417 (8.5%) | 69,045 |

    Given this information, you can decide on the actual parameters to use when compressing the HTML file. A nice touch is that htmlcompressor can work with YUI Compressor or Closure, and then compress whatever JavaScript is present in your HTML, for extra savings.

    I also tried out Compress HTML and HTML Compressor, two online tools. These are meant to be used online, but the latter project also offers a way to install its code as an inhouse private service; for security reasons, that seems more interesting. The code it produced is certainly more compact:


    [...]
    The compressed HTML code is about 10% shorter.
    Note that with all these tools, if your site's HTML code is generated by a script, a compressor won't be able to compress it effectively.

    In conclusion

    As you can see, you can take advantage of several ways to reduce file sizes and in effect speed up your web server. The sum of all compression functions – server, JavaScript, CSS, and HTML – produces smaller data transmissions and faster response times. Apply them, and your users will thank you for it!
    0>

    Bring a Linux development environment to Windows with MinGW

    $
    0
    0
    http://www.openlogic.com/wazi/bid/336797/bring-a-linux-development-environment-to-windows-with-mingw


    In general, Linux and Windows development environments aren't compatible. Windows developers often use native integrated development environments (IDE) such as Visual Studio, while Linux programmers use command-line tools such as Make and the GNU Compiler Collection (GCC). While there are cross platform IDEs, most notably Eclipse, the two worlds of Linux and Windows often remain separate.
    However, sometimes it's useful to have one development environment that works across Windows and Linux, such as when you're developing software to run on both platforms. Being able to create Make files and shell scripts that run under both operating systems, as well as being able to use the same compiler suite across both platforms, can reduce development time.
    The open source MinGW and MSYS projects offer a GNU-based development environment for Microsoft Windows, along with a Bourne shell command-line interpreter. MinGW, which stands for Minimalist GNU for Windows, provides a port of GCC with support for C, C++, Ada, and Fortran, while MSYS provides the Bourne shell as an alternative to Microsoft's cmd.exe. Included in the complete system are well-known Linux development tools such as gcc, make, m4, bison, and flex, along with useful command-line utilities such as grep, gawk, gzip, tar, rsync, and ssh.

    Installation

    To get started with these tools, download the MinGW installer (called min-gw-setup.exe) and run it. You'll have the option to change the destination path from its default of C:\MinGW, along with some options about which menu items are created. Select mingw-developer-toolkit, mingw32-base, mingw32-gcc-g++, and msys-base for a basic installation with a C compiler and shell. You can optionally choose Ada, Objective-C, or Fortran as well.
    Extra installation packages are available under All Packages in the left pane. For example, if you want to install the Lua programming language, drill down through All Packages -> MinGW Libraries -> MinGW Supplementary Libraries and mark mingw32-lua for installation.
    To start the installation, click on Apply Changes under the Installation menu and then on Apply in the Schedule of Pending Actions window. The installer will download and install the selected packages.
    Because MinGW and MSYS are actually two different projects that use a common installer, you must perform some additional steps to link the two environments. First, create the C:\MinGW\msys\1.0\etc\fstab with the following line:
    C:\MinGW   /mingw
    If you installed MinGW in a different location then alter the path names accordingly. Before you save the file, ensure that there is at least one blank line at the bottom.
    As an alternative to manually editing the fstab file, you can start a shell by running C:\MinGW\msys\1.0\msys.bat and then run the command /postinstall/pi.sh. When you're prompted for the location of the MinGW installation, type c:/mingw.

    Compiling a C program

    To see how MinGW and MSYS work, create a simple "Hello World" program called hellow.cpp and save it in C:\MinGW\msys\1.0\home\user, where user is your username. If you want to stay completely inside the MinGW environment you can create hellow.cpp using vim:
    #include 

    int main()
    {
    std::cout << "Hello, world!\n";
    }
    From within the MinGW Bourne shell compile the program using the GNU C++ compiler (g++):
    g++ hellow.cpp -o hellow
    The results is the binary executable hellow.exe, which you can run by typing hellow.

    Development environment for native Windows programs

    Although MinGW brings the GNU compiler suite and some of the familiar Linux development tools to Windows, it doesn't try to provide Linux or POSIX compatibility. You can't write code that makes use of Linux system calls and expect them to work under MinGW. If you need Linux system call compatibility, you can use Cygwin, an alternative to MinGW that provides a POSIX layer for Windows.
    Since MinGW provides a native Windows development environment, you can use it to compile programs that call the Win32 API. As an example, create a file called hellowin.cpp:
    #include 

    int main()
    {
    int nResult=MessageBox(NULL,
    "Hello World",
    "Message Box",
    MB_ICONERROR|MB_OK);
    return 0;
    }
    Compile it using g++ hellowin.cpp -o hellowin and execute it by typing hellowin.

    Compiling open source programs

    Although MinGW uses the underlying Win32 API, there's no reason you can't use it to compile portable code that can be run on both Windows and Linux. By the judicious use of conditional compilation and cross-platform libraries, you can create code in the MinGW environment that builds and runs under Linux.
    Consider, for instance, RHash, a console utility for computing and verifying the hash sums of files. It supports CRC32, MD4, MD5, SHA1, SHA256, SHA512, SHA3, and many other hash functions, and you can compile and run it under both Windows and Linux.
    To see how the developers pull off that trick, download rhash-1.3.1-src.tar.gz and copy it into your MinGW home directory. Unpack the tar file with the command tar -zxvf rhash-1.3.1-src.tar.gz. Change directory into the source folder and run make:
    cd rhash-1.3.1
    make
    You can run the resulting executable, rhash.exe, from the command line. So, for instance, to get the MD5 hash of the project's README file, type rhash -M README.
    The shell commands are the same as those used on Linux to build RHash. By examining the code, you can see how the developers use conditional compilation directives such as #ifdef _WIN32 to make the program compatible with the Windows API. For example, in common_func.c, the function rhash_get_ticks() is implemented in two different ways depending on the OS.
    If you want to distribute a program compiled under MinGW, you may need to include some of the DLL files from C:\MinGW\bin with your executable. For example, the C++ version of our Hello World program needs at least libstdc++-6.dll and libgcc_s_dw2-1.dll. The libraries are covered by an MIT-style license that grants you the right to use the software without restriction, though you may need to include a copy of the license file with the DLLs. See the MinGW licensing terms for more information.

    Conclusion

    Common development environments can save time during the software development cycle. MinGW and MSYS provide a way to build, test, and deploy software on Windows using the same tools developers use on Unix-like operating systems.

    Get started in open source online and offline

    $
    0
    0
    https://opensource.com/life/14/2/exploring-open-source-beginners

    What skills do you need and which projects should you participate in as beginner in open source?
    These are common questions for beginners to open source software, hardware, communities, and methodologies. New folks to open source can start their discovery online and offline. Events and projects of many different kinds will help beginners find what they are good at and allow them to get to know their own skills.

    Get started with open source online

    Codecademy

    Beginners in Open Source week

    View the complete collection of Beginners in Open Source articles

    Codecademy is a website where you can learn several programming languages in an interactive way. Languages such as HTML, PHP, Ruby and Python are a few. With each language, you learn the basics, like syntax and commands, and by finishing assignments, you earn points and badges.
    I can recommend Codecademy, as I signed up myself to follow the PHP lessons. The first lessons start real easy, and this course continues to teach you the most common commands and programming structure and syntax. Each lesson ends with practicing what you just learned. All you need for courses at Codecademy is your browser—no extra software is required.

    Code School

    Codeschool takes a different approach for learning; students take what they call "paths" to Ruby, Javascript, HTML/CSS and iOS. Where Codecademy provides its courses in online reading material, Codeschool presents them through video lessons and challenges.
    Each "path" contains several lessons that take you through a specific programming language. Again, no extra setup is required, just the site and your browser. What makes Codeschool interesting is that they also provide a course in programming apps for the iPhone and iPad.

    Code.org

    Code.org is known for its Hour of Code program and offers similar courses such as Javascript and Python but also tutorials for beginners. These beginner tutorials let you solve puzzles in a Scratch-like environment based on the Angry Birds game, teaching you concepts like repeat-loops, conditionals, and basic algorithms.
    Code.org clearly states the age category to which the courses apply, and the requirements to follow them, which in most cases is a browser or an iOS or Android device.

    Scratch

    For the youngest beginners (age 8+) in open source, there is the popular programming language Scratch.
    Scratch is a programming language and an online community where children can program and share interactive media such as stories, games, and animation with people from all over the world. As children create with Scratch, they learn to think creatively, work collaboratively, and reason systematically.
    Scratch has a very user and kid-friendly interface. It teaches kids the very basics of programming. Scratch provides information for educators and parents, making it easy to adapt in classrooms or at home.
    CoderDojo Milano and Scratch
    Photo credits: Angelo Sala from CoderDojo Milano

    Get started with open source offline

    Local User Groups

    If you already have an interest for a specific open source programming language, or platform like Linux, local user groups are a great way to get introduced. These groups typically meet weekly to monthly. A great benefit of this offline approach is the ability to ask questions, share knowledge, and find guidance in what you are learning.
    A great example of this are the Linux User Groups (LUGs) and PHP User Groups. Other well known open source projects have user groups as well, like Drupal and MySQL.

    Hackerspaces and makerspaces

    A hackerspace, also known as hacklab or makerspace, is a community led workspace. It’s a place where people meet with a common interest, for example regarding computers, technology, or science.
    Hackerspaces can be a great way of discovering the use and development of open source and open hardware. Different from a local user group, a hackerspace can be about more than one topic or interest. This provides a beginner in open source with the opportunity to explore several open source software or hardware projects, and thus, to find out where his or her interest lies.
    Hackerspaces are easy to find, just search the Internet and you will most likely find one close to home that you can visit. Some hackerspaces run a website with a list of projects. This is a good way to search for something that you are interested in. To give you an idea, this is the project list for a hackerspace in Amsterdam (Netherlands).

    Coderdojos

    Exploring Coderdojos was inspired by two of my previously published interviews with Lune van Ewijk (Digital Girl 2013) and Julie Cullen (Ambassador for Ireland during Europe Code Week 2013).
    CoderDojo: The open source, volunteer led, global movement of free coding clubs for young people.
    CoderDojo is a non-profit global movement and was founded in 2011 by James Whelton and Bill Liao. Because CoderDojos are open source by nature, every Dojo is different and autonomous. Young people between the ages of 7 and 17 meet at Dojos to learn how to program apps, games, software, and more. In the true spirit of the open source way, CoderDojos are set up, run, and taught at by volunteers.
    CoderDojo Milano Lego Robot
    Photo credits: Angelo Sala from CoderDojo Milano
    Note: Read more about how CoderDojos are about more than just coding in my interview with Lune van Ewijk. You'll find they can also be about robotics, playing with open source hardware like Arduino or Raspberry Pi boards, and learning the skill of soldering.

    Online versus offline

    Where the online options give you lots of opportunities to learn the beginnings in open source programming languages, it’s the offline opportunities that really introduce beginners to all the open source projects that are out there.
    Young beginners especially off to a great start if they try Scratch or visit a local CoderDojo or hackerspace.
    Youth recommendations:
    • Age 6-8 and up: Code.org beginner tutorials, Scratch, Coderdojos
    • Middle school: Javascript and Python, hackerspace, user groups
    • High school: Apps for iOS, hackerspace, user groups

    How to spoof the MAC address of a network interface on Linux

    $
    0
    0
    http://xmodulo.com/2014/02/spoof-mac-address-network-interface-linux.html

    A 48-bit MAC address (e.g., 08:4f:b5:05:56:a0) is a globally unique identifier associated with a physical network interface, which is assigned by a manufacturer of the corresponding network interface card. Higher 24 bits in a MAC address (also known as OUI or "Organizationally Unique Identifier") uniquely identify the organization which has issued the MAC address, so that there is no conflict among all existing MAC addresses.
    While a MAC address is a manufacturer-assigned hardware address, it can actually be modified by a user. This practice is often called "MAC address spoofing." In this tutorial, I am going to show how to spoof the MAC address of a network interface on Linux.

    Why Spoof a MAC Address?

    There could be several technical reasons you may want to change a MAC address. Some ISPs authenticate a subscriber's Internet connection via the MAC address of their home router. Suppose your router is just broken in such a scenario. While your ISP re-establishes your Internet access with a new router, you could temporarily restore the Internet access by changing the MAC address of your computer to that of the broken router.
    Many DHCP servers lease IP addresses based on MAC addresses. Suppose for any reason you need to get a different IP address via DHCP than the current one you have. Then you could spoof your MAC address to get a new IP address via DHCP, instead of waiting for the current DHCP lease to expire who knows when.
    Technical reasons aside, there are also legitimate privacy and security reasons why you wish to hide your real MAC address. Unlike your layer-3 IP address which can change depending on the networks you are connected to, your MAC address can uniquely identify you wherever you go. Call me a paranoid, but you know what this means to your privacy. There is also an exploit known as piggybacking, where a hacker snoops on your MAC address on a public WiFi network, and attempts to impersonate you using your MAC address while you are away.

    How to Spoof a MAC Address Temporarily

    On Linux, you can switch MAC addresses temporarily at run time. In this case, the changed MAC address will revert to the original when you reboot. Note that you will lose your network connection momentarily during MAC address transition. On Linux, there are several easy ways to change a MAC address at run time.

    Method One: iproute2

    $ sudo ip link set dev eth0 down
    $ sudo ip link set dev eth0 address 00:00:00:00:00:01
    $ sudo ip link set dev eth0 up

    Method Two: macchanger

    A command-line utility called macchanger allows you to change MAC addresses from known vendor list.
    To install macchanger on Debian, Ubuntu or Linux Mint:
    $ sudo apt-get install macchanger
    To install macchanger on Fedora:
    $ sudo yum install macchanger
    To install macchanger on CentOS or RHEL:
    $ wget http://ftp.club.cc.cmu.edu/pub/gnu/macchanger/macchanger-1.6.0.tar.gz
    $ tar xvfvz macchanger-1.6.0.tar.gz
    $ cd macchanger-1.6.0
    $ ./configure
    $ make
    $ sudo make install
    The following examples are some of advanced usages of macchanger. With macchanger, you no longer have to deactivate/reactivate a network interface manually.
    To spoof a MAC address to a different value:
    $ sudo macchanger --mac=00:00:00:00:00:01 eth0
    To spoof a MAC address to a random value while preserving the same OUI:
    $ sudo macchanger -e eth0
    To spoof a MAC address to a completely random value:
    $ sudo macchanger -r eth0
    To get all MAC address OUIs associated with a particular vendor (e.g., Juniper):
    $ macchanger -l | grep -i juniper

    To show the original permanent and spoofed MAC addresses:
    $ macchanger -s eth0
    Current MAC:   56:95:ac:ee:6e:77 (unknown)
    Permanent MAC: 00:0c:29:97:68:02 (Vmware, Inc.)

    How to Spoof a MAC Address Permanently

    If you want to spoof your MAC address permanently across reboots, you can specify the spoofed MAC address in interface configuration files. For example, if you want to change the MAC address of eth0, do the following.

    On Fedora, CentOS or RHEL:

    $ sudo vi /etc/sysconfig/network-scripts/ifcfg-eth0
    DEVICE=eth0
    MACADDR=00:00:00:00:00:01
    Alternatively, you can create a custom startup script in /etc/NetworkManager/dispatcher.d as follows, especially if you are using Network Manager. I assume that you already installed macchanger.
    $ sudo vi /etc/NetworkManager/dispatcher.d/000-changemac
    1
    2
    3
    4
    5
    6
    7
    #!/bin/bash
     
    case"$2"in
        up)
            macchanger --mac=00:00:00:00:00:01 "$1"
            ;;
    esac
    $ sudo chmod 755 /etc/NetworkManager/dispatcher.d/000-changemac

    On Debian, Ubuntu or Linux Mint:

    Create a custom startup script in /etc/network/if-up.d/ as follows.
    $ sudo vi /etc/network/if-up.d/changemac
    1
    2
    3
    4
    5
    #!/bin/sh
     
    if[ "$IFACE"= eth0 ]; then
      ip link setdev "$IFACE"address 00:00:00:00:00:01
    fi
    $ sudo chmod 755 /etc/network/if-up.d/changemac
    Viewing all 1407 articles
    Browse latest View live


    <script src="https://jsc.adskeeper.com/r/s/rssing.com.1596347.js" async> </script>