There are a lot of people around the world that would like to bypass firewalls set up by their governments, but not everybody can afford to do it. Enter Daiyuu Nobori, a student from Tsukuba University in Japan who a couple days ago set up and new - and free - VPN service that can be used by everybody and anybody.
Based on the SoftEther open-source VPN freeware, which is designed to run on Windows, Linux, Mac, FreeBSD and Solaris, the VPN Gate service relies on volunteers around the world to download the server software and set up Public VPN Relay Servers for others to use.
"A volunteer is a person who owns a computer which is keeping the broadband connection to the Internet. He is a person who agrees to provide the CPU time and bandwidth to support the VPN Gate Academic Experiment," it is explained. Anyone who can satisfy those requirements can become a volunteer, and that's why these VPN servers hosted on different ISPs around the world, on different IP address ranges.
A continually refreshed list of available servers is provided on the service's website. Users can also find them via the VPN client software that can also be downloaded from the official website.
The service allows users to bypass your government firewalls to browse oversea web sites, to camouflage their IP address to hide the source of information sent over the Internet, and to protect their use of Wi-Fi with strong encryption in order to avoid packet capture and analysis.
The website is available in Japanese, English and Chinese, and judging by the connection logs of all VPN Gate Public VPN Servers, Chinese users are currently most numerous, but not the only ones. Users from other countries that are well-known for censuring political content are also well represented, and even those from Western democracies are finding it useful.
The number of available public servers to connect to fluctuates, as I write this there are 103.
According to Computerworld, the service has attracted over 75,000 users in less than a week, and the number is sure to rise.
Nobori says that his motive for creating this service was his wish to help people around the world beat government censorship of the Internet.
"If people somewhere want to study and can't use services like Wikipedia or Google, this is a big problem. Wikipedia has political articles, but also articles about science and other topics," he says.
Many of us grew up with LOGO, the kid-friendly programming language that guided a little turtle around a screen. Yes, it was simplistic. Yes, it taught only the very basics of programming concepts, but it also inspired an entire generation of programmers. The applications you run every day were written by people who steered a digital turtle around a screen in third grade. Alice is a project from Carnegie Mellon University that allows new programmers to use a drag-and-drop interface to create 3-D scenes and perform programmatic results without typing any code. The Alice Project has evolved through the years, and it's currently on version 3. The code is freely downloadable and is available for Linux, Mac and Windows. (Image from http://www.alice.org) Although the LOGO programming language allowed for some lengthy instructions for the turtle, it was limited. Alice, on the other hand, uses the animation environment to teach amazingly complex programming concepts. By utilizing an environment where syntax is dragged as opposed to typed, it takes "typos" out of the equation. It's hard to describe just how complex the programming can be with Alice, so I urge you to download it or at least visit the Alice Project at http://www.alice.org. For doing its part in producing the next generation of programmers, while (at least in my mind) continuing the legacy of a small digital turtle from my youth, Alice gets this month's Editors' Choice Award.
Summary: Adobe's shift to subscription-based cloud distribution for its flagship creative applications has left its customers with a dilemma: pay a hefty monthly/yearly subscription; carry on as long as possible with the last non-subscription version; switch to Premiere Elements; or abandon Adobe altogether. We examine some of the open-source alternatives to Premiere Pro CC.
By Terry Relph-Knight |
Video editing applications are relatively complex, high-performance products that address a three-tier market: consumers making simple home movies; more serious amateur film-makers; and professional editing for TV and cinema. Historically (as is perhaps illustrated by Adobe's recent repositioning of Premiere Pro CC towards the professional media market), video NLE developers have often struggled to decide which of those three market segments to address (and on which platforms). Many users now expect a basic home movie application such as Windows Movie Maker or Apple iMovie to be free — or at least very low cost. Commercial developers must choose whether to aim at the mass-market general user with a lower-cost product, or focus on the smaller professional market where much higher prices can be charged, but expectations are very high. For developers of FOSS video NLE (Non Linear Editing) software, the choice is arguably determined by available development resources. Projects tend to start off with a basic function editor, with the aspiration of creating a more capable product as the release cycle progresses. The recent and rapid growth in the development of higher-quality, higher-resolution digital imaging technologies — new camera file formats, 2K, 4K and even 8K resolutions and stereoscopic 3D — adds further complications to the development of video NLE software that's in tune with current needs, particularly in the professional market. Commercial developers, such as Adobe and Apple are (just about) able to keep up with these developments, but charge a correspondingly high price for their top-end products. The longest running FOSS projects that have managed to attract a larger number of developers offer the most mature and well-rounded applications, but generally are struggling to keep up on features and often have unsophisticated, dated-looking user interfaces. Since 2001 there have been over 35 open-source video NLE projects, either started or restarted. Building a full-featured video NLE is no small thing, ideally requiring a large and well-organised development team, and many of these projects have struggled, merged with other projects or eventually fallen into limbo. Something to be aware of when exploring FOSS video NLEs is that the versions available from the repositories of many Linux distributions are often early versions, or the latest stable version may lag way behind the development alphas and betas. The Software Centre for Ubuntu 13.10, for example, still offers version 0.15.2 of Pitivi. To see the latest UI and feature set it's necessary, where possible, to install the latest version from a project's own website.
NLE user interface design
It is quite a challenge to design an attractive, efficient user interface for a video NLE that also presents the user controls and menu options so that they're unobtrusive and yet easily found when needed. Because of the effect of simultaneous contrast, areas of saturated colour in the user interface of any image manipulation application can affect perception of colours within the image that's being manipulated. The theoretical ideal for any imaging application is to use a muted neutral colour palette for the elements of the user interface. In practice, this limits the design of the ideal user interface for image manipulation applications to different shades of dark grey, with small areas of saturated spot colour used to highlight status and control elements. Not long ago Adobe overhauled its flagship imaging products along these lines, using a dark charcoal palette used for the bulk of the interface. Even a white to pale-grey palette, as used by many of the FOSS video NLEs, can skew contrast perception. A typical video NLE user interface layout. Image: Terry Relph-Knight/ZDNetApart from the palette, the elements of a video NLE UI are largely determined by the requirements of the editing task and therefore there is further similarity between video NLEs. The common elements are: a project area containing the clips to be used in an edit, perhaps organised in storyboard order; clip and edit viewers; a timeline where the edit is assembled; and control panels for edit tools and video and audio effects. An elegant and usable UI, a wide range of input and output formats/codecs, and smooth playback and editing — even at high resolutions — are all qualities that make a video NLE stand out from the crowd.
Kino
Kino is notable as one of the best-known and earliest of open-source video NLEs. Begun in 2001 and not actively maintained since 2009, the Kino project produced a quite capable video editor. Kino (last version 1.3.4) can still be useful for general editing and for testing and debugging FireWire capture. Kino is storyboard-oriented with clips organised in storyboard order in the panel on the left of the display. Clicking the timeline button on the left does not display a conventional timeline, but rather sequential frames from the selected clip. This is useful for seeking to a particular frame by left-clicking on the chosen frame. Kino then reverts to edit mode at the point of that frame in the clip. Kino in edit view. Image: Terry Relph-Knight/ZDNetAlthough frequently discussed on the user forum, Kino development never reached the point of audio track or waveform display. Kino is DV-based with support for AVI (type 1 & 2) or DV raw and runs only on Linux. QuickTime support is an option.
Kdenlive
Begun shortly after Kino, in 2002, Kdenlive is a mature and still-active video NLE project with a strong developer community. However, like many FOSS projects with relatively complex user interfaces, its UI presentation could be better. Although it's intended for the K Desktop Environment (KDE), Kdenlive will run on other desktops, including Ubuntu Unity. The current version is 0.96 with good support on the project's website for getting that version installed. Kdenlive runs on Linux distributions, FreeBSD, NetBSD and Mac OS X. By default when running on the Ubuntu Unity desktop environment, Kdenlive presents a pale UI palette biased towards white. Image: Terry Relph-Knight/ZDNetKdenlive supports import of AVI DV, MPEG2, MPEG4, AVCHD, HDV, XDCAM-HD streams, IMX (D10) streams, DVCAM (D10), DVCAM, DVCPRO, DVCPRO50 streams and DnxHD. Exports can be to DV (PAL and NTSC), MPEG2 (PAL, NTSC and HDV) and AVCHD (HDV) and high-quality H264. The Kdenlive Render (export) control panel. Image: Terry Relph-Knight/ZDNetKdenlive has a very large range of video and audio effects, including reverb and delay. A more in-depth explanation of its features can be found on the project's website.
Blender
Although it's not strictly speaking a video editor, Blender, a 3D animation suite, is one of the rockstars of FOSS. After twenty years of development and now at version 2.69, Blender is a professional-level application that has been used to create many animated movies, and also to add animated titles (the OpenShot video NLE links to Blender for the creation of animated titles) and special effects to live motion. It also happens to include a quite sophisticated video NLE. The video editor is, of course, biased towards the needs of animation and the integration of animation into live motion, so it does not present an immediately familiar feel to those used to the more mainstream applicactions. Blender supports the following movie formats: AVI (Windows, JPEG and RAW), Frame Server, H.264, MPEG, Ogg Theora, QuickTime and Xvid. In Blender the Video Editing mode is selected via the Mode menu. Image: Terry Relph-Knight/ZDNetBlender's video editor. Image: Terry Relph-Knight/ZDNetBlender uses a neutral dark-grey palette, with small colour highlights to minimise colour and contrast bias, but there is a steep learning curve in navigating its complex UI. Audio waveforms can be displayed, but audio effects are limited to basic level controls. Blender is fairly comprehensively cross platform and runs on Windows, Mac OS X and Linux.
Cinelerra
Started in 2003, Cinelerra is somewhat schizophrenic as it's developed both as the offical Cinelerra, a closed development sometimes referred to as Cinelerra HV (now at version 4.5), and as the collaborative community version, Cinelerra CV (now at 2.2). In 2008 a rewrite of Cinelerra CV eventually forked into the Lumiera project, which appears to be still active. Cinelerra CV 2.2 running on Ubuntu 12.10 LTS. The individual windows of Cinelerra have been resized to fill most of the visual field, but the Ubuntu desktop is still visible in the background. Image: Terry Relph-Knight/ZDNetRather than the generally white default backgrounds adopted by both Kdenlive and OpenShot, Cinelerra does at least adopt a less intrusive charcoal palette for its UI. But there are still splashes of quite eye-catching bright colour, and the overall appearance is a little crude. Once launched, Cinelerra does not claim the entire desktop, but presents in the foreground as a number of floating windows. Cinelerra runs only on various Linux distributions and is resolution- and frame-rate-independent, so theoretically it can support video of any speed and size. Only a limited range of video file formats are currently supported however, not including MTS.
Pitivi
The Pitivi project, begun in 2004 and originally known as PiTiVi, is teasing expectations with the promise of the full release of version 1.0, although there's no sign of an ETA. Pitivi is currently at 0.92, a alpha development version. A screenshot of Pitivi 0.91 from the Pitivi website. Despite some effort, we were unable to install anything other than Pitivi 0.15.2, which looks very different.The only stable release version of Pitivi available in the Ubuntu Software Center is version 0.15.2 and this really does not give a good idea of where the Pitivi project is going. Unfortunately installing the alpha of Pitivi 0.92 on Ubuntu 13.10, for example, is a bit of a performance. There are instructions on how to go about this on PauLoX.net. Pitivi is developed in Python and in late 2013 the developers completed a major rewrite to shift the architecture onto the GES (GStreamer Editing Services) cross-platform library, so it now has a strong foundation. Unfortunately, judging by the current state of the project, Pitivi is not suitable for general use just yet. The Pitivi developers recently announced a fund raiser to help drive the project towards a 1.0 release, and it's certainly worth watching for future developments.
OpenShot
OpenShot is a relative newcomer, the project starting in 2008. Following a Kickstarter campaign in July 2013, Jonathan Thomas — the main and at the time practically the sole developer — posted a blog entry about adding distributed editing to OpenShot and talked about a new look and new features for OpenShot 2.0, with a release date of January 2014. However, following a blog post in October 2013, which mentioned problems with workload and difficulties in hiring staff, the project seemed to falter. Then in January 2014 several new blog posts revealed the recruitment of two new developers and indicated that an alpha of OpenShot 2.0 might be available around the end of February (this has not yet appeared). OpenShot 2.0 is being developed as a cross-platform application to run on Linux, Windows and Mac OS X. The OpenShot desktop for the current stable version 1.4.3. Image: Terry Relph-Knight/ZDNetAs it stands, OpenShot has all the basic elements in place and is a usable editor for straightforward video projects. It has a simple built-in titler and also links to Blender, which can create extremely complex animated titles (if you can handle its equally complex UI). Audio waveforms are not displayed in the current version, and so cannot be used as a visual cue for synchronising video clips. Also, only a small number of rudimentary audio effects are supported.
EditShare Lightworks and Lightworks Pro
Lightworks started life in 1989 as a video NLE designed by a group of film editors — Paul Bamborough, Nick Pollock and Neil Harris, the founders of a company called OLE Limited. It subsequently changed hands several times, and in 2009 was bought by EditShare, the current owners, along with Gee Broadcast's GeeVS video server system. Historically, Lightworks has built a strong reputation in the film-editing community and has been used on turnkey systems, with its associated Lightworks control console hardware, to edit a number of well known, big-box-office movies. EditShare's main business is in workflow software, media storage and media management, but recently the company has been developing and promoting Lightworks for general release. Lightworks and Lightworks Pro are currently available as a full release (11.5) for Windows and Linux. EditShare also demonstrated a pre-release alpha of 11.1 running on Mac OS X at the NAB in April 2013, and an OS X beta may appear sometime this year. EditShare has committed to releasing the Lightworks code as open source, but has been criticised for not doing so right away. The company maintains that it needs to audit the code it inherited to identify and remove any proprietary components before a full open-source release. Many video codecs, for example, are proprietary. The Lightworks Pro 11.5 for Linux desktop. Image: Terry Relph-Knight/ZDNetAn unusual feature of Lightworks is that it has no Save command. Each change is recorded as it's made and a closed edit will simply resume at the point it was when closed. Undo and Redo allow moving back and forth through the history record. Lightworks is resolution-independent and supports up to 5K file formats for realtime editing and up to 2K in realtime output monitoring without any additional hardware. The only audio effects currently available are cross-fade and EQ. A table detailing the differences between Lightworks and Lightworks Pro is available on the Lightworks website. Lightworks stereoscopic 3D settings in the Project settings menu. Image: Terry Relph-Knight/ZDNetLightworks export menu. Image: Terry Relph-Knight/ZDNet
Adobe Premiere Pro CC
In 2012 Adobe launched Creative Cloud, a subscription-based software distribution service with products available via direct download. In early 2013 Premiere users were expecting the release of Premiere Pro CS7 when, at its MAX conference in May, Adobe announced that future versions of the product, to be known as Premiere Pro CC, would only be available via Creative Cloud. Currently costing £17.58 per month, or £210.96 per year (inc. VAT), Premiere Pro CC is aimed squarely at the professional media market. Non-professional users were faced with either subscribing to Premiere Pro CC, moving to Adobe Premiere Elements 12 (£78.15 inc. VAT) or abandoning Adobe products altogether. For the more casual video editing software user, this certainly made FOSS alternatives look more attractive. The Adobe Premiere Pro CC workspace on Windows 7 64-bit. Image: Terry Relph-Knight/ZDNetTo say that Premiere Pro CC is feature rich is an understatement, and it's only possible to mention a fraction of its features in a comparative survey like this. From CS6 onwards, Adobe has used an efficient UI that maximises the space dedicated to the images being edited, along with a dark charcoal palette. Premiere Pro CC includes a quite comprehensive titler and provides a wide choice of video effects. There's also an extensive range of audio effects, and it's particularly easy to edit and add effects, including reverb, to audio tracks. Resolutions supported include 1K, 2K and 4K. Premiere integrates linking to After Effects CC for more complex special effects, to Photoshop CC for editing single frames, stills and titles, while colour grading is easily achieved though SpeedGrade CC (albeit at further cost for these additional applications). Adobe's Mercury Playback Engine ensures smooth playback on a modern PC, even at high resolution, without the need for preview file generation, and completed edits can be exported to a wide range of formats.
Conclusion
Adobe Premiere Pro CC (Windows 7/8/8.1 64-bit or Mac OS X 10.7/8/9 64-bit) sets a high benchmark. In the proprietary Windows/Mac OS X market, it competes with Apple's Final Cut Pro X (Mac OS X only, £199.99) , Sony Vegas (Windows Vista/7/8/8.1 64-bit £389.95) and possibly Avid Media Composer 7 (Windows 7/8, £862.80). If you must run Windows or Mac OS X, then, providing you're happy with Adobe's subscription model, Premiere Pro CC is a good choice of video NLE. For Mac OS X only, Apple's Final Cut Pro X is an excellent product. For Linux users, Lightworks is now perhaps the best video NLE (based on the latest 11.5 version) and it also runs on Windows, with a Mac OS X version promised. However it's not yet FOSS, and to gain the use of the widest range of codecs and the built-in titler, users must pay a yearly subscription of £40 for Lightworks Pro (some of which covers the cost of licensing proprietary codecs). If you only need a usable, fairly basic Linux video NLE, then OpenShot 1.4.3 is worth considering. OpenShot 2.0 may be released in the first quarter of 2014 as a cross-platform application (Linux/Windows/Mac OS X) and should be a significant advance on the current (Linux-only) 1.4.3 version. As for the rest of the 'Linux' NLEs, Kdenlive has a good feature set and track record, with a healthy development community; Pitivi looks promising; and Cinelerra is a capable editor, although its slightly clunky graphics, floating windows and idiosyncratic operation count against it. Finally, Blender is a fantastic application for 3D animation and special effects, is cross platform and, once you learn how to use it, includes a pretty good video NLE.
Unix systems administrators tend to be very serious about their responsibilities -- except when they're not. And, when they're not, the pranks that they play on each other and some of their more annoying users might surprise you.
Unix systems administrators don't always have the nicest reputations. They are often thought to be arrogant, poor communicators with a healthy disdain for anyone who can't find his way around the command line. And, while they manage to keep their flocks of users productive, they are known to sometimes play tricks on their users and on each other.
What does it takes to be a good Unix prankster? Knowing the subtleties of many commands and options that others may not be aware of and, sometimes, just doing things that other Unix users would not expect. One of the pranks that has been around for a long time and people still fall for (not restricted to Unix, by the way) is to create a wallpaper that looks like a normal desktop, hide all of the actual icons, and leave the system's user to click himself into frustration, wondering why his GUI has suddenly become unresponsive. Another is to remotely log into another person's desktop and play sound files. Years ago, just typing echo ^G (hold the control key and press "g") on someone's system would cause a bell to ring on the system. An unwary user might spend quite some time wondering why her system was going "Ding!". In fact, I remember doing something like this to a boss of mine more than twenty years ago. I don't think he ever figured out why this was happening and was too proud, or something, to ask. For the particularly naive Unix users, you can log into their systems or select their login session on one of your servers and send messages to their terminal sessions containing discrete or not-so-discrete messages.
echo "your account is invalid"> /dev/pts/0
echo "go home already"> /dev/pts/2
Use the who command to identify users and their pseudo-terminals.
$ who
jdoe     pts/0        2014-03-09 16:19 (10.3.2.98)
mary     pts/1        2014-03-09 14:10 (10.3.2.123
Another prank a friend told me about involved ejecting more than a dozen CDs in quick succession when a coworker was doing some work in the server room. This individual hadn't realized anyone was still working nearby and freaked out for a while wondering what was causing this super odd problem. For those of us who take issue with people who walk away from their desks without running a lockscreen (a serious security issue for most of us), we might enter ^S (hold the control key and press "s") in their terminal window. When the user returns, he no longer gets a response in the terminal window. In fact, nothing will happen no matter what he types. It's not until you come around and type a ^S that the terminal will come back to life and, if you do this just right, he might miss seeing your key press and maybe you can scrunch up your face and tell him with as much seriousness as you can muster that you can't find anything wrong. That might leave him wondering for days what happened and why it only happened to him. Want to scare someone into thinking his system is really in trouble? Add an alias like this in her .bashrc file (assuming bash is her shell). Oops! An unsuspecting user might think her system is completely hosed. Even another admin might call you over to ask "Hey, Joe, have you ever seen something like this?". You then try to keep a straight face while you run through all the possible but thoroughly unlikely theories that you can devise.
alias ls='echo "Segmentation fault"'
Add this command and the one shown below to your victim's .bashrc file and everything she types will cause a "segmentation fault" message to appear. Why? Because the contents of the PROMPT_COMMAND variable are executed as a regular bash command just before bash displays the user's prompt.
export PROMPT_COMMAND="ls"
You can use commands like these to add these lines to John Doe's .bashrc file:
cat<> ~jdoe/.bashrc
alias cd='echo "Segmentation fault"'
export PROMPT_COMMAND="cd"'
EOF
While not exactly a prank, the extent to which Unix geeks will go to entertain themselves and others is demonstrated by a Star Wars production -- all done in "ASCII art" and available at the URL shown below -- quite well done and wonderfully funny.
telnet towel.blinkenlights.nl
Speaking of ASCII art, one Unix geek got so fed up with users typing "sl" when they meant "ls" that he put a program together that displays a train that moves across the screen. The "sl" is meant to stand for "steam locomotive" and you can find out more about this at http://www.tkl.iis.u-tokyo.ac.jp/~toyoda/index_e.html.
Another option for harassing those annoying users who can't properly type two letters in a row -- just "ls"! -- and get it right is to alias their "sl" command to something more appropriate like this.
alias sl="ls | rev"
Do that and they'll get their file listing, but all of their file names will be displayed backwards! Serves them right, don't you think? Other prankster sysadmins go as far as to make unexpected changes to the /etc/hosts file on their users' systems. Imagine what happens when you tell a system that www.google.com refers to the loopback!
You can also cause a lot of trauma by aliasing the command to invoke someone's favorite editor to one that they never use and likely don't know. When someone with this alias in their .bashrc file tries to use vi and ends up using ed, they will likely be completely at a loss for how to set things right.
alias vi='ed'
You can also alias other commands to each other. Alias pwd to cd or who to logout. The command below will change a user's prompt to look like a DOS prompt, complete with the C: preface. If your users spend time on both Unix and Windows systems, they might not notice right away! But expect that "Hey, wait a minute!" response once this sinks in.
export PS1='C:${PWD////\\\\}> '
I don't live in a cubicle jungle anymore, but I've heard this trick has thrown a few people off balance. Carefully swap the mice in two adjacent cubicles and watch the people trying to figure out was is happening and then maybe notice that they're both having some very unusual problems navigating around their screens. Confusing your fellow admins or your more troublesome users can be a lot of fun -- if they don't break anything important while they're trying to figure out what happened! And, please, don't tell them that I suggested it! But, if you've played tricks like these on your Unix cohorts or been tricked yourself, please share some of your stories!
I am a new Linux and Unix user. How do I change the root directory of a command? How do I change the root directory of a process such as web-server using a chroot command to isolate file system? How do I use a chroot to recover password or fix the damaged Linux/Unix based environment?
Each process/command on Linux and Unix-like system has current working directory called root directory of a process/command. You can change the root directory of a command using chroot command, which ends up changing the root directory for both current running process and its children.
A process/command that is run in such a modified environment cannot access files outside the root directory. This modified environment is commonly known as "jailed directory" or "chroot jail". Only a privileged process and root user can use chroot command. This is useful to:
Privilege separation for unprivileged process such as Web-server or DNS server.
Setting up a test environment.
Run old programs or ABI in-compatibility programs without crashing application or system.
System recovery.
Reinstall the bootloader such as Grub or Lilo.
Password recovery - Reset a forgotten password and more.
Purpose
The chroot command changes its current and root directories to the provided directory and then run command, if supplied, or an interactive copy of the user's login shell. Please note that not every application can be chrooted.
Syntax
The basic syntax is as follows: chroot /path/to/new/root command OR chroot /path/to/new/root /path/to/server OR chroot [options] /path/to/new/root /path/to/server
chroot command examples
In this example, build a mini-jail for testing purpose with bash and ls command only. First, set jail location using mkdir command: $ J=$HOME/jail Create directories inside $J: $ mkdir -p $J $ mkdir -p $J/{bin,lib64,lib} $ cd $J Copy /bin/bash and /bin/ls into $J/bin/ location using cp command: $ cp -v /bin/{bash,ls} $J/bin Copy required libs in $J. Use ldd command to print shared library dependencies for bash: $ ldd /bin/bash Sample outputs:
Finally, chroot into your new jail: $ sudo chroot $J /bin/bash Try browsing /etc or /var: # ls / # ls /etc/ # ls /var/ A chrooted bash and ls application is locked into a particular directory called $HOME/$J and unable to wander around the rest of the directory tree, and sees that directory as its "/" (root) directory. This is a tremendous boost to security if configured properly. I usually lock down the following applications using the same techniques:
The PID 8613 pointing out to / (root) i.e. the root directory for application is not changed or chrooted. This is a quick and dirty way to find out if application is chrooted or not without opening configuration files. Here is another example from chrooted nginx server:
## Recover data, at live cd prompt type the following commands. ##
## /dev/sda1 main system partition ##
## /dev/md0 /data partition  ##
# Set jail dir
d=/chroot
mkdir$d

# Mount sda1 and required dirs
mount /dev/sda1 $d
mount -o bind /dev $d/dev
mount -o bind /sys $d/sys
mount -o bind /dev/shm $d/dev/shm
mount -o bind /proc $d/proc

# Mount software raid /dev/md0
mount /dev/md0 $d/data

# Chroot to our newly created jail. This allows us to fix bootloader or grab data before everything goes to /dev/null
chroot$d

# Can you see?
ls
df

# Get files to safe location
rsync -avr /path/to/my_precious_data_dir user@safe.location.cyberciti.biz:/path/to/dest

# Get out of chrooted jail and reboot or format the server as per your needs ;)
exit
umount{dev,sys,[...],}
reboot
But wait, there's more!
See all other chroot command related examples on nixCraft:
A note about chrooting apps on a Linux or Unix-like systems
Should you use the chroot feature all the time? In the above example, the program is fairly simple but you may end up with several different kinds of problems such as:
App running in jail can not run any other programs, can not alter any files, and can not assume another user's identity. Loosen these restrictions, you have lessened your security, chroot or no chroot.
Also note that:
Do not forgot, to updated chrooted apps when you upgrade apps locally.
Not every app can or should be chrooted.
Any app which has to assume root privileges to operate is pointless to attempt to chroot, as root can generally escape a chroot.
  --userspec=USER:GROUP  specify user and group (ID or name) to use
  --groups=G_LIST        specify supplementary groups as g1,g2,..,gN
      --help     display this help and exit
      --version  output version information and exit
In this roundup of Linux network testing utilities we use Bandwidthd, Speedometer, Nethogs, Darkstat, and iperf to track bandwidth usage, speed, find network hogs, and test performance.
Bandwidthd
Bandwidthd is a funny little app that hasn't been updated since 2005, but (at least on my Kubuntu system) it still works. It makes nice colorful graphs of your incoming and outgoing bandwidth usage, and tallies it up by day, week, month, and year on a Web page. So you also need Apache, or some other HTTP server. You can monitor a single PC, or everyone on your LAN. This is a nice app for tracking your monthly usage if you need to worry about bandwidth caps.
Figure 1: Pretty Bandwidthd graphs.
Bandwidthd has almost no documentation. man bandwidthd lists all of its configuration files and directories. Its Sourceforge page is even sparser. There are two versions: bandwidthd and bandwidthd-pgsql. bandwidthd generates static HTML pages every 150 seconds, and bandwidthd-pgsql displays graphs and data on dynamic PHP pages. The Web page says "The visual output of both is similar, but the database driven system allows for searching, filtering, multiple sensors and custom reports." I suppose if you want to search, filter, do multiple sensors, or create custom reports you'll have to hack PHP files. Installation on my system was easy, thanks to the Debian and Ubuntu package maintainers. It created the Apache configuration and set up PostgreSQL, and then all I had to do was open a Web browser to http://localhost/bandwidthd which is not documented anywhere, except in configuration files, so you heard it here first.
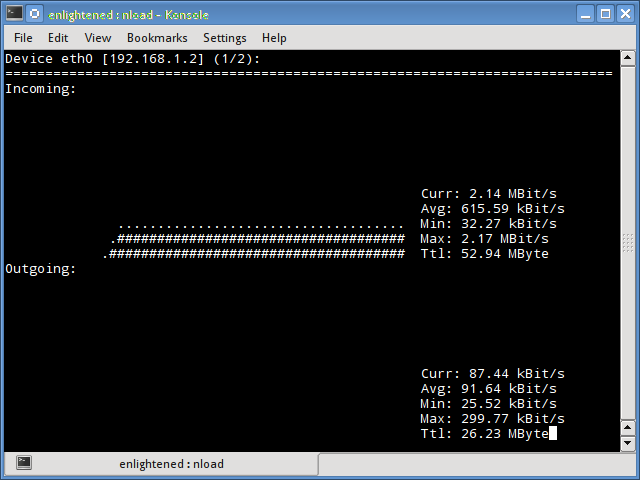
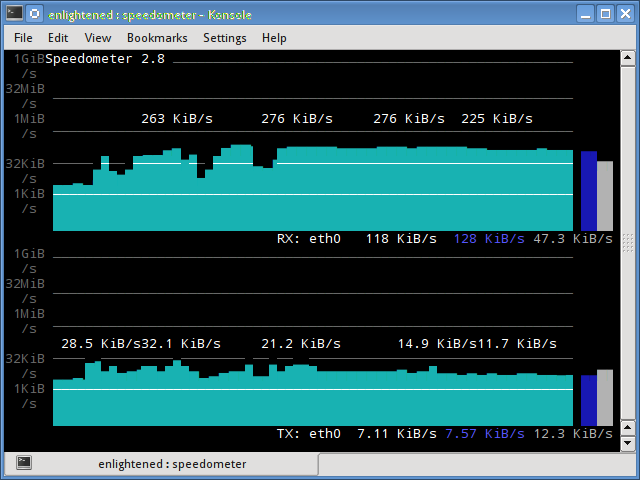
Speedometer
Speedometer displays real-time graphs on the console (so you don't need a Web server) of how fast data are moving across your network connection, and it also answers the question "How fast is my hard drive?" The simplest usage displays either received or transmitted bytes per second. This called a tap:
$ speedometer -r eth0
You can watch the flow both ways by creating two taps:
$ speedometer -r eth0 -t eth0
The default is to stack taps. The -c option makes nice columns instead, and -k 256 displays 256 colors instead of the default 16, as in figure 2.
$ speedometer -r eth0 -c -t eth0
Figure 2: Speedometer tracking incoming and outgoing traffic in 256 colors and columns.
You can measure your hard drive's raw write speed by using dd to create a 1-gigabyte raw file, and then use Speedometer to measure how long it takes to create it:
Change the count value to generate a different file size; for example count=2000 creates a 2GB file. You can also experiment with different block sizes (bs) to see if that makes a difference. Remember to delete the testfile when you're finished, unless you like having useless large files laying around.
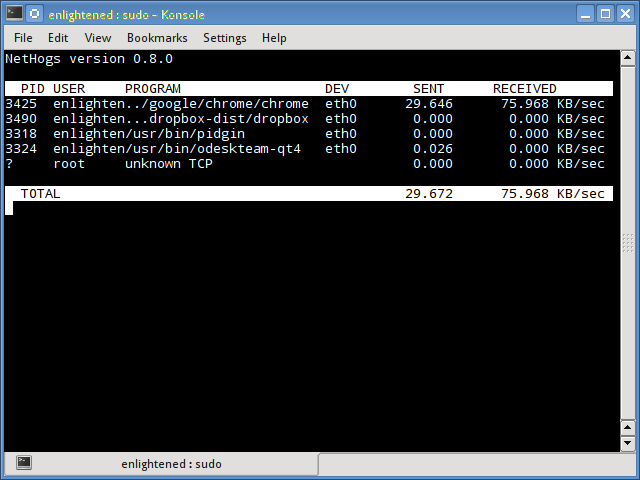
Nethogs
Nethogs is a simple console app that displays bandwidth per process, so you can quickly see who is hogging your network. The simplest invocation specifies your network interface, and then it displays both incoming and outgoing packets:
$ sudo nethogs eth0
NetHogs version 0.8.0
  PID USER     PROGRAM                DEV        SENT      RECEIVED
1703  carla    ssh                    eth0    9702.096     381.697 KB/sec
5734  www-data /usr/bin/fie           eth0       1.302      59.301 KB/sec
13113 carla    ..lib/firefox/firefox  eth0       0.021       0.023 KB/sec
2462  carla    ..oobar/lib/foobar  eth0       0.000       0.000 KB/sec
?     root     unknown TCP                       0.000       0.000 KB/sec
  TOTAL                                       9703.419     441.021 KB/sec
Use the -r option to show only received packets, and -s to see only sent packets.
Darkstat
Darkstat is another Web-based network monitor, but it includes its own embedded HTTP server so you don't need Apache. Start it up with the name of your network interface as the only option:
$ sudo darkstat -i eth0
Then open a Web browser to http://localhost:667, and you'll see something like figure 3.
Figure 3: Darkstat's default display.
Click the automatic reload button to make it update in real time. The Hosts tab shows who you're connected to, how long you've been connected, and how much traffic, in bytes, has passed between you. You can run Darkstat as a daemon and have it start at boot. How to do this depends on your Linux distribution, and what init system you are using (Upstart, systemd, sysvinit, BSD init). I shall leave it as your homework to figure this out.
iperf
Doubtless you fine readers have been wondering "What about iperf?" Well, here it is. iperf reports bandwidth, delay jitter, and datagram loss. In other words, it tests link quality, which is a big deal for streaming media such as music, videos, and video calls. You need to install iperf on both ends of the link you want to test, which in these examples are Studio and Uberpc. Then start iperf in server mode on one host, and run it in client mode on the other host. Note that on the client, you must name the server. This is the simplest way to run a test:
carla@studio:~$ iperf -s
------------------------------------------------------------
Server listening on TCP port 5001
TCP window size: 85.3 KByte (default)
------------------------------------------------------------
[  4] local 192.168.1.132 port 5001 connected with 192.168.1.182 port 32865
[ ID] Interval       Transfer     Bandwidth
[  4]  0.0-10.0 sec  1.09 GBytes   938 Mbits/sec
terry@uberpc:~$ iperf -c studio
------------------------------------------------------------
Client connecting to studio, TCP port 5001
TCP window size: 22.9 KByte (default)
------------------------------------------------------------
[  3] local 192.168.1.182 port 32865 connected with 192.168.1.132 port 5001
[ ID] Interval       Transfer     Bandwidth
[  3]  0.0-10.0 sec  1.09 GBytes   938 Mbits/sec
That's one-way, from server to client. You can test bi-directional performance from the client:
terry@uberpc:~$ iperf -c studio -d
------------------------------------------------------------
Server listening on TCP port 5001
TCP window size: 85.3 KByte (default)
------------------------------------------------------------
------------------------------------------------------------
Client connecting to studio, TCP port 5001
TCP window size: 54.8 KByte (default)
------------------------------------------------------------
[  5] local 192.168.1.182 port 32980 connected with 192.168.1.132 port 5001
[  4] local 192.168.1.182 port 5001 connected with 192.168.1.132 port 47130
[ ID] Interval       Transfer     Bandwidth
[  5]  0.0-10.0 sec  1020 MBytes   855 Mbits/sec
[  4]  0.0-10.0 sec  1.07 GBytes   920 Mbits/sec
Those are good speeds for gigabit Ethernet, close to the theoretical maximums, so this tells us that the physical network is in good shape. Real-life performance is going to be slower because of higher overhead than this simple test. Now let's look at delay jitter. Stop the server with Ctrl+c, and then restart it with iperf -su. On the client try:
$ iperf -c studio -ub 900m
-b 900m means run the test at 900 megabits per second, so you need to adjust this for your network, and to test different speeds. A good run looks like this:
[ ID] Interval       Transfer     Bandwidth        Jitter   Lost/Total Datagrams
[  3]  0.0-10.0 sec   958 MBytes   803 Mbits/sec   0.013 ms 1780/684936 (0.26%)
[  3]  0.0-10.0 sec  1 datagrams received out-of-order
0.013 ms jitter is about as clean as it gets. Anything over 1,000 ms is going to interfere with audio and video streaming. A datagram loss of 0.26% is also excellent. Higher losses contribute to higher latency as packets have to be re-sent. There is a new version of iperf, and that is iperf 3.0.1. Supposedly this is going to replace iperf2 someday. It has been rewritten from scratch so it's all spiffy clean and not crufty, and it includes a library version that can be used in other programs. It's still a baby so expect rough edges.
One of the most important tasks in Linux administration is to check the integrity of the filesystem. The Linux filesystem can be damaged under various circumstances, e.g., system crash, power loss, disconnected disk, accidentally overwritten i-node, etc. Thus it is a good idea to check the integrity of the filesystem regularly to minimize the risk of filesystem corruption. When it comes to checking and repairing Linux filesystem, fsck is a useful tool. In this tutorial, I am going to describe how to set up automatic filesystem checks with fsck tool.
Trigger Automatic Filesystem Check upon Boot
If you want to trigger fsck automatically upon boot, there are distro-specific ways to set up unattended fschk during boot time. On Debian, Ubuntu or Linux Mint, edit /etc/default/rcS as follows.
$ sudo vi /etc/default/rcS
# automatically repair filesystems with inconsistencies during boot
FSCKFIX=yes
On CentOS, edit /etc/sysconfig/autofsck (or create it if it doesn't exist) with the following content.
$ sudo vi /etc/sysconfig/autofsck
AUTOFSCK_DEF_CHECK=yes
Force Regular Filesystem Checks
If the filesystem is large, you can force filesystem checks on a regular basis, instead of every boot time. In order to do so, first find out the filesystem configuration with tune2fs command. The following command line shows the current values of filesystem related parameters. Note that /dev/sda1 is the partition where the filesystem superblock is located.
$ sudo tune2fs -l /dev/sda1
From tune2fs output, you can see not only the filesystem state (clean or not), but also parameters that are related to filesystem checks. "Maximum mount count" parameter is the number of mounts after which the filesystem check gets triggered. "Check interval" parameter shows the maximum time between two filesystem checks. On most Linux distros, these parameters are not set by default, meaning no regular filesystem checks are occurring. To force filesystem check for every 30 mounts, run the following command.
$ sudo tune2fs -c 30 /dev/sda1
To force filesystem check for every 3 months, use the command below.
$ sudo tune2fs -i 3m /dev/sda1
Now verify that newly added filesystem check conditions are set properly.
$ sudo tune2fs -l /dev/sda1
. . .
Last mount time:          n/a
Last write time:          Fri Mar 14 22:29:24 2014
Mount count:              20
Maximum mount count:      30
Last checked:             Mon Mar  3 20:55:08 2014
Check interval:           7776000 (3 months)
Next check after:         Sun Jun  1 21:55:08 2014
Force One-Time Filesystem Check on the Next Reboot
If you want to trigger one-time filesystem check on your next reboot, you can use this command.
$ sudo touch /forcefsck
Once you create an empty file named forcefsck in the top directory (/) like above, it will force filesystem check the next time you boot up. After successful booting, /forcefsck will automatically be removed.
Whether you love living in the cloud or still cling to your desktop applications whenever possible, it has become increasingly clear in recent years that the cloud is where computing is headed. And if you’re seeking to keep your skills relevant to the IT jobs of today, and tomorrow, understanding the technology that underlies cloud services is critical. Fortunately, the cloud offers many opportunities for using open source software up and down the stack. If being on the cutting edge of cloud infrastructure interests you, it’s probably time to take a look at OpenStack. OpenStack is the engine that makes scalable, rapid, and secure deployments of computing power, networking, and storage possible in a modern datacenter. And it’s open source technology, which means anyone can dive right in and get started. We’ve written before about the virtues of participating in the open source community as it relates to your career. Not only is the source right there for you to review and get started with, but an active user and developer community can help move you along. Plus, you can prove your worth to potential employers by getting your contributions accepted to a project in the OpenStack universe.
OpenStack job trends
Investing your time in learning OpenStack pays off. The rapid growth in cloud technology has created thousands of new jobs, and the OpenStack job market specifically has been among the top growth areas. Hosting giant Rackspace looked at the trend among job listings for competing cloud infrastructure projects a little over a year ago, and the graph is crystal clear: OpenStack outpaces other cloud infrastructure jobs considerably. But how have things fared in the eighteen months since? Well, just take a look. Since Rackspace conducted their survey and writeup, the OpenStack job market has doubled. Again. Many companies are creating OpenStack jobs faster than they can fill them, and new companies are coming into the fold all the time. As we reported last week, GoDaddy is just the latest big name to make the leap to OpenStack, and news of their involvement was first broken through, you guessed it, a job listing. And OpenStack is a great place for budding engineers to get started, regardless of their physical location. As a teaching tool and a path to a job, OpenStack is being used around the world, to match jobs that are globally located.
What's in it for me?
So why take the time to become familiar with OpenStack when there are hundreds of different technologies out there which might be of use to a cloud engineer? Among the many good answers is one that is hard to ignore: compensation. According to listings on Indeed.com, jobs related to OpenStack pay an a average of 36% more compared to cloud engineering jobs on other technologies. Taking an average of stated hiring ranges from across the United States, an OpenStack engineer can expect to make about US$133,000 a year, compared to $98,000 for non-OpenStack cloud engineers.
Getting started
Not sure where to start? We can help. First, check out this great collection of videos to understand where OpenStack fits into the picture of cloud technologies. Once you've got a handle on the basics, try it out! TryStack.org is a sandbox where you can fire up OpenStack and try it out with your existing apps. You can try it on your local machine with DevStack, a shell script to build OpenStack development environments so you can give it a whirl on your favorite distro. You can also take a look at the project documentation or watch some of the videos from the last OpenStack Summit in Hong Kong. Ready to check out the source code? It's all on GitHub so you can easily see how things work under the hood. OpenStack is written in Python, an easy-to-learn language that is rapidly growing in the enterprise community. Need some training? There are many options from the various companies backing OpenStack, some of whom also offer certification options, as well as vendor-neutral courses from the nonprofit Linux Foundation. And if you're interested in the development community behind OpenStack, there are plenty of ways to do that as well. With a large and knowledgable community backed by some of the biggest names in cloud technology, OpenStack is ready for you to get involved.
Ready for that job?
In addition to the usual suspects for finding IT jobs, the OpenStack foundation operates a job board with frequent updates of opportunities around the globe. Take a look at the broad range of specializations needed, and start working on that résumé.
The PostgreSQL relational database management system (RDBMS) offers powerful mechanisms for the automated handling of data inserts and manipulations. Expand the functionality of your system with the usage of triggers and custom-developed stored procedures. Stored procedures allow database engineers to enter code in a procedural language to create some functionality. The code can be executed directly or set to run when certain actions are triggered. Triggers are associated with tables, and can start before or after a specified event occurs. This means that once an operation such as INSERT, UPDATE, DELETE, or TRUNCATE is executed on the table, the trigger will run the corresponding procedure. While the usage of stored procedures requires the understanding of additional programming syntax, it can be of great advantage for application programmers. Instead of manipulating database records in an application's code, they can program some algorithms directly in the database layer. This improves the loading speed of the application and significantly decreases the volume of data transfer from the database to the script's engine and back. On the down side, testing stored procedures is more complicated, since quality assurance engineers need to separate and run their tests under two different programming paradigms – the application's source code and the programming language used in the database stored procedures. The default programming language for the PostgreSQL stored procedures is PL/pgSQL– SQL Procedural Language. PostgreSQL also has core support for TCL, Perl, and Python, and supports via external contributions PHP, Ruby, Java, and other popular languages. To work with stored procedures and triggers, start by installing the latest stable version of PostgreSQL, so you can be confident that all the known issues and bugs in previous releases are resolved. Pick the correct RPM package for your architecture from the PostgreSQL packages download page and run the following commands to install the PostgreSQL RDBMS packages on your CentOS server:
Next, initialize the PostgreSQL cluster and start the server:
service postgresql-9.3 initdb
Initializing database:                                     [  OK  ]
/etc/init.d/postgresql-9.3 start
Starting postgresql-9.3 service:                           [  OK  ]
Then load the PostgreSQL command-line interface, create a new database, a database user, and grant the necessarily privileges:
su postgres
bash-4.1$ psql
postgres=# CREATE DATABASE resort;
CREATE DATABASE
postgres=# CREATE USER manager WITH PASSWORD 'MyStr0ngP@ss';
CREATE ROLE
postgres=# GRANT ALL PRIVILEGES ON DATABASE resort TO manager;
GRANT
You will enter the database name, the database username, and the corresponding password in the connection string of your application's code. Now populate your new database with some sample data. For this test case run the queries as shown below:
postgres=# \c resort;
You are now connected to database "resort" as user "postgres".

CREATE TABLE employees(id SERIAL PRIMARY KEY NOT NULL, username VARCHAR (10) UNIQUE NOT NULL, name VARCHAR (100) NOT NULL, email VARCHAR (200) UNIQUE NOT NULL, position TEXT NOT NULL);
CREATE TABLE
INSERT INTO employees(username, name, email, position) VALUES ('john','johnd@mywinterrestort.com','John D.','General Manager'), ('steven','stevenm@mywinterrestort.com','Steven M.','Night Shift Supervisor'), ('teresa', 'teresaa@mywinterrestort.com','Teresa A.','Receptionist'), ('roger', 'rogerd@mywinterrestort.com','Roger D.','Receptionist');
INSERT 0 4

CREATE TABLE clients(id SERIAL PRIMARY KEY NOT NULL, name TEXT NOT NULL, number_of_guests INTEGER NOT NULL);
CREATE TABLE
INSERT INTO clients(name, number_of_guests) VALUES ('Ian A.','4'), ('Sonia M.','2'), ('Tony P.','1'), ('Lora S.','6');
INSERT 0 4

CREATE TABLE apartments(id SERIAL PRIMARY KEY NOT NULL, name TEXT NOT NULL, number_of_beds INTEGER NOT NULL);
CREATE TABLE
INSERT INTO apartments(name, number_of_beds) VALUES ('Regular 1','2'), ('Regular 2','2'), ('Luxury','4'), ('Ultra Luxury','6');
INSERT 0 4

CREATE TABLE reservations_statuses(id INTEGER PRIMARY KEY NOT NULL, status VARCHAR (10) UNIQUE NOT NULL);
CREATE TABLE
INSERT INTO reservations_statuses(id, status) VALUES ('1','Pending'), ('2','Cancelled'), ('3','Paid');
INSERT 0 3

CREATE TABLE reservations(id SERIAL PRIMARY KEY NOT NULL, employee_id INT REFERENCES employees NOT NULL, client_id INT REFERENCES clients NOT NULL, apartment_id INT REFERENCES apartments NOT NULL, created_on TIMESTAMP DEFAULT CURRENT_TIMESTAMP, date_of_arrival DATE NOT NULL, nights_to_stay INTEGER NOT NULL, status_id INT REFERENCES reservations_statuses DEFAULT '1');
CREATE TABLE
INSERT INTO reservations(employee_id, client_id, apartment_id, created_on, date_of_arrival, nights_to_stay) VALUES ('3','2','1','2014-03-12 10:03:54','2014-May-08','4'), ('3','1','3','2014-03-16 18:23:54','2014-May-28','2'), ('4','4','4','2014-03-22 06:23:54','2014-July-12','7');
INSERT 0 3

CREATE TABLE reservations_changes(id SERIAL PRIMARY KEY NOT NULL, employee_id INT REFERENCES employees NOT NULL,  reservation_id INT REFERENCES reservations NOT NULL, changed_on TIMESTAMP DEFAULT CURRENT_TIMESTAMP, old_arrival_date TIMESTAMP,  old_status_id INT REFERENCES reservations NOT NULL, old_period_length INT NOT NULL);
CREATE TABLE
Stored procedures syntax
Once you have prepared your database for the tests you can write a simple stored procedure that counts the number of the reservations in the corresponding table:
CREATE FUNCTION reservations_count()
RETURNS integer
AS
$function_body$
declare
rescount integer;
BEGIN
   SELECT COUNT(*) INTO rescount FROM reservations;
   RETURN rescount;
END;
$function_body$
LANGUAGE plpgsql;
CREATE FUNCTION does just what it says, or you can extend the command by including an option to alter an existing function with the syntax CREATE OR REPLACE FUNCTION. The command is followed by the function's name and the lists of the arguments, if you have any to define. Specify the type of data that your function is to return. The body of the procedure should be surrounded by dollar-quoted string delimiters, so that you do not have to escape single quote marks and backslashes in the function's body. On the next two lines, declare the variable which you are going to use in your function and define its type. The BEGIN and END; statements surround the code that is to be executed when your function is called. In our case it contains a SELECT SQL query that counts the number of rows from the reservations table and stores them in the rescount variable, which it returns as the result of the function's execution. Finally, specify the used procedural language. Upon successful creation of the stored procedure PostgreSQL will display the CREATE FUNCTION message at the command prompt. Now test the function:
Now let's switch gears and create a triggered procedure that logs the previous status of each reservation. We will set it to run on every update of a record in the reservations table:
CREATE FUNCTION reservations_log()
RETURNS trigger
AS
$$
declare
BEGIN
 INSERT INTO reservations_changes (employee_id, reservation_id, old_arrival_date, old_status_id, old_period_length)
 VALUES (OLD.employee_id, OLD.id, OLD.date_of_arrival, OLD.status_id, OLD.nights_to_stay);
 RAISE NOTICE 'Employee changed reservation #%', OLD.id;
 RETURN NEW;
END;
$$
LANGUAGE plpgsql;
This code creates a function without arguments. The returned type is trigger. There are no variables to be declared. The code inserts the old values of the row being updated into the reservations_changes table, as a way of logging the old records. The NEW data variable from the RECORD type stores the updated database row from the reservation table. The RAISE NOTICE command is a part of the PostgreSQL messages report system. Here it displays a message with the ID of the updated reservation's record at the command prompt. Next, create the trigger that is to be called automatically after each UPDATE query on the reservation table. This trigger will start the procedure developed above:
CREATE TRIGGER res_log
AFTER UPDATE ON reservations
FOR EACH ROW EXECUTE PROCEDURE reservations_log();
The creation of a trigger in PostgreSQL is confirmed by the CREATE TRIGGER message. You can test the functionality of your procedure and the trigger you have set:
UPDATE reservations SET date_of_arrival='2014-09-22' WHERE id='1'; NOTICE: Employee changed reservation #1 UPDATE 1
Web developers debate the benefit of stored procedures. On one hand, stored procedures can save you overhead on data transferred between the application you are programming and the database, and thereby improve performance. By using stored procedures you do not send unnecessary rows to your script and do not need to write logic to better handle the results. This might decrease the lines of the programming code you have to write, and you can use created procedures for different scripts. Also, stored procedures in PostgreSQL benefit from the database's high level of security. On the other hand, developing stored procedures for your project requires the usage of an unfamiliar programming solution. Programmers may need to learn new syntax, and this might slow down the development process. Stored procedures can make testing and debugging more complicated. Finally, stored procedures make it more difficult to port a function's code to a different database engine. Nevertheless, stored procedures and triggers are powerful tools for database programmers.
The cpu information includes details about the processor, like the architecture, vendor name, model, number of cores, speed of each core etc. There are quite a few commands on linux to get those details about the cpu hardware, and here is a brief about some of the commands.
1. /proc/cpuinfo
The /proc/cpuinfo file contains details about individual cpu cores. Output its contents with less or cat.
$ less /proc/cpuinfo
processor       : 0
vendor_id       : GenuineIntel
cpu family      : 6
model           : 23
model name      : Intel(R) Core(TM)2 Quad CPU    Q8400  @ 2.66GHz
stepping        : 10
microcode       : 0xa07
cpu MHz         : 1998.000
cache size      : 2048 KB
physical id     : 0
siblings        : 4
core id         : 0
cpu cores       : 4
apicid          : 0
initial apicid  : 0
fpu             : yes
fpu_exception   : yes
cpuid level     : 13
wp              : yes
flags           : fpu vme de pse tsc msr pae mce cx8 apic sep mtrr pge mca cmov pat pse36 clflush dts acpi mmx fxsr sse sse2 ss ht tm pbe syscall nx lm constant_tsc arch_perfmon pebs bts rep_good nopl aperfmperf pni dtes64 monitor ds_cpl vmx est tm2 ssse3 cx16 xtpr pdcm sse4_1 xsave lahf_lm dtherm tpr_shadow vnmi flexpriority
bogomips        : 5303.14
clflush size    : 64
cache_alignment : 64
address sizes   : 36 bits physical, 48 bits virtual
power management:
Every processor or core is listed separately the various details about speed, cache size and model name are included in the description. To count the number of processing units use grep with wc
$ cat /proc/cpuinfo | grep processor | wc -l
4
The number of processors shown by /proc/cpuinfo might not be the actual number of cores on the processor. For example a processor with 2 cores and hyperthreading would be reported as a processor with 4 cores.
To get the actual number of cores, check the core id for unique values
$ cat /proc/cpuinfo | grep 'core id'
core id         : 0
core id         : 2
core id         : 1
core id         : 3
So there are 4 different core ids. This indicates that there are 4 actual cores.
2. lscpu
lscpu is a small and quick command that does not need any options. It would simply print the cpu hardware details in a user-friendly format.
$ lscpu
Architecture:          x86_64
CPU op-mode(s):        32-bit, 64-bit
Byte Order:            Little Endian
CPU(s):                4
On-line CPU(s) list:   0-3
Thread(s) per core:    1
Core(s) per socket:    4
Socket(s):             1
NUMA node(s):          1
Vendor ID:             GenuineIntel
CPU family:            6
Model:                 23
Stepping:              10
CPU MHz:               1998.000
BogoMIPS:              5303.14
Virtualization:        VT-x
L1d cache:             32K
L1i cache:             32K
L2 cache:              2048K
NUMA node0 CPU(s):     0-3
3. hardinfo
Hardinfo is a gtk based gui tool that generates reports about various hardware components. But it can also run from the command line only if there is no gui display available.
$ hardinfo | less
It would produce a large report about many hardware parts, by reading files from the /proc directory. The cpu information is towards the beginning of the report. The report can also be written to a text file. Hardinfo also performs a few benchmark tests taking a few minutes before the report is displayed.
4. lshw
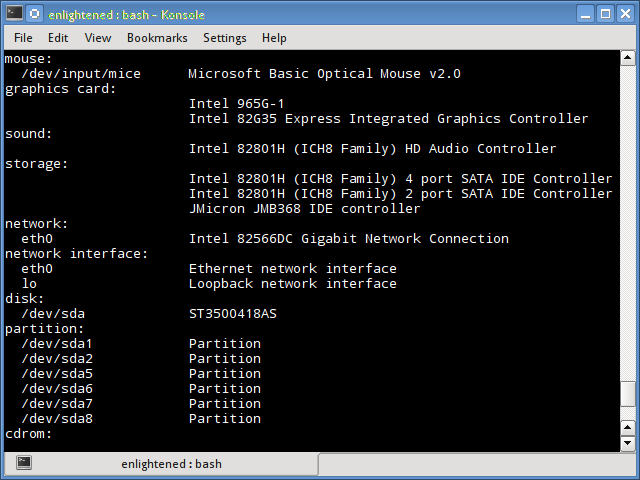
The lshw command can display limited information about the cpu. lshw by default shows information about various hardware parts, and the '-class' option can be used to pickup information about a specific hardware part.
The vendor, model and speed of the processor are being shown correctly. However it is not possible to deduce the number of cores on the processor from the above output.
5. nproc
The nproc command just prints out the number of processing units available. Note that the number of processing units might not always be the same as number of cores.
$ nproc
4
6. dmidecode
The dmidecode command displays some information about the cpu, which includes the socket type, vendor name and various flags.
Handle 0x0000, DMI type 4, 35 bytes Processor Information Socket Designation: LGA 775 Type: Central Processor Family: Pentium D Manufacturer: Intel(R) Corporation ID: 7A 06 01 00 FF FB EB BF Signature: Type 0, Family 6, Model 23, Stepping 10 Flags: FPU (Floating-point unit on-chip) VME (Virtual mode extension) DE (Debugging extension) PSE (Page size extension) TSC (Time stamp counter) MSR (Model specific registers) PAE (Physical address extension) MCE (Machine check exception) CX8 (CMPXCHG8 instruction supported) APIC (On-chip APIC hardware supported) SEP (Fast system call) MTRR (Memory type range registers) PGE (Page global enable) MCA (Machine check architecture) CMOV (Conditional move instruction supported) PAT (Page attribute table) PSE-36 (36-bit page size extension) CLFSH (CLFLUSH instruction supported) DS (Debug store) ACPI (ACPI supported) MMX (MMX technology supported) FXSR (FXSAVE and FXSTOR instructions supported) SSE (Streaming SIMD extensions) SSE2 (Streaming SIMD extensions 2) SS (Self-snoop) HTT (Multi-threading) TM (Thermal monitor supported) PBE (Pending break enabled) Version: Intel(R) Core(TM)2 Quad CPU Q8400 @ 2.66GHz Voltage: 1.6 V External Clock: 333 MHz Max Speed: 4000 MHz Current Speed: 2666 MHz Status: Populated, Enabled Upgrade: Socket LGA775 L1 Cache Handle: 0x0003 L2 Cache Handle: 0x0001 L3 Cache Handle: Not Provided Serial Number: Not Specified Asset Tag: Not Specified Part Number: Not Specified
7. cpuid
The cpuid command fetches CPUID information about Intel and AMD x86 processors. The program can be installed with apt on ubuntu
$ sudo apt-get install cpuid
And here is sample output
$ cpuid
.....
Vendor ID: "GenuineIntel"; CPUID level 13
Intel-specific functions: Version 0001067a: Type 0 - Original OEM Family 6 - Pentium Pro Model 7 - Pentium III/Pentium III Xeon - external L2 cache Stepping 10 Reserved 4
Feature flags bfebfbff: FPU Floating Point Unit VME Virtual 8086 Mode Enhancements DE Debugging Extensions PSE Page Size Extensions TSC Time Stamp Counter MSR Model Specific Registers PAE Physical Address Extension MCE Machine Check Exception CX8 COMPXCHG8B Instruction APIC On-chip Advanced Programmable Interrupt Controller present and enabled SEP Fast System Call MTRR Memory Type Range Registers PGE PTE Global Flag MCA Machine Check Architecture CMOV Conditional Move and Compare Instructions FGPAT Page Attribute Table PSE-36 36-bit Page Size Extension CLFSH CFLUSH instruction DS Debug store ACPI Thermal Monitor and Clock Ctrl MMX MMX instruction set FXSR Fast FP/MMX Streaming SIMD Extensions save/restore SSE Streaming SIMD Extensions instruction set SSE2 SSE2 extensions SS Self Snoop HT Hyper Threading TM Thermal monitor 31 reserved
.....
8. inxi
Inxi is a script that uses other programs to generate a well structured easy to read report about various hardware components on the system. Check out the full tutorial on inxi.
March 24, 2014, 3:59 PM— While the ifconfig command is still available and useful on most if not all Unix/Linux systems today, it is now deprecated on many Linux distributions. That word, which doesn't appear to be popularly used in any context other than in reference to Unix commands, simply means that the command has lost favor and will eventually be phased out -- though not necessarily any time soon. The command that has taken ifconfig's place is ip. While the ip command has numerous options and is considered more powerful than ifconfig, the ip commands you are likely to use are not difficult to learn or remember. There's just a lot more of them. To see the same type of information that ifconfig will show you, the command to use is ip addr. In this example, the system is using a bonded interface, basically allowing it to aggregate multiple NICs to achieve a higher data rate. The interface to pay attention to is, therefore, the bond0 interface.
$ ip addr
1: lo:  mtu 16436 qdisc noqueue
    link/loopback 00:00:00:00:00:00 brd 00:00:00:00:00:00
    inet 127.0.0.1/8 scope host lo
    inet6 ::1/128 scope host
       valid_lft forever preferred_lft forever
2: eth0:  mtu 1500 qdisc pfifo_fast master bond0 qlen 1000
    link/ether 63:2b:da:5f:a9:37 brd ff:ff:ff:ff:ff:ff
3: eth1:  mtu 1500 qdisc pfifo_fast master bond0 qlen 1000
    link/ether 63:2b:da:5f:a9:37 brd ff:ff:ff:ff:ff:ff
4: sit0:  mtu 1480 qdisc noop
    link/sit 0.0.0.0 brd 0.0.0.0
5: bond0:  mtu 1500 qdisc noqueue
    link/ether 63:2b:da:5f:a9:37 brd ff:ff:ff:ff:ff:ff
    inet 10.1.2.155/16 brd 10.1.255.255 scope global bond0
    inet6 fe80::7a2b:daff:fe5f:a937/64 scope link
       valid_lft forever preferred_lft forever
The ifconfig output on this same system would look like this:
Once you get comfortable with the ip addr command, you might prefer to abbreviate it to ip a. And, if you just want to see only the IPv4 or the IPv6 information, you can add an option and use the command ip -4 a or ip -6 a, limiting command's the output to one or the other. You can also limit the command's response to a particular interface by using a command such as ip a show bond0.
$ ip a show bond0
9: bond0:  mtu 1500 qdisc noqueue
    link/ether 63:2b:da:5f:a9:37 brd ff:ff:ff:ff:ff:ff
    inet 10.1.2.155/16 brd 10.1.255.255 scope global bond0
    inet6 fe80::7a2b:daff:fe5f:a937/64 scope link
       valid_lft forever preferred_lft forever
As you can see, much of the information provided by the ip command is the same as what you'd see with ifconfig -- the IP and MAC addresses, and the "UP" indicator showing that the interfaces are working. The ip link or ip l command shows a briefer display, but does not include the IP addresses.
$ ip link
1: lo:  mtu 16436 qdisc noqueue
    link/loopback 00:00:00:00:00:00 brd 00:00:00:00:00:00
2: eth0:  mtu 1500 qdisc pfifo_fast master bond0 qlen 1000
    link/ether 63:2b:da:5f:a9:37 brd ff:ff:ff:ff:ff:ff
3: eth1:  mtu 1500 qdisc pfifo_fast master bond0 qlen 1000
    link/ether 63:2b:da:5f:a9:37 brd ff:ff:ff:ff:ff:ff
4: sit0:  mtu 1480 qdisc noop
    link/sit 0.0.0.0 brd 0.0.0.0
5: bond0:  mtu 1500 qdisc noqueue
    link/ether 63:2b:da:5f:a9:37 brd ff:ff:ff:ff:ff:ff
You can use the ip route command to display your routing tables, much like you would see using netstat -r.
$ ip route
10.1.0.0/16 dev bond0  proto kernel  scope link  src 10.1.2.155
169.254.0.0/16 dev bond0  scope link
default via 10.1.1.1 dev bond0
$
$ netstat -r
Kernel IP routing table
Destination     Gateway         Genmask         Flags   MSS Window  irtt Iface
10.1.0.0        *               255.255.0.0     U         0 0          0 bond0
169.254.0.0     *               255.255.0.0     U         0 0          0 bond0
default         10.1.1.1        0.0.0.0         UG        0 0          0 bond0
And, as you might have suspected, you can use an abbreivation for the ip route command as well:
$ ip r
10.1.0.0/16 dev bond0  proto kernel  scope link  src 10.1.2.155
169.254.0.0/16 dev bond0  scope link
default via 10.1.1.1 dev bond0
The ip n show command ("n" for "neighbor") displays the kind of network information you would expect to see with a command such as arp -a. In other words, it shows information about other systems that have recently connected to your system. You can also use ip n ls.
$ ip n show
10.1.1.22 dev bond0 lladdr 00:50:56:b1:48:51 STALE
10.1.1.1 dev bond0 lladdr 00:00:0c:07:ac:01 STALE
10.1.4.21 dev bond0 lladdr 00:21:70:bd:30:2e REACHABLE
10.1.1.7 dev bond0 lladdr 08:00:37:bc:a1:6a STALE
10.1.1.8 dev bond0 lladdr 00:50:56:b1:5a:d8 STALE
10.1.4.123 dev bond0 lladdr 00:26:b9:e9:f6:0d STALE
10.1.1.250 dev bond0 lladdr 00:50:56:b1:50:9d DELAY
10.1.1.180 dev bond0 lladdr 00:0b:cd:fe:fd:8d REACHABLE
10.1.2.115 dev bond0 lladdr 08:00:37:da:17:5c REACHABLE
$
$ arp -a
mon-1.mynet.com (10.1.1.11) at 00:50:56:B1:48:51 [ether] on bond0
? (10.1.1.1) at 00:00:0C:07:AC:01 [ether] on bond0
? (10.1.4.23) at 00:21:70:BD:30:2E [ether] on bond0
? (10.1.1.70) at 08:00:37:BC:A1:6A [ether] on bond0
mon-1.mynet.com (10.1.1.5) at 00:50:56:B1:5A:D8 [ether] on bond0
? (10.1.4.113) at 00:26:B9:E9:F6:0D [ether] on bond0
all-log-1 (10.1.1.212) at 00:50:56:C2:50:9A [ether] on bond0
mon-1.mynet.com (10.1.1.123) at 00:0B:CD:FE:FD:8D [ether] on bond0
? (10.1.2.115) at 08:00:37:da:17:5C [ether] on bond0
The state of each neighbor is shown at the end of each line in the ip n show output. The possible states include:
delay -- waiting confirmation
failed -- resolution has failed
incomplete -- in the process of resolution
noarp -- valid, removable when lifetime expires
none -- void
permanent -- can only be removed administratively
probe -- delay timer expired, but no confirmation
reachable -- valid until reachability timeout expires
stale -- valid but maybe already unreachable
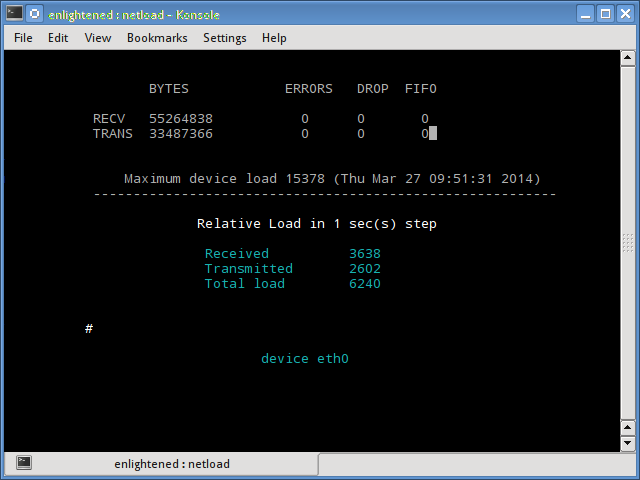
Other useful networking commands include a couple netstat favorites. The netstat -i command will show you network statistics by interface:
For per protocol statistics, use the netstat -s command ("s" for "statistics"). This command provides very detailed network information -- likely more than you will need to look at very often, but extremely useful for heavy duty troubleshooting.
$ netstat -s
Ip:
    1744690691 total packets received
    2559835 with invalid addresses
    0 forwarded
    0 incoming packets discarded
    1700771884 incoming packets delivered
    1175883101 requests sent out
    7068 reassemblies required
    3524 packets reassembled ok
Icmp:
    279076 ICMP messages received
    1099 input ICMP message failed.
    ICMP input histogram:
        destination unreachable: 4233
        timeout in transit: 108
        echo requests: 272761
        echo replies: 1974
    281380 ICMP messages sent
    0 ICMP messages failed
    ICMP output histogram:
        destination unreachable: 5198
        echo request: 3421
        echo replies: 272761
IcmpMsg:
        InType0: 1974
        InType3: 4233
        InType8: 272761
        InType11: 108
        OutType0: 272761
        OutType3: 5198
        OutType8: 3421
Tcp:
    9713305 active connections openings
    6346380 passive connection openings
    2975552 failed connection attempts
    3438243 connection resets received
    45 connections established
    1630650812 segments received
    1172423736 segments send out
    2826779 segments retransmited
    0 bad segments received.
    3928370 resets sent
Udp:
    69839443 packets received
    919 packets to unknown port received.
    0 packet receive errors
    350238 packets sent
TcpExt:
    120 invalid SYN cookies received
    323 resets received for embryonic SYN_RECV sockets
    32 packets pruned from receive queue because of socket buffer overrun
    33 ICMP packets dropped because they were out-of-window
    4343758 TCP sockets finished time wait in fast timer
    4834 time wait sockets recycled by time stamp
    12 packets rejects in established connections because of timestamp
    16658045 delayed acks sent
    1292 delayed acks further delayed because of locked socket
    Quick ack mode was activated 59694 times
    2059 times the listen queue of a socket overflowed
    2059 SYNs to LISTEN sockets ignored
    705660774 packets directly queued to recvmsg prequeue.
    100560858 packets directly received from backlog
    2061379123 packets directly received from prequeue
    254869153 packets header predicted
    635912715 packets header predicted and directly queued to user
    77257282 acknowledgments not containing data received
    1108616005 predicted acknowledgments
    285936 times recovered from packet loss due to SACK data
    Detected reordering 159 times using FACK
    Detected reordering 46695 times using SACK
    Detected reordering 19 times using time stamp
    19 congestion windows fully recovered
    1473 congestion windows partially recovered using Hoe heuristic
    TCPDSACKUndo: 169
    8426 congestion windows recovered after partial ack
    18907635 TCP data loss events
    TCPLostRetransmit: 1907
    608 timeouts after SACK recovery
    50 timeouts in loss state
    2370237 fast retransmits
    279757 forward retransmits
    26643 retransmits in slow start
    14340 other TCP timeouts
    1858 sack retransmits failed
    3 times receiver scheduled too late for direct processing
    7154 packets collapsed in receive queue due to low socket buffer
    59861 DSACKs sent for old packets
    29977 DSACKs received
    48462 DSACKs for out of order packets received
    463844 connections reset due to unexpected data
    1039018 connections reset due to early user close
    3187 connections aborted due to timeout
IpExt:
    InMcastPkts: 1466685
    OutMcastPkts: 18093
    InBcastPkts: 72565731
    OutBcastPkts: 41363
Wrap up: You'll probably be comfortable with using ip commands long before ifconfig disappears from your servers, but why wait? Even people like me who have been typing ifconfig for decades can learn some new tricks
Many businesses use Microsoft Active Directory (AD) to manage their Windows server infrastructure. You can take advantage of AD's directory services and maintain a single service to authenticate users on all platforms. The alternatives – setting up LDAP directory servers for user management on Linux servers, or worse still, using local accounts on every machine – would be a management nightmare, and would make meeting audit requirements a lot harder. Here's how to integrate a vanilla CentOS 6.x host into AD for user management, and how to use AD-based credentials to manage a Linux server.
Step 1: Pre-installation checks
Before setting up a CentOS host to use AD authentication, ensure that it can see the AD network and get a response from the AD DNS server. Configure the CentOS DNS client to use the AD-based DNS servers by using system-config-network-tui and selecting DNS configuration rather than device configuration. As a minimum the CentOS DNS client should be able to ping the AD server, using both the hostname and the fully qualified domain name (FQDN). If you have issues trying to resolve the AD domain servers, check that the CentOS host is using the same DNS servers as the Windows domain. If necessary, use system-config-network-tui to edit /etc/resolv.conf to correct the issue. (This is the official Red Hat/CentOS method.) It may also be worth checking your firewall settings with the command iptables -L -n -v to ensure that the ports required for AD authentication are open, as they are in a fresh installation of CentOS.
Step 2: Install AD requirements
Once you have confirmed that the CentOS host is using the correct AD DNS, install three new packages to enable AD integration. Log in to the CentOS host as root and issue the command:
NSCD stands for name server caching daemon. As you might imagine, it caches requests made to the server. Pam_krb5 is the Kerberos authentication plugin, which is required when you want to "speak AD." Samba-winbind provides the tools required to allow a Linux host to become a full member of an AD domain.
Step 3: Configure settings
After the packages are installed, run authconfig-tui as root. This utility provides a text-mode GUI that you can use to configure the authorization mechanisms on your CentOS host. If you encounter any errors or the command fails to run, ensure that all the prerequisites as detailed in step 2 are installed. In the GUI select "Cache Information" and "Use Winbind" from the User Information list. Among the Authentication components, select "Use MD5 Passwords" and "Use Winbind Authentication." Deselect "Local authentication is sufficient," then click Next. On the Winbind settings screen you need to enter the settings and credentials required to join the AD domain. For the security model to use, you must select ADS for Active Directory integration. Enter the domain details and the specific domain controllers using the FQDN. Fill in the ADS realm, which for small installations will more than likely be the Primary Domain Controller. Change the template shell option to reflect your preferred login shell. Leaving it at the default, nologin, will prevent the account from logging in to the server. Once you've entered all the settings, press "Join Domain." You may see a screen warning you that some of the information needs to be saved to disk. If so, select Yes. On the next screen you should be able to join the CentOS host to the AD domain via your domain admin username and password. You can configure authentication to use other accounts, substituting the administrator account for other domain administrator accounts, but for this example, I am using the domain administrator. Once the configuration is complete, click "Ok" to return to the command line. If you encounter any errors when installing using authconfig, check the /var/log/secure log file, or perhaps more easily the console, for username/password errors. If not, reboot to make the setting changes take effect. At this point, barring any configuration issues, an AD domain user should be able to log in to the CentOS host using your domain administrator credentials. On my system, I used test\administrator, as in the figure below. Notice that there is no home directory. This is to be expected, as the administrator does not have a local account and therefore no home directory. Rather than using the domain admin account for authentication, I suggest enhancing security by creating a custom user who is a member of the Domains Admins group. On the Windows AD controller, go to Administrative Tools -> Active Directory Users and Computers. Expand the domain, select the Users folder, and click Create New Users. Fill in the details as required. Add the user to the Domain Admins group by clicking "Member of" and adding "Domain Admins". Click OK, and the user is ready.
Step 4: Allowing AD users to manage CentOS servers
Users who log in to the CentOS host at this point using AD credentials lack admin rights. You can test this by trying to shut down the CentOS host when you're connected as test\administrator (on a non-production host!). The command should fail because you don't have sufficient rights. To enable a group of users to run admin commands, modify the /etc/sudoers file. To allow any AD user to reboot the host, log in as root. Modify the sudoers file either manually, or more correctly, using the visudo command, adding the line @test\administrator shutdown -h now. Domain users in the sudoers file are referenced on Linux servers using @ in front of the groups. To work with a group rather than a single user, as we did above, use % instead. For example, to allow members of the group linuxadmins to have all rights in sudo, assuming that group has already been created in AD, add to the sudoers file the line:
%linuxadmins ALL=(ALL) ALL
To use groups with spaces, such as "Domain Users," use "\" to delimit the spaces. Thus "Domain Users" is referenced as "Domain\Users." At this point, any AD user should be able to authenticate against the AD infrastructure. You will need to authenticate using the "old" Windows format of Domain\User rather than the newer user@domain. format, so log in as test\administrator rather than administrator@test.
Closing tips and tricks
Before you consider the process finished, thoroughly test your configuration. Ensure that administrators can log in and perform any actions required on the CentOS server. In many companies, Linux and Windows admins are separate groups. Rather than work with AD's default Domain Admins group, I suggest creating a distinct AD group for Linux admins, such as the linuxadmins group I referenced above. This lets you limit the remit of the group to managing only Linux servers, with no admin rights to Windows servers. Having a single authentication system for all network administrators and users eases the administrative burden of the administrator. Such a system is a key component in automation of server provisioning, and used effectively can also help reduce your IT costs.
Postfix is a commonly used MTA (Mail Transfer Agent) program that can receive, deliver or route emails. So if you have your own domain and a server then using postfix you can setup emails on the domain like myname@mydomain.com.
Setting up a full featured mail server with postfix is a lengthy process requiring quite some effort. Furthermore, using your own mail server you do miss out the convenience and features of the popular free email services like gmail or hotmail. One way is to use google's paid service to integrate gmail with the domain email. Alternatively, setup your webserver to forward all mails coming on your domain email, to your other address like gmail. Doing so would allow you to accept mails on your personal domain emails, making it look professional and at the same time use gmail service to access the same and enjoy the convenience of gmail too.
mail for superman@site.com ==> [ site.com Postfix server ] ==> forwarded to superman@gmail.com
So this post shows how to setup mail forwarding on a Debian or Ubuntu server using the postfix program. For other distros like CentOS and Fedora too, the steps are nearly the same.
Install Postfix
Installation is super quick. Postfix is there in the default repos, so just use apt-get to install.
$ sudo apt-get install postfix
During installation it would ask a couple of questions about how to configure the mail server. Fill in the required information and proceed. Once the installation is complete, the mail server daemon would be started.
$ sudo service postfix status
 * postfix is running
You can further check that postfix is running a server on port 25 with the netstat command
The last column shows the pid of the processing, which is postfix here.
Verify DNS settings of domain
Before proceeding to configuring postfix to forward mails on behalf of your domain, its necessary to ensure that the MX records for your domain are pointing to the right server. This can be done quickly with the dig command. Run it from your local machine.
In the 'ANSWER SECTION' it can be seen that mail.binarytides.com is reported as the mail server for binarytides.com. Next, dig up the a records for the domain mail.binarytides.com and it would show the server ip to which it points.
$ dig mail.binarytides.com a
; <<>> DiG 9.9.3-rpz2+rl.13214.22-P2-Ubuntu-1:9.9.3.dfsg.P2-4ubuntu1.1 <<>> mail.binarytides.com a ;; global options: +cmd ;; Got answer: ;; ->>HEADER<<- 09:00:19="" 0="" 127.0.1.1="" 173.255.230.5="" 1="" 2014="" 28="" 30="" 4096="" 43356="" 65="" 85045="" a="" additional:="" answer:="" answer="" authority:="" edns:="" flags:="" fri="" id:="" in="" ist="" mail.binarytides.com.="" mar="" msec="" msg="" noerror="" opcode:="" opt="" pre="" pseudosection:="" qr="" query:="" query="" question="" ra="" rcvd:="" rd="" section:="" server:="" size="" status:="" time:="" udp:="" version:="" when:=""> Now the ANSWER SECTION shows the ip address of mail.binarytides.com which over here is correct. Do the same for your domain and verify that the mx records are setup correctly.
Configure postfix to forward mails
Now comes the final task of configuring postfix to forward mails, and it is surprisingly simple.
Find the path of the configuration directory using the postconf command
The first line virtual_alias_domains lists the domains, for which postfix is going to accept emails. Multiple domains are added separated by a space. The second line virtual_alias_maps specifies the path to the file which is going to contain mappings specifying how to forward emails for the above domains. Now open the /etc/postfix/virtual file (create one if it does not exist) and add to it the emails you want to forward along with the destination emails.
The first email is the address on which postfix shall receive emails, and the second is the address where postfix would forward the emails. The mail can be forwarded to multiple destinations
To catch and forward emails to any address for a given domain, use the following notation
# forward all emails
@mydomain.com myself@gmail.com mystaff@gmail.com
After entering the forwarding rules, save the file and close it. Then run the following commands for the new settings to take effect Update the postfix lookup table
$ postmap /etc/postfix/virtual
Reload postfix configuration
$ sudo /etc/init.d/postfix reload
# or
$ sudo service postfix reload
Check with the postconf command that the domain aliases and alias file have been setup properly.
Now try sending an email from somewhere outside the world, to the address on your domain, and you should see the same mail forwarded to the gmail account.->
1. Introduction In recent years, several researchers have studied Linux kernel security. The most common kernel privilege vulnerabilities can be divided into several categories: NULL pointer dereference, kernel space stack overflow, kernel slab overflow, race conditions, etc.
Some of them are pretty easy to exploit and there is no need to prepare your own Linux kernel debugging environment to write the exploit. Some others requires special knowledge of Linux kernel design, routines, memory management, etc.
In this tutorial we will explain how the SLUB allocator works and how we can make our user-land code to be executed when we can corrupt some metadata from a slab allocator.
2. The Slab Allocator The Linux kernel has three main different memory allocators: SLAB, SLUB, and SLOB.
I would note that “slab” means the general allocator design, while SLAB/SLUB/SLOB are slab implementations in the Linux kernel.
And you can use only one of them; by default, Linux kernel uses the SLUB allocator, since 2.6 is a default memory manager when a Linux kernel developer calls kmalloc().
So let’s talk a little bit about these three implementations and describe how they work. 2.1. SLAB allocator The SLAB is a set of one or more contiguous pages of memory handled by the slab allocator for an individual cache. Each cache is responsible for a specific kernel structure allocation. So the SLAB is set of object allocations of the same type.
The SLAB is described with the following structure:
1
2
3
4
5
6
7
8
9
10
11
12
13
14
15
16
17
struct slab
{
union
{
struct
{
struct list_head list;
unsigned longcolouroff;
void *s_mem;
unsigned intinuse; /*num of used objects */
kmem_bufctl_t free;
unsigned short nodeid;
};
struct slab_rcu __slab_cover_slab_rcu;
};
};
For example, if you make two allocations of tasks_struct using kmalloc, these two objects are allocated in the same SLAB cache, because they have the same type and size.
Two pages with six objects in the same type handled by a slab cache
2.2. SLUB allocator SLUB is currently the default slab allocator in the Linux kernel. It was implemented to solve some drawbacks of the SLAB design.
The following figure includes the most important members of the page structure. (Look here to see the full version.)
1
2
3
4
5
6
7
8
9
10
11
12
13
14
15
16
17
18
19
20
21
22
23
24
25
26
27
28
29
30
31
32
33
34
35
struct page
{
...
struct
{
union
{
pgoff_t index; /*Our offset within mapping. */
void *freelist; /*slub first free object*/
};
...
struct
{
unsigned inuse:16;
unsigned objects:15;
unsigned frozen:1;
};
...
};
...
union
{
...
struct kmem_cache *slab; /*SLUB: Pointer to slab */
...
};
...
};
A page’s freelist pointer is used to point to the first free object in the slab. This first free object has another small header, which has another freelist pointer that points to the next free object in the slab, while inuse is used to track of the number of objects that have been allocated.
The figure illustrates that:
The SLUB ALLOCATOR: linked list between free objects.
The SLUB allocator manages many of dynamic allocations/deallocations of the internal kernel memory. The kernel distinguishes these allocations/deallocations by their sizes;
some caches are called general-purpose (kmalloc-192: it holds allocations between 128 and 192 bytes). For example, if you invoke kmalloc to allocate 50 bytes, it creates the chunk of memory from the general-purpose kmalloc-64, because 50 is between 32 and 64.
For more details, you can type “cat /proc/slabinfo.”
/proc/slabinfo has no longer readable by a simple user …, so you should work with the super-user when writing exploits. 2.3. SLOB allocator The SLOB allocator was designed for small systems with limited amounts of memory, such as embedded Linux systems.
SLOB places all allocated objects on pages arranged in three linked lists. 3. kernel SLUB overflow Exploiting SLUB overflows requires some knowledge about the SLUB allocator (we’ve described it above) and is one of the most advanced exploitation techniques.
Keep in mind that objects in a slab are allocated contiguously so, if we can overwrite the metadata used by the SLUB allocator, we can switch the execution flow into the user space and execute our evil code. So our goal is to control the freelist pointer, The freelist pointer, as described above, is a pointer to the next free object in the slab cache. If freelist is NULL, the slab is full, no more free objects are available, and the kernel asks for another slab cache with PAGE_SIZE of bytes (PAGE_SIZE=4096). If we overwrite this pointer with an address of our choice, we can return to a given kernel path an arbitrary memory address (user-land code).
Want to learn more?? The InfoSec Institute Advanced Hacking course aims to train you on how to successfully attack fully patched and hardened systems by developing your own exploits. You will how to circumvent common security controls such as DEP and ASLR, and how to get to confidential data. You take this knowledge back to your organization and can then formulate a way to defend against these sophisticated attacks. Some features of this course include:
Create 0day attacks as part of the Advanced Persistent Threat
5 days of Intensive Hands-On Labs
Use fuzzers and dynamic analysis to attack custom and COTS apps
Reverse engineer binaries to find new vulnerabilities never discovered before
Attack and defeat VPNs, IDS/IPS and other security technologies
So let’s make a small demonstration and look at this in more practical way. I’ve built a vulnerable device driver that does some trivial input/output interactions with userland processes.
Let’s describe a little bit what the code does: This is a dummy kernel model that creates a character device, “/dev/vuln,” and makes some basic I/O operations.
The bug is obvious to spot.
In the vuln_write_dev() function, we notice that the ramdisk variable is used to store the user input and it’s allocated safely with lbuf, which is the length of user input. Then it will be copied into the copy variable, which is kmalloc’ed with 256 bytes. So it is easy to spot that there is a heap SLUB overflow if a user writes data greater in size than 256 bytes.
First you should download the lab of this article. It is a qemu archive system containing the kernel module, the proof of concept, and the final exploit.
Let’s trigger the bug first: So we’ve successfully overwritten the freelist pointer for the next free object.
If we overwrite this freelist metadata with the address of a userland function, we can run our userland function inside the kernel space; thus we can hijack root privileges and drop the shell after.
I forgot to mention that there are three categories of the slab caches: full slab, partial slab, and empty slab. Full slab: The slab cache is fully allocated and doesn’t contain any free chunks so its freelist equals NULL.
Want to learn more?? The InfoSec Institute Advanced Hacking course aims to train you on how to successfully attack fully patched and hardened systems by developing your own exploits. You will how to circumvent common security controls such as DEP and ASLR, and how to get to confidential data. You take this knowledge back to your organization and can then formulate a way to defend against these sophisticated attacks. Some features of this course include:
Create 0day attacks as part of the Advanced Persistent Threat
5 days of Intensive Hands-On Labs
Use fuzzers and dynamic analysis to attack custom and COTS apps
Reverse engineer binaries to find new vulnerabilities never discovered before
Attack and defeat VPNs, IDS/IPS and other security technologies
Partial slab: The slab cache contains free and allocated chunks and is able to allocate other chunks. Empty slab: The slab cache doesn’t have any allocation, so all chunks are free and ready to be allocated. 4. Building the exploit So the problem is that, when the attacker wants to overwrite a freelist pointer, he must take care of the slab’s situation and it should be either a full slab or an empty slab. He also needs to make sure that the next freelist pointer is the right target.
So we have 256 bytes allocated with kmalloc, so we should take a look at /proc/slabinfo and gather some useful information about the general-purpose kmalloc-256. The next step is to make a comparison between the free objects and used objects in the slab cache and then we have to fill them and make the slab full to ensure that the kernel will create a fresh slab.
To do that we have to figure out some ways to make allocations in the general purpose “kmalloc-256,”, and we find that a good target for this is struct file kernel structure. Since we can’t allocate it directly from the user space, we can do it by calling some syscalls to do it for us, such as open(), socket(), etc.
Calling these kinds of functions allows us to make some struct file allocations and that’s good for an attacker’s purpose.
As we described earlier, we should ensure that there are no more free chunks for the current slab, so we have to make a lot of struct file allocations:
1
2
for(i=0;i<1000;i++)
socket(AF_INET,SOCK_STREAM,0);
Good, so take a look again at the slab cache. The next thing to do is to trigger the crash. If we write an amount of data greater than 256 bytes, we will definitely overwrite the next free list pointer to let the kernel execute some userspace codes of our choice.
So how does the userland code get to be executed in the kernel land ?
We have to look for function pointers and we are glad to see that struct file contains struct file_operations containing a function pointer.
Our attack is shown below:
1
2
3
4
5
struct file{
.f_op =struct file_operations ={
.fsync =ATTACKER_ADDRESS,
};
};
As you see, you there are a lot of function pointers and you can choose any one you want. But how can we put this “ATTACKER_ADDRESS” ? The idea is to build a new fake struct file and put its address in the payload, so the freelist will be overwritten by the address of our fake struct file; thus the freelist points into our fake struct file and it assumes that it’s the next free object, so we are moving the control flow into the userspace. This is a powerful technique.
When the attacker calls fsync(2) syscall, the ATTACKER_ADDRESS will be executed instead of the real fsync operation. Good, so we can execute our userland code, but how can we get root privileges ? It’s very easy to get root by calling:
Let’s run the code: Bingo! 5. Conclusion We have studied how the kernel SLUB works and how we can get privileges. Exploiting kernel vulnerabilities is not so different than userspace, but the kernel exploit development requires strong knowledge of how the kernel works, its routines, how it protects against race conditions, etc.
It was very fun to play with these kind of bugs, as there are not a whole lot of modern, public example s of SLUB overflow exploits.
This post mentions some linux command line tools that can be used to monitor the network usage. These tools monitor the traffic flowing through network interfaces and measure the speed at which data is currently being transferred. Incoming and outgoing traffic is shown separately.
Some of the commands, show the bandwidth used by individual processes. This makes it easy to detect a process that is overusing network bandwidth. The tools have different mechanisms of generating the traffic report. Some of the tools like nload read the "/proc/net/dev" file to get traffic stats, whereas some tools use the pcap library to capture all packets and then calculate the total size to estimate the traffic load.
Here are the command names segregated upon features
Nload is a commandline tool that allows users to monitor the incoming and outgoing traffic separately. It also draws out a graph to indicate the same, the scale of which can be adjusted. Easy and simple to use, and does not support many options. So if you just need to take a quick look at the total bandwidth usage without details of individual processes, then nload will be handy.
$ nload
Installing Nload - Fedora and Ubuntu have got it in the default repos. CentOS users need to get nload from Epel repositories.
# fedora or centos
$ yum install nload -y

# ubuntu/debian
$ sudo apt-get install nload
2. iftop
Iftop measures the data flowing through individual socket connections, and it works in a manner that is different from Nload. Iftop uses the pcap library to capture the packets moving in and out of the network adapter, and then sums up the size and count to find the total bandwidth under use. Although iftop reports the bandwidth used by individual connections, it cannot report the process name/id involved in the particular socket connection. But being based on the pcap library, iftop is able to filter the traffic and report bandwidth usage over selected host connections as specified by the filter.
$ sudo iftop -n
The n option prevents iftop from resolving ip addresses to hostname, which causes additional network traffic of its own.
Install iftop - Ubuntu/Debian/Fedora users get it from default repos. CentOS users get it from Epel.
# fedora or centos
yum install iftop -y

# ubuntu or debian
$ sudo apt-get install iftop
3. iptraf
Iptraf is an interactive and colorful IP Lan monitor. It shows individual connections and the amount of data flowing between the hosts. Here is a screenshot
# ubuntu or debian $ sudo apt-get install iptraf iptraf-ng
4. nethogs
Nethogs is a small 'net top' tool that shows the bandwidth used by individual processes and sorts the list putting the most intensive processes on top. In the event of a sudden bandwidth spike, quickly open nethogs and find the process responsible. Nethogs reports the PID, user and the path of the program.
$ sudo nethogs
Install Nethogs - Ubuntu, Debian, Fedora users get from default repos. CentOS users need Epel
Bmon (Bandwidth Monitor) is a tool similar to nload that shows the traffic load over all the network interfaces on the system. The output also consists of a graph and a section with packet level details.
Install Bmon - Ubuntu, Debian and Fedora users can install from default repos. CentOS users need to setup repoforge, since its not available in Epel.
Bmon supports many options and is capable of producing reports in html format. Check the man page for more information
6. slurm
Slurm is 'yet' another network load monitor that shows device statistics along with an ascii graph. It supports 3 different styles of graphs each of which can be activated using the c, s and l keys. Simple in features, slurm does not display any further details about the network load.
$ slurm -s -i eth0
Install slurm
# debian or ubuntu
$ sudo apt-get install slurm

# fedora or centos
$ sudo yum install slurm -y
7. tcptrack
Tcptrack is similar to iftop, and uses the pcap library to capture packets and calculate various statistics like the bandwidth used in each connection. It also supports the standard pcap filters that can be used to monitor specific connections.
Install tcptrack - Ubuntu, Debian and Fedora have it in default repos. CentOS users need to get it from RepoForge as it is not available in Epel either.
Vnstat is bit different from most of the other tools. It actually runs a background service/daemon and keeps recording the size of data transfer all the time. Next it can be used to generate a report of the history of network usage.
$ service vnstat status
 * vnStat daemon is running
Running vnstat without any options would simply show the total amount of data transfer that took place since the date the daemon is running.
$ vnstat Database updated: Mon Mar 17 15:26:59 2014
To monitor the bandwidth usage in realtime, use the '-l' option (live mode). It would then show the total bandwidth used by incoming and outgoing data, but in a very precise manner without any internal details about host connections or processes.
Vnstat is more like a tool to get historic reports of how much bandwidth is used everyday or over the past month. It is not strictly a tool for monitoring the network in real time. Vnstat supports many options, details about which can be found in the man page. Install vnstat
Bwm-ng (Bandwidth Monitor Next Generation) is another very simple real time network load monitor that reports a summary of the speed at which data is being transferred in and out of all available network interfaces on the system.
A tiny little simple bandwidth monitor that displays the traffic volume through network interfaces. No further options, just the traffic stats are display and updated in realtime.
$ sudo apt-get install cbm
11. speedometer
Another small and simple tool that just draws out good looking graphs of incoming and outgoing traffic through a given interface.
$ speedometer -r eth0 -t eth0
Install speedometer
# ubuntu or debian users
$ sudo apt-get install speedometer
12. Pktstat
Pktstat displays all the active connections in real time, and the speed at which data is being transferred through them. It also displays the type of the connection, i.e. tcp or udp and also details about http requests if involved.
$ sudo pktstat -i eth0 -nt
$ sudo apt-get install pktstat
13. Netwatch
Netwatch is part of the netdiag collection of tools, and it too displays the connections between local host and other remote hosts, and the speed at which data is transferring on each connection.
$ sudo netwatch -e eth0 -nt
$ sudo apt-get install netdiag
14. Trafshow
Like netwatch and pktstat, trafshow reports the current active connections, their protocol and the data transfer speed on each connection. It can filter out connections using pcap type filters. Monitor only tcp connections
$ sudo trafshow -i eth0 tcp
$ sudo apt-get install netdiag
15. Netload
The netload command just displays a small report on the current traffic load, and the total number of bytes transferred since the program start. No more features are there. Its part of the netdiag.
$ netload eth0
$ sudo apt-get install netdiag
16. ifstat
The ifstat reports the network bandwidth in a batch style mode. The output is in a format that is easy to log and parse using other programs or utilities.
$ ifstat -t -i eth0 0.5
  Time           eth0
HH:MM:SS   KB/s in  KB/s out
09:59:21      2.62      2.80
09:59:22      2.10      1.78
09:59:22      2.67      1.84
09:59:23      2.06      1.98
09:59:23      1.73      1.79
Install ifstat - Ubuntu, Debian and Fedora users have it in the default repos. CentOS users need to get it from Repoforge, since its not there in Epel.
Dstat is a versatile tool (written in python) that can monitor different system statistics and report them in a batch style mode or log the data to a csv or similar file. This example shows how to use dstat to report network bandwidth
Collectl reports system statistics in a style that is similar to dstat, and like dstat it is gathers statistics about various different system resources like cpu, memory, network etc. Over here is a simple example of how to use it to report network usage/bandwidth.
Those were a few handy commands to quickly check the network bandwidth on your linux server. However these need the user to login to the remote server over ssh. Alternatively web based monitoring tools can also be used for the same task. Ntop and Darkstat are some of the basic web based network monitoring tools available for Linux. Beyond these lie the enterprise level monitoring tools like Nagios that provide a host of features to not just monitor a server but entire infrastructure.
Web servers use HTTP by default, which is a clear text protocol. As the name suggests, a clear text protocol does not apply any form of encryption on the transit data. While the HTTP-based web server is very easy to set up, it has a major drawback in terms of security. Any "man-in-the-middle" is able to see the content of the transit packets with carefully placed packet sniffers. Taking the vulnerability one step further, a malicious user can even set up an impostor server in the transit path, which then pretends to be the actual destination web server. In this case, end users may actually communicate with the impostor server instead of the real destination server. This way, the malicious user can trick the end users into handing over sensitive information such as user name and passwords through carefully crafted fake forms. To deal with these kinds of vulnerabilities, most providers often prefer HTTPS in their web servers. For read-only type sites where users only read the content and do not actually input any information, HTTP still is a viable option. However, for sites that maintain sensitive information and/or sites where users log in to get services, HTTPS is a must. HTTPS enables a website to provide the following services.
Ensures that all transit packets to and from the servers are encrypted.
Establishes the trust with an official digital certificate, such that impostor servers are unable to pretend to be the actual server.
The first thing needed for setting up HTTPS is a digital certificate. Digital certificates can be obtained in any of the following methods.
Self-signed certificates are recommended for testing purposes and personal projects. Self-signed certificates are also applicable for service providers where the client users are specific and the circle of trust is limited. Self-signed certificates do not cost money.
Certificates can be obtained from community-based certificate providers such as StartSSL and CACert. These certificates do not cost money either, but is recommended for personal projects.
For commercial projects where websites are accessed globally, it is recommended to purchase a certificate from a well-known trusted certificate authority. These certificates cost money, but they increase the credibility of the web service provider.
Preparation
In this demonstration, we will be using a self-signed certificate. It is assumed that Apache web server is already installed on CentOS. To generate a self-signed certificate, openssl is used. If openssl is not already installed, it can be installed using yum.
# yum install mod_ssl openssl
Generating a Self-Signed Certificate
The following commands can be used to generate a self-signed certificate. First, generate a private key with 2048 bit encryption.
Now that the certificate is ready, it is time to tune Apache web server. First, edit the following configuration file.
# vim /etc/httpd/conf.d/ssl.conf
### overwrite the following parameters ###
SSLCertificateFile /etc/pki/tls/certs/ca.crt
SSLCertificateKeyFile /etc/pki/tls/private/ca.key

### The following parameter does not need to be modified in case of a self-signed certificate. ###
### If you are using a real certificate, you may receive a certificate bundle. The bundle is added using the following parameters ###
SSLCertificateChainFile /etc/pki/tls/certs/example.com.ca-bundle
Then the httpd service is restarted for the changes to take effect.
# service httpd restart
The web server is now ready to use HTTPS.
Tuning Virtual Hosts
Apache web server can be configured to host multiple web sites. These sites are declared as virtual hosts in httpd configuration file. For example, let us assume that our Apache web server is hosting a site virtual-web.example.com, and all the files of the site are stored in /var/www/html/virtual-web directory. For the virtual host, the typical configuration for HTTP would look like this.
For each virtual host, similar tags have to be defined. After adding the virtual hosts, the web service is restarted.
# yum install httpd
Now the virtual hosts are ready to use HTTPS as well.
Optional: Forcing Apache Web Server to Always Use HTTPS
If, for some reason, you decide to always use HTTPS in the web server, you will need to redirect all incoming HTTP requests (Port 80) to HTTPS (port 443). Apache web server can be easily tuned to do this.
1. Forcing the Main Site Only
To force the main site to always use HTTPS, we modify the httpd configuration file.
To sum up, HTTPS is always recommended for sites where users log in. This improves the security of both the server and the users who use it. Certificates can be obtained in various means such as self-signed, community driven or even commercial authorities. The admin should be prudent while selecting the type of certificate that will be used. Hope this helps.
No, they're not kidding. As Sally Radwan, Canonical's cloud product marketing manager, recently explained, "A few years ago, the cloud team at Canonical decided that the future of cloud computing lies not only in what clouds are built on, but what runs on it, and how quickly, securely, and efficiently those services can be managed. This is when Juju was born; our service orchestration tool built for the cloud and inspired by the way IT architects visualize their infrastructure: boxes representing services, connected by lines representing interfaces or relationships. Juju’s GUI simplifies searching, dragging and dropping a ‘Charm’ into a canvas to deploy services instantly."
Juju works. In my experience with Juju, it does a remarkably good job of doing just that. Unlike Chef or Puppet which are great cloud DevOps programs that enable you to easily set up servers and virtual machines (VM), Juju lets you to set up services with little fuss or muss. Now, Canonical is moving Juju up to an even higher level of the cloud deployment stack: Juju Charm bundles. With these you get one-click installation for an entire cloud infrastructure. Sure, today you can set up a virtual machine in less time than it took you to read this far in the story, but Canonical is talking about setting up customized cloud instances, the required server programs, and the hookups between them with one click.
True, there are cloud programs, such as TurnKey Linux, which give you the power to set up cloud appliances such as a Drupal Content Management System (CMS), a generic Linux, Apache, MySQL, PHP/Python/Perl (LAMP) stack, or WordPress. With those programs you're pretty much you're stuck with what you get. Of course, you can customize them, but they require you first to deploy them and then get your hands dirty with manually setting up the programs. With Juju you can set up customized cloud appliances with drag-and-drop icons and then just install them with a single mouse-click.
For example, existing Juju Charm Bundles let you set up the following environments:
Instant Hadoop: The Hadoop cluster bundle is a seven-node starter cluster designed to deploy Hadoop in a way that’s easily scalable. The deployment has been tested with up to 2,000 nodes on Amazon Web Services (AWS).
Instant Mongo: Mongodb, a 13-node (over three shards) starter MongoDB cluster has the capability to horizontally scale all three shards.
Instant Wiki: Two Mediawiki deployments; a simple example mediawiki deployment with just mediawiki and MySQL; and a load-balanced deployment with HAProxy and memcached, designed to be horizontally scalable.
Instant Security: Syncope + PostgreSQL, developed by Tirasa, is a bundle providing Apache Syncope with the internal storage up and running on PostreSQL. Apache Syncope is an open source system for managing digital identities in enterprise environments.
Instant Enterprise Solutions: Credativ, an open source consultancy, is showing with its OpenERP bundle how any enterprise can instantly deploy an enterprise resource planning solution.
Instant High Performance Computing: High Performance Computing Cluster (HPCC) is a massive parallel-processing computing platform that solves Big Data problems.
Sounds pretty darn cool and useful doesn't it? Give Juju a try — it's free. I think you'll like it. For instructions on how to build your own charms or bundle check out the Ubuntu developer cloud page and this set of Juju how-to blogs.
This post shows how to configure Varnish to handle WebSocket traffic. Varnish is an HTTP accelerator that's commonly used to cache dynamic content for a Web server. On this site, it is sitting in front of Nginx, which by itself is a resource-friendly Web server, a lot more resource-friendly than Apache. Using Varnish with Nginx makes a website load really fast. When I decided to use NodeBB as the forum application for this website, I wasn't aware that Varnish and WebSocket don't play nice by default, so Varnish has to be explicitly configured to handle WebSocket traffic. But it took several frustrating days before I finally figured out that Varnish was the source of the problems and errors I was dealing with. NodeBB is a NodeJS forum application that makes use of WebSocket to provide real-time features. If you haven't used it before, register an account here to get a first-hand view of how it works. It's definitely much better than your traditional PHP-based forum software. By default NodeBB does not run on the standard HTTP port, so I had to use Nginx to proxy connections to it. To make Varnish handle WebSocket traffic, the code below was added to the Varnish configuration file (/etc/varnish/default.vcl) Note that this is in addition to what's already in that file:
sub vcl_pipe { if(req.http.upgrade){ set bereq.http.upgrade = req.http.upgrade; } }
That piece of code was taken from here. The backend points to where NodeBB is listening. To make this work, that backend has to be referencd in the Nginx configuration file for this subdomain. That file looks something like this:
upstream nodejs { server 127.0.0.1:4567; }
server { listen 81 default;
## Settings for proxying NodeBB forum installation.
# Socket.IO Support proxy_http_version 1.1; proxy_set_header Upgrade$http_upgrade; proxy_set_header Connection "upgrade";
}
}
Note that upstream and backend have to match, which is then referenced in the proxy_pass line. With that, Varnish should handle all WebSocket traffic destined for NodeBB. Note that this is not just for NodeBB, but for all NodeJS applications.
The hwinfo command is a very handy command line tool that can be used to probe for details about hardware components. It reports information about most hardware units like cpu, hdd controllers, usb controllers, network card, graphics cards, multimedia, printers etc.
Hwinfo depends on the libhd library to gather hardware information which depends on libhal.
Hwinfo is available in the repositories of Ubuntu and Debian.
$ sudo hwinfo --short --storage
storage:
                       Intel 82801H (ICH8 Family) 4 port SATA IDE Controller
                       Intel 82801H (ICH8 Family) 2 port SATA IDE Controller
                       JMicron JMB368 IDE controller
7. USB devices and controllers
$ sudo hwinfo --short --usb
mouse:
  /dev/input/mice      Microsoft Basic Optical Mouse v2.0
hub:
                       Linux 3.11.0-12-generic uhci_hcd UHCI Host Controller
                       Linux 3.11.0-12-generic uhci_hcd UHCI Host Controller
                       Linux 3.11.0-12-generic uhci_hcd UHCI Host Controller
                       Linux 3.11.0-12-generic uhci_hcd UHCI Host Controller
                       Linux 3.11.0-12-generic uhci_hcd UHCI Host Controller
                       Linux 3.11.0-12-generic ehci_hcd EHCI Host Controller
                       Linux 3.11.0-12-generic ehci_hcd EHCI Host Controller
8. Display multiple devices together
To display multiple hardware units together, just add all the options
$ sudo hwinfo --short --usb --cpu --block
cpu:
                       Intel(R) Core(TM)2 Quad CPU    Q8400  @ 2.66GHz, 2000 MHz
                       Intel(R) Core(TM)2 Quad CPU    Q8400  @ 2.66GHz, 2666 MHz
                       Intel(R) Core(TM)2 Quad CPU    Q8400  @ 2.66GHz, 2666 MHz
                       Intel(R) Core(TM)2 Quad CPU    Q8400  @ 2.66GHz, 2000 MHz
mouse:
  /dev/input/mice      Microsoft Basic Optical Mouse v2.0
disk:
  /dev/sda             ST3500418AS
partition:
  /dev/sda1            Partition
  /dev/sda2            Partition
  /dev/sda5            Partition
  /dev/sda6            Partition
  /dev/sda7            Partition
  /dev/sda8            Partition
cdrom:
  /dev/sr0             SONY DVD RW DRU-190A
hub:
                       Linux 3.11.0-12-generic uhci_hcd UHCI Host Controller
                       Linux 3.11.0-12-generic uhci_hcd UHCI Host Controller
                       Linux 3.11.0-12-generic uhci_hcd UHCI Host Controller
                       Linux 3.11.0-12-generic uhci_hcd UHCI Host Controller
                       Linux 3.11.0-12-generic uhci_hcd UHCI Host Controller
                       Linux 3.11.0-12-generic ehci_hcd EHCI Host Controller
                       Linux 3.11.0-12-generic ehci_hcd EHCI Host Controller
9. Log information to a file
The hwinfo has an option to log all data to a file. The following command will log detailed information about all hardware units to a text file.
$ hwinfo --all --log hardware_info.txt
To log short information in addition to the detailed information, add the "short" option too. Not sure if it is supposed to work like that.
The top command is one of the most useful commands for getting a quick glimpse into how your Unix server is performing, but stopping there might mean that you're missing out on a lot of interesting options.
April 13, 2014, 2:12 PM— The top command provides a quick glimpse into how a Unix system is performing. It highlights the processes that are using most of your CPU cycles, givs you an idea how much memory is in use, and even provides some data that can tell you whether performance is getting better or worse. Still, there are a number of options that you may have never tried that can help you find the answers you are looking for more quickly. One option is to use the top command to display tasks for just a single user. To do this, just follow the top command with the -u option and the username of the particular user. This will let you focus on what that user is doing on the system.
PID USER PR NI VIRT RES SHR S %CPU %MEM TIME+ COMMAND 7996 mjones 25 0 2052m 697m 1084 R 63.0 34.4 653:47 bash 8564 mjones 16 0 4784 392 384 S 0.0 0.0 0:00.00 bash 8566 mjones 19 0 2444 988 760 S 0.0 0.0 215:26.19 top
You will see only the processes (and likely all of the processes) being run by that user. You can also use top to look at a single process and nothing else.
PID USER PR NI VIRT RES SHR S %CPU %MEM TIME+ COMMAND 22526 shs 15 0 4784 1476 1204 S 0.0 0.1 0:00.05 bash
While top's output is normally sorted on the %CPU usage column, you can instead sort it on some other column. To sort based on memory usage, for example, start top and then type M (a capital M). Typing a lowercase m will turn off or back on the display of memory statistics that appear at the top of your top output.
PID USER PR NI VIRT RES SHR S %CPU %MEM TIME+ COMMAND 7996 mjones 25 0 2052m 697m 1084 R 63.0 34.4 46852:58 bash 1927 root 10 -10 22524 21m 1740 S 0.0 1.1 0:00.02 iscmd12 1233 root 18 0 27052 12m 7440 S 0.0 0.6 0:00.43 httpd 18857 apache 17 0 27076 7184 2140 S 0.0 0.3 0:00.00 httpd
You can also select the column you would like to sort your top output on by selecting it from a list of options. To do this, once you've started top, press a capital O and you will see a list of options like that shown below.
Current Sort Field:  K  for window 1:Def
Select sort field via field letter, type any other key to return

  a: PID        = Process Id                        the TTY & WCHAN fields will violate
  b: PPID       = Parent Process Pid                strict ASCII collating sequence.
  c: RUSER      = Real user name                    (shame on you if WCHAN is chosen)
  d: UID        = User Id
  e: USER       = User Name
  f: GROUP      = Group Name
  g: TTY        = Controlling Tty
  h: PR         = Priority
  i: NI         = Nice value
  j: P          = Last used cpu (SMP)
* K: %CPU       = CPU usage
  l: TIME       = CPU Time
  m: TIME+      = CPU Time, hundredths
  n: %MEM       = Memory usage (RES)
  o: VIRT       = Virtual Image (kb)
  p: SWAP       = Non-resident size (kb)
  q: RES        = Resident size (kb)
  r: CODE       = Code size (kb)
  s: DATA       = Data+Stack size (kb)
  t: SHR        = Shared Mem size (kb)
  u: nFLT       = Page Fault count
  v: nDRT       = Dirty Pages count
  w: S          = Process Status
  x: COMMAND    = Command name/line
  y: WCHAN      = Sleeping in Function
  z: Flags      = Task Flags
Notice the * to the left of K: %CPU. This indicates which of the columns the information is being sorted on currently. Press another letter from the list and you will see the * move to a different line in your display. Then press return to see the data sorted on that column. If you are sufficiently empowered, you can also kill processes from top without exiting top. Just press a lower case k and you will be prompted first for the process you want to kill and then for the signal you want to use to kill it (the default is 15). You will see an "Operation not permitted" error if you don't have sufficient rights to kill the process that you've selected. Similarly, you can renice (i.e., change the nice setting) for a process by typing a lowercase r. You will then be prompted for the process ID of the process you want to renice and then the nice setting that you want to use instead.
PID to renice: 22720
and then ...
Renice PID 22720 to value: 10
If the system you are working on has more than one CPU, your top default display will combine the information on all CPUs into one line. To break this down by CPU instead, press a 1 while in top and your display will change to something like this:
The top command will normally run continuously, updating its display every few seconds. If you would prefer that it update less frequently, you can type a lowercase d and then, when being prompted, tell top how often (in seconds) you want to see the updates.
Change delay from 3.0 to: 10
If you want top to run through a limited set of iterations, you can provide this number when you start top. For example, if you want to see only two iterations, type top -n 2.
% top -n 2
You can also type a lowercase h to get a little help while running top and, of course, q to quit

 (Image from


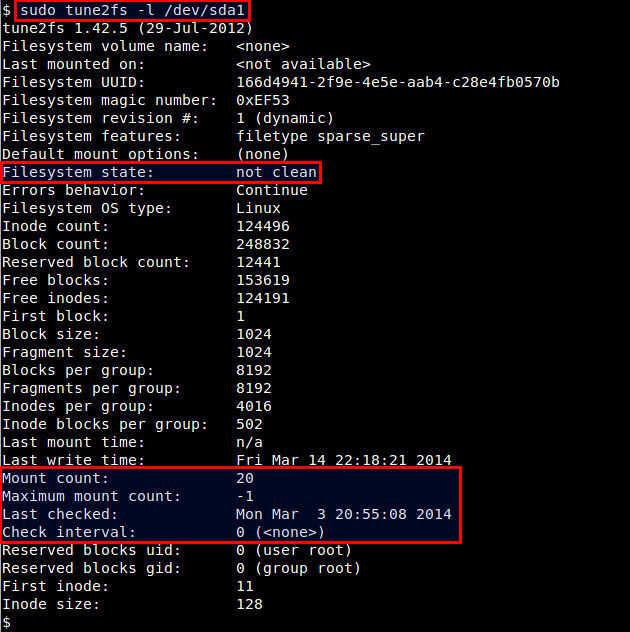
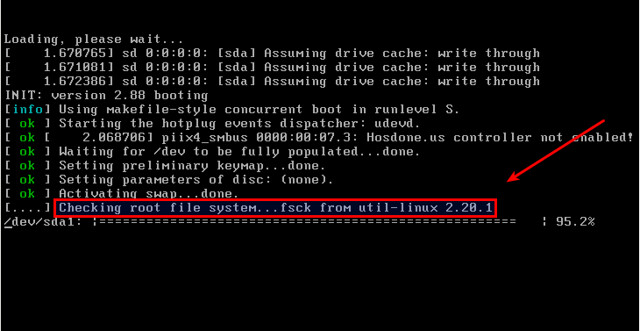


 Rather than using the domain admin account for authentication, I suggest enhancing security by creating a custom user who is a member of the Domains Admins group. On the Windows AD controller, go to Administrative Tools -> Active Directory Users and Computers. Expand the domain, select the Users folder, and click Create New Users. Fill in the details as required. Add the user to the Domain Admins group by clicking "Member of" and adding "Domain Admins". Click OK, and the user is ready.