Quantcast
Channel: Sameh Attia
Viewing all 1406 articles
Browse latest View live

10 Open Source Docker Tools You Should Be Using

$
0
0
http://blog.getcrane.com/10-open-source-docker-tools-you-should-be-using

Are you taking advantage of these essential open source Docker tools?
Crane-Website-Blog-Post
You may have heard of this thing called Docker. You know, the one which has fostered over 20,000 open source projects (including orchestration tools and management frameworks) and over 85,000 Dockerized applications?
But Docker is much more than an application platform.
In fact, the Open Source community offers a ton of tools that augment Docker that can be hugely valuable if you’re getting started. So we decided to round up the most useful open source Docker tools so that you can be sure that your business is taking advantage of all that Docker has to offer.
And for even more Docker development tools and tips you should know, you can subscribe to our weekly roundup of Docker news articles here.

10 Helpful Docker Tools For Developers

1) Kubernetes

Want the Swiss Army knife approach to Docker orchestration? If so, Google’s “Kubernetes” is your friend.
Google initially developed Kubernetes to help manage its own LXC containers - even before Docker! Kubernetes is great at managing workloads for Docker nodes and balancing container deployments across a cluster. Check it out - it provides ways for containers to communicate with each other without having to open network ports.
Kubernetes
Best of all, Google has open-sourced Kubernetes. If you haven’t already tried Kubernetes, follow the steps in the Kubernetes Github Getting Started guides to get up and running. Keep in mind that Kubernetes is an industrial strength Docker orchestration tool, with accompanying industrial strength complexity, so you’d be advised to keep your use cases quite simple at first.
Watch Kubernetes on Github:

2) Dockersh

Developed by Yelp as part of its testing and service management infrastructure suite, Dockersh works by allowing each user to have their own individual Docker container (a bit like a lightweight VM). Users are able to see their own home directory and make changes to it, but they can only see their own processes and have their own network stack.
dockersh-and-a-brief-intro-to-the-docker-internals-11-638
With the obvious worries over security that come with giving users shell access, the jury is definitely out over whether you would want to run Dockersh in production.
Even Yelp themselves do not use dockersh in production, but the concept demonstrates how the developer ecosystem is innovating with Docker, and the project remains one to watch.
Watch Dockersh on Github:

3) Prometheus

Want better insight into how healthy your microservices are? Just run Soundcloud's open source monitoring tool, Prometheus.
Soundcloud adopted a microservices architecture when it became clear that the monolithic Ruby on Rails application that it had first built in 2007 could not perform reliably under web scale traffic.
promdash_event_processor-1b82c8fbde0e1e14a1cae7dec0fef29b
With a microservices architecture, interrelated processes are divided into smaller logic domains. As an application scales up, new processes are spawned, rather than entire blocks of functionality.
However, when you're running hundreds or even thousands of microservices, its difficult to monitor the statuses of aggregate jobs. Because of this, you lose visibility of where bottlenecks are occurring and how to fix them.
Prometheus is aimed at solving this problem. Here's an overview of how Prometheus can help you, straight from the Soundcloud team.
Watch Prometheus on Github:

4) Docker Compose

If you want to define and run complex applications using Docker, it might make sense to use a tool like Docker Compose, Docker's orchestration product.
B4BlZr6IMAAhAKx
If you have yet to try it, here's how it works: after you've written your Dockerfile, you write a simple docker-compose.yml file that lists the Docker containers your app needs, and then run docker-compose up. Compose will then start and run your app.
Its worth bearing in mind that Docker Compose (previously known as Fig) does not support remote orchestration, meaning that it is only possible to orchestrate an infrastructure on a single host. If you want to scale an app to multiple servers, you will need more involved tools such as Kubernetes.
Watch Docker Compose on Github:

5) Kitematic

If you're looking for a desktop developer environment for using Docker on Mac OS X, you'll want to take a look at Kitematic. Kitematic helps you run Docker images, spin them up and manage them in the same way as you would in VMWare Workstation.
empty-images.027c
Kitematic, now acquired by Docker, can also help you access environment variables, container logs, provide shell access to containers and restart containers. Keep in mind that Kitematic is still evolving as a project, so one or two breaking fixes have occurred in its history - as well as conflicts with other tools.
Watch Kitematic on Github:

6) Logspout

In addition to Kitematic, Logspout can be a great tool for helping you manage logs generated by programs running inside Docker containers. It enables you to route container-app logs to a single location, such as a JSON object or a streamed endpoint available over HTTP.
2fbde119-22fc-e745-33c8-57ed6a2528e4
Logspout is currently limited to stdout and stderr because of Docker's logging API, but with more hooks planned in time, this will likely increase.
The introduction of structured header data, planned for a future release, will allow Logspout to be integrated with tools such as Logentries.
Watch Logspout on Github:

7) Flocker

Flocker is an enterprise-grade data volume manager and multi-host cluster management tool - and what's more, it's free. If you've tried to build a production system with containers, you've probably run into the "stateful" problem. What do you do about the stateful parts of the app - areas such as backups, disaster recovery and compliance - which typically occur outside of the Docker environment.
flocker-architecture-diagram
Thinking about bringing Docker into production but really want a way of managing your data in a containerized way? Give Flocker a try.
Watch Flocker on Github:

8) Weave

Looking to connect Docker containers on a virtual network across many data center environments? Then you'll be interested in Weave
Weave is a container-specific implementation of software-defined networking across data centers, and caters mainly to network admins looking to deploy complex applications that span multiple servers.
Since its launch last September, it's become one of the most popular Docker-related projects on Github.
Watch Weave on Github:

9) Powerstrip

Powerstrip enables you to build prototypes of Docker extensions. Once set up, you can compose adapters such as Flocker and Weave alongside your chosen orchestration framework, without having to rebuild Docker each time.
For instance, you can run the distributed data application Crate.io alongside Flocker, Weave and Powerstrip. This is great if you want to run multiple services together without wrapping the Docker API.
Watch Powerstrip on Github:

10) Helios

As enterprises are looking to run large volumes of containerized backend services in production, orchestration frameworks such as Helios will become critical. Developed internally as Docker was beginning to gain traction, Spotify use Helios to ensure that hundreds of microservices across several thousand servers work as they should.
heliospic
One of the killer features of Helios is the ability to recognize when a "container is dead." If someone accidentally shuts down a mission critical container, Helios can be figured to recognize and instantly load one back up.
Although there are now other orchestration frameworks around, Helios has established a strong track record for operating at scale, and is one of the most watched projects on Github.

8 excellent open source data visualization tools

$
0
0
http://opensource.com/life/15/6/eight-open-source-data-visualization-tools

Image by : 
opensource.com
Data visualization is the mechanism of taking tabular or spatial data and conveying it in a human-friendly and visual way. There are several open source tools that can help you create useful, informative graphs. In this post we will take a look at eight open source, data visualization tools.

Datawrapper

Datawrapper
Datawrapper was created by journalism organizations from Europe, designed to make data visualization easy for news institutes. Based on a web based GUI (graphics user interface), it promises to let you create a graph in just four steps.
To create a graph, click on the "New Chart" link on the top menu bar. You can then paste your data in the text area; then, the tool analyzes it and shows you the preview. If everything is fine, you can publish it. Datawrapper is fully open source, and you can download it from their GitHub page and host it yourself. It is also available as a cloud hosted, paid service on their website.

Image provided by Nitish Tiwari. Source.

Chart JS

Chart JS is a clean charting library. Before you can create a chart, you'll need to include the library in your frontend code. Once done, you can use the API from the library to add charts and assign values. More technical details are available here. This is a good option for people who need precise control over look and feel of their charts, but if you don't want to get your hands dirty with the code, this is probably not the best option for you.

Charted

Created by the product science team at Medium, this is one of most minimal charting tools available online. You can just paste a link of a Google spreadsheet or a .csv file (input data) and tool create a chart with the data. Charted fetches the data every 30 minutes, making sure the chart is up-to-date. Although available freely online, you can host your own version by using the code.

Image provided by Nitish Tiwari. Source.

D3

D3 stands for data driven documents. This is a JavaScript library to help you bind random data to the DOM (document object model) and apply data-driven transformations to the document. As many of you may be aware, DOM is a programming API that allows programmers to access documents as objects, and these objects closely represent the document structure they model. D3 provides APIs that can be applied to DOM elements and transform the resulting HTML, SVG, or CSS documents. But again, this method may appeal to programmers more than average users because it involves writing code to create graphs.

Image provided by Nitish Tiwari. Source.

Dygraphs

Dygraphs is a flexible, JavaScript-based charting library. The main attraction of Dygraphs is that it can handle huge data sets and produce output that is interactive for the end-users. It requires some level of web programming background to get started with a chart, but it is easier to use than the previous libraries mentioned in this article. Take a look at the example gallery to learn more about its capabilities.

Image provided by Nitish Tiwari. Source.

Raw

Raw is a web-based tool that allows you to simply paste your data and create graphs in few simple steps. Built on the D3.js library, it is extremely easy to use and packs all the goodness of D3 into a format that is ready to be used by non-programmers. You can choose to use the free web hosted tool, or fork the project on GitHub and host it behind your firewall.

Timeline

Every once in a while, you face a situation that requires you to display events as sequential timelines. This tool, Timeline, helps you achieve this. To create timelines, all you need to do is format your data, like in this example template. Once you have the data formatted in a Google spreadsheet, use Timeline's generator to publish it. That's it! You have the embed code available now and can use it to embed the timeline in web pages. Here is a video tutorial to make it even easier.

Leaflet

Mobile readiness is the key to high traffic and good conversion rates. Leaflet is a lightweight, mobile friendly JavaScript library to help you create interactive maps. Leaflet is designed with simplicity, performance, and usability in mind. It works across all major desktop and mobile platforms out of the box, taking advantage of HTML5 and CSS3 on modern browsers while still being accessible on older ones. It can be extended with a huge number of plugins, has a beautiful, easy to use, and well-documented API and a simple, readable source code that is a joy to contribute to.
I hope this list helps you find the solution best suited for your needs. If you are interested in more data visualization tools, take a look at this list of more than 50 tools.
Do you have a favorite tool that should have made the list? We would love to hear from you—let us know your thoughts in the comments below.

Jailhouse

$
0
0
http://www.linuxjournal.com/content/jailhouse

Because you're a reader of Linux Journal, you probably already know that Linux has a rich virtualization ecosystem. KVM is the de facto standard, and VirtualBox is widely used for desktop virtualization. Veterans should remember Xen (it's still in a good shape, by the way), and there is also VMware (which isn't free but runs on Linux as well). Plus, there are many lesser-known hypervisors like the educational lguest or hobbyist Xvisor. In such a crowded landscape, is there a place for a newcomer?
There likely is not much sense in creating yet another Linux-based "versatile" hypervisor (other than doing it just for fun, you know). But, there are some specific use cases that general-purpose solutions just don't address quite well. One such area is real-time virtualization, which is frequently used in industrial automation, medicine, telecommunications and high-performance computing. In these applications, dedicating a whole CPU or its core to the software that runs bare metal (with no underlying OS) is a way to meet strict deadline requirements. Although it is possible to pin a KVM instance to the processor core and pass through PCI devices to guests, tests show the worst-case latency may be above some realistic requirements (see Resources).
As usual with free software, the situation is getting better with time, but there is one other thing—security. Sensitive software systems go through rigorous certifications (like Common Criteria) or even formal verification procedures. If you want them to run virtualized (say, for consolidation purposes), the hypervisor must isolate them from non-certifiable workloads. This implies that the hypervisor itself must be small enough; otherwise, it may end up being larger (and more "suspicious") than the software it segregates, thus devastating the whole idea of isolation.
So, it looks like there is some room for a lightweight (for the real-time camp), small and simple (for security folks) open-source Linux-friendly hypervisor for real-time and certifiable workloads. That's where Jailhouse comes into play.

New Guy on the Block

Jailhouse was born at Siemens and has been developed as a free software project (GPLv2) since November 2013. Last August, Jailhouse 0.1 was released to the general public. Jailhouse is rather young and more of a research project than a ready-to-use tool at this point, but now is a good time to become acquainted it and be prepared to meet it in production.
From the technical point of view, Jailhouse is a static partitioning hypervisor that runs bare metal but cooperates closely with Linux. This means Jailhouse doesn't emulate resources you don't have. It just splits your hardware into isolated compartments called "cells" that are wholly dedicated to guest software programs called "inmates". One of these cells runs the Linux OS and is known as the "root cell". Other cells borrow CPUs and devices from the root cell as they are created (Figure 1).
Figure 1. A visualization of Linux running-bare metal (a) and under the Jailhouse hypervisor (b) alongside a real-time application. (Image from Yulia Sinitsyna; Tux image from Larry Ewing.)
Besides Linux, Jailhouse supports bare-metal applications, but it can't run general-purpose OSes (like Windows or FreeBSD) unmodified. As mentioned, there are plenty of other options if you need that. One day Jailhouse also may support running KVM in the root cell, thus delivering the best of both worlds.
As mentioned previously, Jailhouse cooperates closely with Linux and relies on it for hardware bootstrapping, hypervisor launch and doing management tasks (like creating new cells). Bootstrapping is really essential here, as it is a rather complex task for modern computers, and implementing it within Jailhouse would make it much more complex. That being said, Jailhouse doesn't meld with the kernel as KVM (which is a kernel module) does. It is loaded as a firmware image (the same way Wi-Fi adapters load their firmware blobs) and resides in a dedicated memory region that you should reserve at Linux boot time. Jailhouse's kernel module (jailhouse.ko, also called "driver") loads the firmware and creates /dev/jailhouse device, which the Jailhouse userspace tool uses, but it doesn't contain any hypervisor logic.
Jailhouse is an example of Asynchronous Multiprocessing (AMP) architecture. Compared to traditional Symmetric Multiprocessing (SMP) systems, CPU cores in Jailhouse are not treated equally. Cores 0 and 1 may run Linux and have access to a SATA hard drive, while core 2 runs a bare-metal application that has access only to a serial port. As most computers Jailhouse can run on have shared L2/L3 caches, this means there is a possibility for cache thrashing. To understand why this happens, consider that Jailhouse maps the same guest physical memory address (GPA) to a different host (or real) physical address for different inmates. If two inmates occasionally have the same GPA (naturally containing diverse data) in the same L2/L3 cache line due to cache associativity, they will interfere with each other's work and degrade the performance. This effect is yet to be measured, and Jailhouse currently has no dedicated means to mitigate it. However, there is a hope that for many applications, this performance loss won't be crucial.
Now that you have enough background to understand what Jailhouse is (and what it isn't), I hope you are interested in learning more. Let's see how to install and run it on your system.

Getting Up to Date

Sometimes you may need the very latest KVM and QEMU to give Jailhouse a try. KVM is part of the kernel, and updating the critical system component just to try some new software probably seems like overkill. Luckily, there is another way.
kvm-kmod is a tool to take KVM modules from one kernel and compile them for another, and it usually is used to build the latest KVM for your current kernel. The build process is detailed in the README, but in a nutshell, you clone the repository, initialize a submodule (it's the source for KVM), and run the configure script followed by make. When the modules are ready, just insmod them instead of what your distribution provides (don't forget to unload those first). If you want the change to be permanent, run make modules_install. kvm-kmod can take the KVM sources from wherever you point to, but the defaults are usually sufficient.
Compiling QEMU is easier but more time consuming. It follows the usual configure && make procedure, and it doesn't need to be installed system-wide (which is package manager-friendly). Just put /path/to/qemu/x86_64-softmmu/qemu-system-x86_64 instead of plain qemu-system-x86_64 in the text's examples.

Building Jailhouse

Despite having a 0.1 release now, Jailhouse still is a young project that is being developed at a quick pace. You are unlikely to find it in your distribution's repositories for the same reasons, so the preferred way to get Jailhouse is to build it from Git.
To run Jailhouse, you'll need a recent multicore VT-x-enabled Intel x86 64-bit CPU and a motherboard with VT-d support. By the time you read this article, 64-bit AMD CPUs and even ARM (v7 or better) could be supported as well. The code is already here (see Resources), but it's not integrated into the mainline yet. At least 1GB of RAM is recommended, and even more is needed for the nested setup I discuss below. On the software side, you'll need the usual developer tools (make, GCC, Git) and headers for your Linux kernel.
Running Jailhouse on real hardware isn't straightforward at this time, so if you just want to play with it, there is a better alternative. Given that you meet CPU requirements, the hypervisor should run well under KVM/QEMU. This is known as a nested setup. Jailhouse relies on some bleeding-edge features, so you'll need at least Linux 3.17 and QEMU 2.1 for everything to work smoothly. Unless you are on a rolling release distribution, this could be a problem, so you may want to compile these tools yourself. See the Getting Up to Date sidebar for more information, and I suggest you have a look at it even if you are lucky enough to have the required versions pre-packaged. Jailhouse evolves and may need yet unreleased features and fixes by the time you read this.
Make sure you have nested mode enabled in KVM. Both kvm-intel and kvm-amd kernel modules accept the nested=1parameter, which is responsible just for that. You can set it manually, on the modprobe command line (don't forget to unload the previous module's instance first). Alternatively, add options kvm-intel nested=1 (or the similar kvm-amd line) to a new file under /etc/modprobe.d.
You also should reserve memory for Jailhouse and the inmates. To do this, simply add memmap=66M$0x3b000000 to the kernel command line. For one-time usage, do this from the GRUB menu (press e, edit the command line and then press F10). To make the change persistent, edit the GRUB_CMDLINE_LINUX variable in /etc/default/grub on the QEMU guest side and regenerate the configuration with grub-mkconfig.
Now, make a JeOS edition of your favorite distribution. You can produce one with SUSE Studio, ubuntu-vm-builder and similar, or just install a minimal system the ordinary way yourself. It is recommended to have the same kernel on the host and inside QEMU. Now, run the virtual machine as (Intel CPU assumed):

qemu-system-x86_64 -machine q35 -m 1G -enable-kvm -smp 4
↪-cpu kvm64,-kvm_pv_eoi,-kvm_steal_time,-kvm_asyncpf,
↪-kvmclock,+vmx,+x2apic -drive
↪file=LinuxInstallation.img,id=disk,if=none
↪-virtfs local,path=/path/to/jailhouse,
↪security_model=passthrough,mount_tag=host
↪-device ide-hd,drive=disk -serial stdio
↪-serial file:com2.txt
Note, I enabled 9p (-virtfs) to access the host filesystem from the QEMU guest side; /path/to/jailhouse is where you are going to compile Jailhouse now. cd to this directory and run:

git clone git@github.com:siemens/jailhouse.git jailhouse
cd jailhouse
make
Now, switch to the guest and mount the 9p filesystem (for example, with mount -t 9p host /mnt). Then, cd to /mnt/jailhouse and execute:

sudo make firmware_install
sudo insmod jailhouse.ko
This copies the Jailhouse binary image you've built to /lib/firmware and inserts the Jailhouse driver module. Now you can enable Jailhouse with:

sudo tools/jailhouse enable configs/qemu-vm.cell
As the command returns, type dmesg | tail. If you see "The Jailhouse is opening." message, you've successfully launched the hypervisor, and your Linux guest now runs under Jailhouse (which itself runs under KVM/QEMU). If you get an error, it is an indication that your CPU is missing some required feature. If the guest hangs, this is most likely because your host kernel or QEMU are not up to date enough for Jailhouse, or something is wrong with qemu-vm cell config. Jailhouse sends all its messages to the serial port, and QEMU simply prints them to the terminal where it was started (Figure 2). Look at the messages to see what resource (I/O port, memory and so on) caused the problem, and read on for the details of Jailhouse configuration.
Figure 2. A typical configuration issue: Jailhouse traps "prohibited" operation from the root cell.

Configs and Inmates

Creating Jailhouse configuration files isn't straightforward. As the code base must be kept small, most of the logic that takes place automatically in other hypervisors must be done manually here (albeit with some help from the tools that come with Jailhouse). Compared to libvirt or VirtualBox XML, Jailhouse configuration files are very detailed and rather low-level. The configuration currently is expressed in the form of plain C files (found under configs/ in the sources) compiled into raw binaries; however, another format (like DeviceTree) could be used in future versions.
Most of the time, you wouldn't need to create a cell config from scratch, unless you authored a whole new inmate or want the hypervisor to run on your specific hardware (see the Jailhouse for Real sidebar).
Cell configuration files contain information like hypervisor base address (it should be within the area you reserved with memmap= earlier), a mask of CPUs assigned to the cell (for root cells, it's 0xff or all CPUs in the system), the list of memory regions and the permissions this cell has to them, I/O ports bitmap (0 marks a port as cell-accessible) and the list of PCI devices.
Each Jailhouse cell has its own config file, so you'll have one config for the root cell describing the platform Jailhouse executes on (like qemu-vm.c, as you saw above) and several others for each running cell. It's possible for inmates to share one config file (and thus one cell), but then only one of these inmates will be active at a given time.
In order to launch an inmate, you need to create its cell first:

sudo tools/jailhouse cell create configs/apic-demo.cell
apic-demo.cell is the cell configuration file that comes with Jailhouse (I also assume you still use the QEMU setup described earlier). This cell doesn't use any PCI devices, but in more complex cases, it is recommended to unload Linux drivers before moving devices to the cell with this command.
Now, the inmate image can be loaded into memory:

sudo tools/jailhouse cell load apic-demo
↪inmates/demos/x86/apic-demo.bin -a 0xf0000 
Jailhouse treats all inmates as opaque binaries, and although it provides a small framework to develop them faster, the only thing it needs to know about the inmate image is its base address. Jailhouse expects an inmate entry point at 0xffff0 (which is different from the x86 reset vector). apic-demo.bin is a standard demo inmate that comes with Jailhouse, and the inmate's framework linker script ensures that if the binary is mapped at 0xf0000, the entry point will be at the right address. apic-demo is just a name; it can be almost anything you want.
Finally, start the cell with:
sudo tools/jailhouse cell start apic-demo Now, switch back to the terminal from which you run QEMU. You'll see that lines like this are being sent to the serial port:
Calibrated APIC frequency: 1000008 kHz Timer fired, jitter: 38400 ns, min: 38400 ns, max: 38400 ns ... apic-demo is purely a demonstrational inmate. It programs the APIC timer (found on each contemporary CPU's core) to fire at 10Hz and measures the actual time between the events happening. Jitter is the difference between the expected and actual time (the latency), and the smaller it is, the less visible (in terms of performance) the hypervisor is. Although this test isn't quite comprehensive, it is important, as Jailhouse targets real-time inmates and needs to be as lightweight as possible.
Jailhouse also provides some means for getting cell statistics. At the most basic level, there is the sysfs interface under /sys/devices/jailhouse. Several tools exist that pretty-print this data. For instance, you can list cells currently on the system with:
sudo tools/jailhouse cell list The result is shown in Figure 3. "IMB-A180" is the root cell's name. Other cells also are listed, along with their current states and CPUs assigned. The "Failed CPUs" column contains CPU cores that triggered some fatal error (like accessing an unavailable port or unassigned memory region) and were stopped.
Figure 3. Jailhouse cell listing—the same information is available through the sysfs interface.
For more detailed statistics, run:
sudo tools/jailhouse cell stat apic-demo You'll see something akin to Figure 4. The data is updated periodically (as with the top utility) and contains various low-level counters like the number of hypercalls issued or I/O port accesses emulated. The lifetime total and per-second values are given for each entry. It's mainly for developers, but higher numbers mean the inmate causes hypervisor involvement more often, thus degrading the performance. Ideally, these should be close to zero, as jitter in apic-demo. To exit the tool, press Q.
Figure 4. Jailhouse cell statistics give an insight into how cells communicate with the hypervisor.

Tearing It Down

Jailhouse comes with several demo inmates, not only apic-demo. Let's try something different. Stop the inmate with:
sudo tools/jailhouse cell destroy apic-demo JAILHOUSE_CELL_DESTROY: Operation not permitted What's the reason for this? Remember the apic-demo cell had the "running/locked" state in the cell list. Jailhouse introduces a locked state to prevent changes to the configuration. A cell that locks the hypervisor is essentially more important than the root one (think of it as doing some critical job at a power plant while Linux is mostly for management purposes on that system). Luckily, apic-demo is a toy inmate, and it unlocks Jailhouse after the first shutdown attempt, so the second one should succeed. Execute the above command one more time, and apic-demo should disappear from the cell listing.
Now, create tiny-demo cell (which is originally for tiny-demo.bin, also from the Jailhouse demo inmates set), and load 32-bit-demo.bin into it the usual way:
sudo tools/jailhouse cell create configs/tiny-demo.cell sudo tools/jailhouse cell load tiny-demo ↪inmates/demos/x86/32-bit-demo.bin -a 0xf0000 sudo tools/jailhouse cell start tiny-demo Look at com2.txt in the host (the same directory you started QEMU from). Not only does this show that cells can be re-used by the inmates provided that they have compatible resource requirements, it also proves that Jailhouse can run 32-bit inmates (the hypervisor itself and the root cell always run in 64-bit mode).
When you are done with Jailhouse, you can disable it with:
sudo tools/jailhouse disable For this to succeed, there must be no cells in "running/locked" state.
This is the end of our short trip to the Jailhouse. I hope you enjoyed your stay. For now, Jailhouse is not a ready-to-consume product, so you may not see an immediate use of it. However, it's actively developed and somewhat unique to the Linux ecosystem, and if you have a need for real-time application virtualization, it makes sense to keep a close eye on its progress.

Jailhouse for Real

QEMU is great for giving Jailhouse a try, but it's also possible to test it on real hardware. However, you never should do this on your PC. With a low-level tool like Jailhouse, you easily can hang your root cell where Linux runs, which may result in filesystem and data corruption.
Jailhouse comes with a helper tool to generate cell configs, but usually you still need to tweak the resultant file. The tool depends on Python; if you don't have it on your testing board, Jailhouse lets you collect required data and generate the configuration on your main Linux PC (it's safe):
sudo tools/jailhouse config collect data.tar # Copy data.tar to your PC or notebook and untar tools/jailhouse config create -r path/to/untarred/data ↪configs/myboard.c The configuration tool reads many files under /proc and /sys (either collected or directly), analyzes them and generates memory regions, a PCI devices list and other things required for Jailhouse to run.
Post-processing the generated config is mostly a trial-and-error process. You enable Jailhouse and try to do something. If the system locks up, you analyze the serial output and decide if you need to grant access. If you are trying to run Jailhouse on a memory-constrained system (less than 1GB of RAM), be careful with the hypervisor memory area, as the configuration tool currently can get it wrong. Don't forget to reserve memory for Jailhouse via the kernel command line the same way you did in QEMU. On some AMD-based systems, you may need to adjust the Memory Mapped I/O (MMIO) regions, because Jailhouse doesn't support AMD IOMMU technology yet, although the configuration tool implies it does.
To capture Jailhouse serial output, you'll likely need a serial-to-USB adapter and null modem cable. Many modern motherboards come with no COM ports, but they have headers you can connect a socket to (the cabling is shown in Figure a). Once you connect your board to the main Linux PC, run minicom or similar to see the output (remember to set the port's baud rate to 115200 in the program's settings).
Figure a. A must-have toolkit to run Jailhouse bare metal: serial-to-USB converter, null modem cable (attached) and mountable COM port. (Image from Yulia Sinitsyna.)

Resources

Static System Partitioning and KVM (KVM Forum 2013 Slides): https://docs.google.com/file/d/0B6HTUUWSPdd-Zl93MVhlMnRJRjg
kvm-kmod: http://git.kiszka.org/?p=kvm-kmod.git
Jailhouse AMD64 Port: https://github.com/vsinitsyn/jailhouse/tree/amd-v
Jailhouse ARM Port: https://github.com/siemens/jailhouse/tree/wip/arm
 

Command Line Arguments in Linux Shell Scripting

$
0
0
http://www.linuxtechi.com/command-line-arguments-in-linux-shell-scripting

Overview :

Command line arguments (also known as positional parameters) are the arguments specified at the command prompt with a command or script to be executed. The locations at the command prompt of the arguments as well as the location of the command, or the script itself, are stored in corresponding variables. These variables are special shell variables. Below picture will help you understand them.
command-line-arguments
command-line-shell-variables
Let’s create a shell script with name “command_line_agruments.sh”, it will show the command line argruments that were supplied and count number of agruments, value of first argument and Process ID (PID) of the Script.
linuxtechi@localhost:~$ cat command_line_agruments.sh
command-line-agruments
Assign Executable permissions to the Script
linuxtechi@localhost:~$ chmod +x command_line_agruments.sh
Now execute the scripts with command line argruments
linuxtechi@localhost:~$ ./command_line_agruments.sh Linux AIX HPUX VMware
There are 4 arguments specified at the command line.
The arguments supplied are: Linux AIX HPUX VMware
The first argument is: Linux
The PID of the script is: 16316
Shifting Command Line Arguments
The shift command is used to move command line arguments one position to the left. During this move, the first argument is lost. “command_line_agruments.sh” script below uses the shift command:
linuxtechi@localhost:~$ cat command_line_agruments.sh
command-line-agrument-shift
Now Execute the Script again.
linuxtechi@localhost:~$ ./command_line_agruments.sh Linux AIX HPUX VMware
There are 4 arguments specified at the command line
The arguments supplied are: Linux AIX HPUX VMware
The first argument is: Linux
The Process ID of the script is: 16369
The new first argument after the first shift is: AIX
The new first argument after the second shift is: HPUX
linuxtechi@localhost:~$
Multiple shifts in a single attempt may be performed by furnishing the desired number of shifts to the shift command as an argument.

Starting Your Linux Career: 10 Steps

$
0
0
http://funwithlinux.net/2015/06/starting-your-linux-career-ten-steps

I cannot lie: learning Linux took a lot of time.  I spent approximately 3 years as a daily linux user before landing my first full-time Linux-based position.  However, my time was not as well spent as it could have been.  Knowing then what I know now (and what I’m attempting to share with you), I could have been in a Linux position within 6 months.
Like many, my first experiences with Linux were of my own curiosity.  I was a Microsoft Windows Vista user at the time, and overall, very happy with the experience.  I had previously tried Ubuntu with marginal success; drivers in those days were much less readily available for hardware as they are today.  One of my work friends turned me onto Ultimate Edition, an Ubuntu based distro, which was essentially a DVD jam packed with some of the better software and all of the non-free drivers my system needed out of the box.  I was dazzled by the desktop effects that I was able to use, and I quickly found the platform suitable for web development.

Step 1: Use Linux Every Day

Install Linux on your primary computing device, be it laptop or desktop.  Dual booting with the current operating system is fine, but you should be booting into Linux 90% of the time or more.  I’m sure there will be things that you cannot do on Linux.  If you play PC games, that will be the biggest barrier to your entry.  However, this article is not about gaming on Linux, it’s about getting a job.  Use some of that time you set aside for gaming for using Linux.  I suggest you start with Debian as your distribution.

Step 2: Do Practical Things on Linux

In addition to using Linux for every day computer tasks (web, email, etc), you should also be doing things that are practical from a job standpoint.  These are installing packages from the command line, learning iptables, editing system configurations from the command line, just to name a few.  I often assign friends “homework” when they ask me about Linux.  I suggest getting a WordPress site up and running on your machine using only the command line.  Wordpress is free blogging software used by this site and millions of others.  You will be learning many valuable skills deploying WordPress on Linux:  Apache Web Server, MySQL, and PHP.  You’ll also learn basic file permissions.

Step 3: Do Fun Things on Linux

You’re more likely to continue using Linux if you enjoy it.  Try following a few tutorials for GIMP or InkScape if you like making images.  There are also some free music composing and video editing software packages available for you to try as well.  Some of the simple games available in the package repositories are fun as well.

Step 4: Scripting, Cron Jobs, iptables

These may seem like daunting tasks to you.  They are not the easiest things to learn, but they are necessary.  You do not have to be the world’s best script writer to land a job, but you should at least be able to read and understand them, and to deploy simple automation scripts.

Step 5: Install CentOS or Fedora

Now that you’ve been using Debian for a while, switch over to CentOS (6 or 7) or Fedora (for more advanced users).  These are both excellent distributions, and are very close to Red Hat Linux, which as you may know, is the most widely used Linux distribution for business; in fact, both of these are now Red Hat projects.  If you have the money laying around, you could even purchase Red Hat Linux for your desktop, though this is probably not necessary.  Now, repeat steps 1 to 4.  Knowing two of the biggest distros, their similarities and differences, will help you better understand Linux.

Step 6: What to Learn Next

If you’ve completed steps 1-5, you are probably already employable in a major metro area (in the US, at least).  You should at this time be looking at job boards online (indeed.com, dice.com, careerbuilder, monster, craigslist), and seeking out entry level positions in your location.  Look at some of the skills and knowledge they require.  Some common themes around my area:  KVM, Puppet, Chef, AWS (amazon web services), MySQL, Python, PHP, NoSQL, Hadoop.  Those are all associated primarily with Linux positions.  Knowing some of those technologies will improve your chances of success.  I really like Puppet, it’s easy to learn and deploy, though mastering Puppet is a specialty all it’s own.

Step 7: Perfecting Your Resume and Getting an Interview

Let’s get this out of the way:  No matter what a job listing says, a college degree is never required. If you have a degree, or are working towards one, great!
Let’s look at the following job requirements I found online for a “System Administrator”:
Primary customer contact for incoming technical services issues / Responds to telephone, email, and fax requests for technical support / Monitor and follow up with customers on open issues / Escalate customer issues and request assistance as appropriate / Serve as primary contact for after-hours support coverage on a rotating basis / Ability to travel to customer sites installations, upgrades, product demonstrations and training as required / Ensure that customer interactions are professional and demonstrate the highest possible level of service
Let’s talk about a few things in this posting.  Notice that MOST of the job description revolves around skills that are not directly computer related.  These are using the phone and email, and interacting with customers.  If you have held previous positions in an unrelated field, I’m quite certain you have some of these skills.  Put those on your resume!  They are highly relevant to employers of all types.
Now, let’s look at the “qualifications” section of that same posting:
Previous Red Hat Enterprise Linux (RHEL) required / Unix shell scripting / Knowledge and experience with SQL query language, Oracle RMAN, import/export, and flashback recovery / Logical Volume Manager (LVM).
Certifications – Preferred not required.
• Red Hat Certified System Administrator (RHCSA)
• Red Hat Certified Engineer (RHCE)
• HP-UX Certified System Administrator (HPCSA)
• Dell Online Self Dispatch (DOSD)
• Comptia A+, Network+, Security +, Linux +
If you followed my advice up to this point, you have the first 3 requirements met.  You probably also have a general understanding of computer hardware (if you don’t, checkout an A+ study guide from you local library and give it a good read.  Very informative).  Notice, there is no college requested, and certifications are preferred (we’ll touch on this later), not required.

Step 8:  Getting an Interview, part two

Okay, we’ve look at a job posting I found on indeed.com, and we’ve talked a little about it.  This posting looks like it was posted by the company actually doing the hiring.  In the computer field, more often than not, you will be contacted by recruiters from staffing companies, aka ‘head hunters.’  These guys are great.  They may be complete scams in other fields which lead to no job and a big waste of your time, but if you have Linux skills, you’re going to get phone calls and emails.
I’m going to share a secret with you: most jobs are not posted online.  That’s right, many jobs are not posted to the public.  Just like taking out an ad in a newspaper costs money, so does posting a job online.  What’s more, it requires a lot of time and skill to sort through the endless resume submissions and job applications that employers receive after posting a position online.  Unfortunately, the economy is not what it once was, and there are countless people submitting resumes and emails to positions that they are in no way qualified for.
I’m going to share another secret with you: putting your resume online is how you will be found.  You need to upload your resume and cover letter to careerbuilder and dice.  These resumes better say something about Linux on them.  I don’t care if you need to create a section called “Personal Experience” and document what you know there, you need to have something about your Linux skills on that resume.
Recruiting companies subscribe to these job sites and receive resumes.  They put these resumes into their database and match them to open positions with their clients.  They are not going to waste their time and contact you if you are not a good fit in their eyes.  Their salaries and reputation ride on finding good candidates for positions, and successfully getting them hired.  These recruiters will often have jobs that are not posted to online sites for the aforementioned reasons.

Step 9:  Getting an Interview, part three

In this part, I’m going to touch on a couple topics dealing with IT recruiters.  4 of my last 5 positions has been the result of placement by recruiting/staffing companies.  Here are some tips when dealing with recruiters.
Tip 1: Don’t be fooled.  Some recruiters don’t have an actual position for you.  These operate more like temp agencies in other fields.  Some tell-tale signs: “We want you to come in and take a personality/aptitude test.”  Don’t waste your time taking useless tests, this is a huge sign there isn’t a job for you here.
Tip 2: Don’t let them tell you that you are a good fit for “multiple positions that we have with clients” without explaining the positions.  This is another BS tactic by recruiters IF they cannot/will not elaborate via telephone on a specific position.  Typically, a recruiter will call you to get a brief work history (how many years experience, questions about working with specific technologies, scripting, etc).  After that phase, they will either say you are not a good fit for what they have, or they will start to describe the position in more detail.  If they jump straight to the “why don’t you come in and we can discuss future opportunities” or something along those lines, it’s probably not going to lead to a job.  Inform them you are only available to interview for a specific position, and you do not want to play round robin with their clients.
Tip 3 (Salary!): You can be firm with recruiters from staffing/recruiting companies.  They only get paid if you get paid.  If they have called or emailed you with position details, you should review the position.  If it’s to your liking, your next email/remark should be “What is the salary range for this position.”  If they say something like “Market rates” or “competitive”, don’t let them stop there (about 10% of the time have I found the salary to be ‘competive’, it usually means 10-20% below market).  Ask them again, like “Okay, but can you give me a specific range?”  It’s very, very difficult for them to dodge the question twice; they immediately get the hint: tell them the range, or I’m not going to move forward with the candidate.  Sometimes, they will beat you to the punch and ask you how much you are presently making.  A line I have been really successful with is “I’m not comfortable discussing that at this time.”  90% of the time, the recruiter will follow up with “Can you tell me how much you would be looking for to make a move?”  Now, the ball is in your court.  An entry level System Administrator position should be paying no less than $16/hr in a small town, to around $22/hr in a bigger city, or more.  This might not seem like a lot of money to you (or maybe it does), but your salary will be doubling or tripling in a few years if you continue to grow as an administrator.  In any case, you should be comfortable with the number you throw out there, and add a couple bucks an hour to it just to be on the safe side.  Typically, the recruiter will say something along the lines of: A) “I think we can do that”, B) “Oh, the range only goes up to X.  Are you flexible on compensation at all?” and C)  ”Yeah, we’re just too far off.”
For scenario A, hopefully you gave them a number you are comfortable with.  Nothing makes a company happier than hiring a motivated person below market rate.  Nothing makes a job seeker happier than making more money.  When these two align, it’s a great thing for both parties.  Don’t worry if you sold yourself a little short as long as you are happy with your position and compensation, that’s all that matters.
For scenario B, I’m a little on the fence.  On one hand, if it’s only $2/hr lower, and the position offers good experience and work life balance, maybe you should take it.  On the other hand, why can’t the company come up $2/hr for the right candidate.  Also, don’t forget, the recruiter is making a cut off your salary, so there might be some wiggle room, but typically not much.  If I asked for $20/hr and they countered with $18, I would be coy with them, but accept it conditionally, such as “If the position is a good fit and benefits are what I expect, I am a little flexible on the amount.”  This tells them that a) the salary is acceptable, b) you are not desperate.
For scenario C, this is a learning experience.  This is valuable market research.  You should try to figure out what that position is paying.  This will tell you one of two things:  The company hiring is a waste of your time, and you should not entertain offers from them in the future, or that your salary expectations are far above market rate in your area.
Honestly, I’ve encountered scenario C almost as often as the other two.  You would be surprised to learn the amounts of money I have asked for that seem completely ridiculous, and the recruiter has said “we can do that.”  I do this especially for jobs I’m not really interested in, just to gauge where the market is at.

Step 10:  The interview

You are almost there!  There are a lot of scenarios here, but I’ll touch on a few common ones.
Sometimes you’ll get a technical phone screen before a job interview.  Just be honest, listen to the questions, ask for clarification, and don’t sweat it if you miss one or two.  I don’t do in person interviews without a phone screen anymore, but that doesn’t really apply to entry level jobs.
The company is interviewing a lot of people in a few days.  This means that there are a lot of candidates for the job, but the hiring department has done a poor job narrowing down the selection process.  This is more like an audition than a hiring process.  These are not usually IT companies, these are companies that specialize in some other sector of the economy and have an IT department.  You will be second fiddle here, but it may provide good experience for your career.
The company is interviewing few people in 1-3 days.  This means they have carefully selected candidates (or there just weren’t that many), and you fit the bill on paper.  You will probably answer some technical questions during the interview, as well as the standard interview questions like “Why do you want to work here?”
Here are a few Q and A’s to help you out:
Q: Tell us about yourself
A:  I’m a daily linux user and enthusiast.  I’ve always been the IT guy in my family, and I enjoy helping people solve problems.  I started using Linux 6 months ago, and I love it!  I’m always trying to learn more, and I realized that the IT field is a good fit for me.
Q:  Why do you want to work here?
A:  This position looks like a good fit for me.  I have a lot to learn, but I think I would enjoy working here with your team.  I really enjoy solving problems and I think I Linux is the career path for me.
If you are asked if you have any questions, I like to (if not already covered), ask some variation of the following:
Is there any on call rotation (if it’s covered in the job description, ask specifics, like days and times)?  What will my primary shift be (you’d be surprised how often this is not covered up until this point.)?    And my personal favorite: Can you give me an example of a typical day that I would have while working here?
I feel that last question will give you a really good idea about the position and the culture of the company.  The responsibilities of the position and the day to day operation of the job can often be two completely different things.
You should not discuss compensation or other benefits such as time off during the interview process.  That should have been discussed with the recruiter or hiring staff before the interview, or after the interview in some situations.  Most of the time, the people in the interview have no idea what your compensation will be.

Thanks for Reading

These statements reflect my personal experience and opinions.  I hope I have been helpful in your job search; there is a lot of opportunity in the Linux field right now, but you do have to put forth considerable time and effort.  However, that time and effort will pay big dividends if you follow through.
I’m often asked what certification, if any, should a person obtain for Linux.  Hands down, I 100% Recommend Red Hat Linux certifications.  I have two myself, and they have been immensely helpful in my career.  Not only are they preferred by many employers (which has opened countless doors to me), I really did learn quite a bit while studying for them.  In addition, having a concrete goal, such as obtaining a certification, provided me with the discipline I needed to be proficient in many different skills.
I recommend Red Hat Certified System Administrator for anyone wishing to get a Linux certification.  There are others, and I’m sure they are useful, but most businesses use Red Hat, and therefor you will have a more marketable certification if you choose Red Hat.  I am in no way affiliated with Red Hat, though a friend of mine works for them and loves it, and I have worked with some of there recruiters for positions I did not elect to pursue at the time.
To study for a Red Hat Exam, you can attend one of their courses online or in person, or you can study on your own.  I chose to study on my own for the RHCSA, and with a Red Hat online course for the second (Open Stack).  I enjoyed both methods, but studying on my own took a lot of time and discipline.  I chose to purchase a study guide by Michael Jang.  It’s an excellent book, hopefully he has an edition out for RHEL 7 by now.

How to access SQLite database in Perl

$
0
0
http://xmodulo.com/access-sqlite-database-perl.html

SQLite is a zero-configuration, server-less, file-based transactional database system. Due to its lightweight, self-contained, and compact design, SQLite is an extremely popular choice when you want to integrate a database into your application. In this post, I am going to show you how to create and access a SQLite database in Perl script. The Perl code snippet I present is fully functional, so you can easily modify and integrate it into your project.

Preparation for SQLite Access

I am going to use SQLite DBI Perl driver to connect to SQLite3. Thus you need to install it (along with SQLite3) on your Linux system.

Debian, Ubuntu or Linux Mint

$ sudo apt-get install sqlite3 libdbd-sqlite3-perl

CentOS, Fedora or RHEL

$ sudo yum install sqlite perl-DBD-SQLite
After installation, you can check if the SQLite driver is indeed available by using the following script.
1
2
3
4
5
#!/usr/bin/perl
 
useDBI;
my@drv= DBI->available_drivers();
printjoin("\n", @drv), "\n";
If you run the script, you should see SQLite in the output.
DBM
ExampleP
File
Gofer
Proxy
SQLite
Sponge

Perl SQLite Access Example

Here is the full-blown Perl code example of SQLite access. This Perl script will demonstrate the following SQLite database management routines.
  • Create and connect to a SQLite database.
  • Create a new table in a SQLite database.
  • Insert rows into a table.
  • Search and iterate rows in a table.
  • Update rows in a table.
  • Delete rows in a table.
1
2
3
4
5
6
7
8
9
10
11
12
13
14
15
16
17
18
19
20
21
22
23
24
25
26
27
28
29
30
31
32
33
34
35
36
37
38
39
40
41
42
43
44
45
46
47
48
49
50
51
52
53
54
55
56
57
58
59
60
61
62
63
64
65
66
67
68
69
70
71
72
73
74
75
76
77
78
79
80
81
82
83
84
85
#!/usr/bin/perl
 
useDBI;
usestrict;
 
# define database name and driver
my$driver   = "SQLite";
my$db_name= "xmodulo.db";
my$dbd= "DBI:$driver:dbname=$db_name";
 
# sqlite does not have a notion of username/password
my$username= "";
my$password= "";
 
# create and connect to a database.
# this will create a file named xmodulo.db
my$dbh= DBI->connect($dbd, $username, $password, { RaiseError=> 1 })
                      or die$DBI::errstr;
printSTDERR "Database opened successfully\n";
 
# create a table
my$stmt= qq(CREATE TABLE IF NOT EXISTS NETWORK
             (ID INTEGER PRIMARY KEY     AUTOINCREMENT,
              HOSTNAME       TEXT    NOT NULL,
              IPADDRESS      INT     NOT NULL,
              OS             CHAR(50),
              CPULOAD        REAL););
my$ret= $dbh->do($stmt);
if($ret< 0) {
   printSTDERR $DBI::errstr;
} else{
   printSTDERR "Table created successfully\n";
}
 
# insert three rows into the table
$stmt= qq(INSERT INTO NETWORK (HOSTNAME,IPADDRESS,OS,CPULOAD)
           VALUES ('xmodulo', 16843009, 'Ubuntu 14.10', 0.0));
$ret= $dbh->do($stmt) or die$DBI::errstr;
 
$stmt= qq(INSERT INTO NETWORK (HOSTNAME,IPADDRESS,OS,CPULOAD)
           VALUES ('bert', 16843010, 'CentOS 7', 0.0));
$ret= $dbh->do($stmt) or die$DBI::errstr;
 
$stmt= qq(INSERT INTO NETWORK (HOSTNAME,IPADDRESS,OS,CPULOAD)
           VALUES ('puppy', 16843011, 'Ubuntu 14.10', 0.0));
$ret= $dbh->do($stmt) or die$DBI::errstr;
 
# search and iterate row(s) in the table
$stmt= qq(SELECT id, hostname, os, cpuload from NETWORK;);
my$obj= $dbh->prepare($stmt);
$ret= $obj->execute() or die$DBI::errstr;
 
if($ret< 0) {
   printSTDERR $DBI::errstr;
}
while(my@row= $obj->fetchrow_array()) {
      print"ID: ". $row[0] . "\n";
      print"HOSTNAME: ". $row[1] ."\n";
      print"OS: ". $row[2] ."\n";
      print"CPULOAD: ". $row[3] ."\n\n";
}
 
# update specific row(s) in the table
$stmt= qq(UPDATE NETWORK set CPULOAD = 50 where OS='Ubuntu 14.10';);
$ret= $dbh->do($stmt) or die$DBI::errstr;
 
if( $ret< 0 ) {
   printSTDERR $DBI::errstr;
} else{
   printSTDERR "A total of $ret rows updated\n";
}
 
# delete specific row(s) from the table
$stmt= qq(DELETE from NETWORK where ID=2;);
$ret= $dbh->do($stmt) or die$DBI::errstr;
 
if($ret< 0) {
   printSTDERR $DBI::errstr;
} else{
   printSTDERR "A total of $ret rows deleted\n";
}
 
# quit the database
$dbh->disconnect();
printSTDERR "Exit the database\n";
A successful run of the above Perl script will create a SQLite database file named "xmodulo.db", and show the following output.
Database opened successfully
Table created successfully
ID: 1
HOSTNAME: xmodulo
OS: Ubuntu 14.10
CPULOAD: 0

ID: 2
HOSTNAME: bert
OS: CentOS 7
CPULOAD: 0

ID: 3
HOSTNAME: puppy
OS: Ubuntu 14.10
CPULOAD: 0

A total of 2 rows updated
A total of 1 rows deleted
Exit the database

Troubleshooting

If you attempt to access SQLite in Perl without installing SQLite DBI driver, you will encounter the following error. You must install DBI driver as describe at the beginning to fix this error.
Can't locate DBI.pm in @INC (@INC contains: /usr/local/lib64/perl5 /usr/local/share/perl5 /usr/lib64/perl5/vendor_perl /usr/share/perl5/vendor_perl /usr/lib64/perl5 /usr/share/perl5 .) at ./script.pl line 3.
BEGIN failed--compilation aborted at ./script.pl line 3.

Write Nagios Plugin Using Bash Script

$
0
0
http://www.unixmen.com/write-nagios-plugin-using-bash-script

Nagios is a popular open source computer system and network monitoring software application. It watches hosts and services, alerting users when things go wrong and again when they get better.
It was originally designed to run under Linux, but also runs well on other Unix variants. It is free software, licensed under the terms of the GNU General Public License version 2 as published by the Free Software Foundation.
This tool is designed as a client/server model application needs two components to work – Nagios server and Nagios client or agent (NRPE for linux or NSClient++ for Windows). Nagios server is the master host how connects to Nagios client and uses a Nagios plugin to get information from Nagios client.
nrpe1
Nagios plugin is a script which can execute on the Nagios client machine (perl, php, python, bash script).
On this artilce we will expand on this idea and create Nagios plugins using Bash. These plugins will be running on nagios client VPS, and be executed via NRPE.

Prerequisites:

Before to start, if you still didn’t install Nagios Core , check the following articles.
And also you need to install nrpe agent in the linux using the following command for ubuntu.
apt-get install -y nagios-nrpe-server
useradd nrpe && update-rc.d nagios-nrpe-server defaults

Good Practices To Develop Nagios Plugin

Before we show you how to develop nagios plugin using bash script let’s give you the best practices to develop monitoring plugin.

Return codes

A plugin have to send a return code. This interpreted code is the result of the plugin execution. We call this result “status”. This is two summary tables about return codes for hosts and services :
Hosts:
Plugin return codeHost status
0UP
1DOWN
OtherMaintains last known state
Services:
Return codeService status
0OK
1WARNING
2CRITICAL
3UNKNOWN
OtherCRITICAL : unknown return code

Plugin Output

The output message helps the user to understand the information. There are two types of output for plugin:
  • OUTPUT: displayed on monitoring screen in a real-time hosts and services. Its size is limited to 255 characters.
  • LONGOUTPUT: displayed in details page of host and service. Its size is limited to 8192 characters.
The plugin can provide performance data which are optional. However, if you want to have a graph showing the evolution of the result, it is mandatory that the plugin generates performance data.
Performance data are described after the “|” (pipe). This feature is available through the keystroke AltGR 6.
The performance data should be displayed as :
‘label’=value[UOM];[warn] ;[crit];[min];[max]
  • UOM: measure unit (octets, bits/s, volts, …)
  • warn: WARNING threshold
  • crit: CRITICAL threshold
  • min: minimal value of control
  • max: maximal value of control

Plugin Options

A well written plugin should have –help as a way to get verbose help.
There are a few reserved options that should not be used for other purposes:
  • -V version (–version) ;
  • -h help (–help) ;
  • -t timeout (–timeout) ;
  • -w warning threshold (–warning) ;
  • -c critical threshold (–critical) ;
  • -H hostname (–hostname) ;
  • -v verbose (–verbose).
In addition to the reserved options above, some other standard options are:
  • -C SNMP community (–community) ;
  • -a authentication password (–authentication) ;
  • -l login name (–logname) ;
  • -p port or password (–port or –passwd/–password)monitors operational ;
  • -u url or username (–url or –username).

Language used

You can write your script using any language like perl , c , php, python and bash. But you shloud use a language that:
  • easy-to-learn
  • easy and generally know by the administrators
  • many free library available on the web
  • often installed on Unix or linux system by default
  • easy to manage system start-up command and recovered results
  • advanced treatment characters strings
  • relatively efficient

Create Bash Script

For this article, we present plugin in bash.
For our example, we will create a script that checks the stats for any service like mysql, apache etc.
#!/bin/bash
# Nagios Plugin Bash Script - check_service.sh
# This script checks if program is running
# Check for missing parameters
if [[ -z "$1" ]]
then
        echo "Missing parameters! Syntax: ./check_service.sh service_name"
        exit 3
fi
if ps ax | grep -v grep | grep $1 > /dev/null
then
echo "OK, $SERVICE service is running"
exit 0
else
echo "CRITICAL , $SERVICE service is not running"
exit 2
fi

We will save this script in /usr/lib/nagios/plugins/check_service.sh and make it executable:
chmod +x /usr/lib/nagios/plugins/check_service.sh
To make this script work properly when run via “check_nrpe” from Nagios Server you must add this line to /etc/sudoers file on the Host Client side! This is because of the sudo command used in script.
nagios  ALL=(ALL)     NOPASSWD:/usr/sbin/lsof,/usr/lib/nagios/plugins/check_service.sh
And you need to configure  /etc/nagios/nrpe.cfg and add this line
command[check_service]=/usr/lib/nagios/plugins/check_service.sh
Now let’s test our plugin locally from our Nagios Client machine:
# /usr/lib/nagios/plugins/check_service.sh
Missing parameters! Syntax: ./check_service.sh service_name

# /usr/lib/nagios/plugins/check_service.sh mysqld
CRITICAL - mysqld service is not running

# /usr/lib/nagios/plugins/check_service.sh apache2
OK - apache2 service is running
Now you need to define new command in your nagios server command file /etc/nagios/objects/commands.cfg
define command{
command_name check_service
command_line $USER1$/check_nrpe -H $HOSTADDRESS$ -c check_service
}
And then you must add a new service check on Nagios Server side.
define service {
use generic-service
host_name unixmen
service_description service check
check_command check_service
}
In order to verify your configuration, run Nagios with the -v command line option like so:
/usr/local/nagios/bin/nagios -v /usr/local/nagios/etc/nagios.cfg
The last step is to restart the nagios service using this command
service nagios restart
That’s all. Thank you!!!

Systemd – What You Need to Know

$
0
0
https://www.maketecheasier.com/systemd-what-you-need-to-know-linux


Unless you have been living under a rock, or worse – you don’t care much about how Linux works, you must have heard of systemd, the (relatively) new init system replacing the old and outdated SysV init recently adopted by most major Linux distros.
When your Linux machine starts up it will first run some “built-in” code, loaded from the BIOS or UEFI first, followed by the bootloader, which according to its configuration loads a Linux kernel. The kernel loads up drivers, and as its very first job starts up the init process, which being the first gets PID (Process ID) 1 assigned to it.
From the user’s point of view this looks like starting up networking and databases, etc., but in reality there is a rather complex process taking place under the hood. Services are started, stopped and restarted, often parallel to each other. Some are run under different privileges than others, service statuses are being reported and logged, and many other tasks are performed that will make the different part of your system work and be able to interact with its users and environment.
systemd-linux-boot
How this is implemented, however, is far from uniform, and this really is where it all stops being common and well-defined.
The init system used by most mainstream Linux distros up to recently was System V init (or SysV init in short), which has derived its name form UNIX System V (Pronounced “System Five”), the first commercially available UNIX system. System V OS has had a specific way to run its init process, and SysV init has kept loyal to this over the years.
systemd-sysvinit
And it has been many years. UNIX System V was originally released in 1983, making the init SysV init an over 30 years old approach towards starting up Linux machines.
As it has been noted, SysV init has been outdated and long overdue to be replaced. Some of the reasons for this include:
  • SysV init uses /sbin/init to start the init process, but init itself has a very limited role. init does little more than starting /etc/init.d/rc, according to the configuration read from /etc/inittab, which in turn will run scripts to do the real work of the init process. This, unless panelized explicitly (like with startpar on Debian), will happen sequentially, one script starting after the other, making the whole process slow as each script has to wait for the previous one to finish.
  • SysV init does not have access to the PID or the processes it has (indirectly) started. It only reads PIDs and associates them with actual processes in a circumstantial, complicated way.
  • For system administrators trying to modify the environment under which a certain process would start, it’s quite difficult with SysV init. (In order to achieve this they will have to modify the init strcipt that is responsible to start the given process.)
  • There is certain functionality common to every service that SysV does not implement, but each process would have to implement itself instead, such as “daemonising” themselves (becoming a system daemon), which is an elaborate and long process. Instead of implementing these steps once, SysV requires each process to do the job themselves.
  • SysV also leaves certain functionality to external programs and knows nothing about services started by those.
All of the above, and many more design flaws, or rather the outdated system design of SysV, has made the creation of a modern init system long overdue.
There were many attempts to create an alternative init system, of which systemd is only one of them. Ubuntu used to run its own init system called upstart. Gentoo still uses OpenRC. Other init systems include initng, busybox-init, runit, and Mudur and others.
The reason systemd is a clear winner is that it’s been adopted by most major distributions. RHL and CentOS naturally went the systemd way, as Fedora was the first distro to officially adopt systemd in 2011. But systemd has really become the one init system to rule them all, when Debian 8 officially switched to systemd, bringing Ubuntu and derivatives with it, overcoming Canonical’s (or more precisely Mark Shuttleworth’s) initial opposition towards systemd.
  • Systemd aims to provide a single, centralized way to handle the init process from beginning to end.
  • It starts and stop processes and services while keeping track of their dependencies. It can even start a process as a response to another process’ dependency requirement.
  • In addition to start and stop processes during boot time, Systemd can also start any time when the system is up in response to certain trigger events such as when a device is plugged in.
  • It also does not require processes to daemonize themselves. Unlike SysV init, systemd can handle services running without having to go through the long process of becoming daemons.
  • Unlike SysV init, systemd knows and tracks all processes, including PIDs, and getting information about processes is much simpler for system administrators under systemd.
  • Systemd supports containers that are basically isolated service environments without the requirement of virtual machines. This has great potential towards more secure and simpler system designs in the future.
systemd-containers
Of course these are only some of the major advantages. For a full discussion on systemd’s advantages, you should read Debian 8’s “Systemd Position Statement
Of course systemd was not welcomed by all. In fact, many have and still do frown upon it, calling it monolithic and cumbersome, some even accusing it of going the “windows way” of having everything centralized. Many argue that it is not “the Linux way”, and certainly systemd does not seem to be in accordance with POSIX standards, and if we consider systemd as a toolkit (beyond just the binary), it is definitely hugae.
systemd-infographic
Nevertheless, systemd is clearly a step forward, and while it’s not perfect, much of the criticism it has received has been addressed by its original author and developer Lennart Poettering. It definitely is is a much needed advancement and a step up from the old init system. Linus Torvalds, the creator of Linux, does not seem to mind systemd too much, and who are we to argue with “The Creator.”
Having been adopted by all major Linux distributions, systemd is here to stay. Whatever some system admins say for whatever reason, systemd is the future of mainstream Linux, whether individual users like it or not, which, looking at its distinct advantages, is not necessarily a bad thing.
For the average user it brings faster boot times and probably more reliable systems, while in the future distributions adopting it can become more “compatible” with one another. On the user end we will definitely benefit from the more up-to-date and contemporary system design it brings to our desktops.

Using the New iproute2 Suite

$
0
0
http://fossforce.com/2015/07/using-new-iproute2-suite

For years, even in 2015, web tutorials, college textbooks and lab simulators have all been teaching the traditional networking utilities, such as arp, ifconfig, netstat and route. Whether you know it or not, most of these commands were deprecated years ago. They were replaced with commands from the iproute2 suite of utilities. Most Linux distros have continued to install the traditional tools, but CentOS, Arch and now openSUSE (among others), are moving to put them into deprecated status. That means we’ll need to start getting used to the new tools.
For those not familiar, the 2.2 Linux kernel revision (way back in the olden days) brought about some changes to the way the kernel handled networking. New features were introduced back then that had not been implemented anywhere else. The old tools use the /proc interface, while the newer tools use the newer kernels’ netlink interface. At least some of the older tools are no longer in active development. The bottom line is that the iproute2 suite offers some definite advantages over the old tools.
While we won’t be able to resolve the world’s networking problems all in one go here, we can at least take a look at the more common commands. Before we go too far, be sure to pay attention to the double dashes “--“. Anything after “--” is a comment. As with many programming languages, I include them after commands as explanatory notes. Note also that I’ll be running as root for my own convenience, but I normally either use sudo or su - -c "command".
Wikipedia provides the nice table below, showing which commands are replaced by the newer utilities.
Configuration utilities replaced by iproute2
PurposeLegacy utilityiproute2 equivalent
Address and link configurationifconfigip addr, ip link
Routing tablesrouteip route
Neighborsarpip neigh
VLANvconfigip link
Tunnelsiptunnelip tunnel
Bridgesbrctlip link, bridge
Multicastipmaddrip maddr
Statisticsnetstatip -s, ss
You’ll notice that we can get most of the information we want simply by using the ip command, along with the relevant object and options. For example, ip takes one of the following objects listed below, which can be shortened as shown:
  • address (or addr or a)
  • link (or lin or l)
  • neighbor (or neigh or n)
  • route (or r)
  • tunnel (or tunn)
There are other objects, of course, but these will give you a general idea. To see the full list, simply type:
ip --helporman ip
For a quick overview of the commands for any of ip’s objects, we can run:
ip [object] help -- shows command syntax for a given object’s commands
For example:
ip link help

ip link (replaces ifconfig)

Now, let’s start with our devices, shall we? Network connections are considered to be links, so we use ip link to show, add or delete our current network devices:
ip link show (or list) -- enp3s0 (eth0) is down, wlp4s0 (wlan0) is up
ip -s link show -- shows the current statistics for each link
ip link show stats
Click to enlarge.
Bear in mind that we do not need the “show” or “list” keywords. If we just run ip [object], you will get a listing of whatever object you wanted (links, addresses, etc.). We can also modify a network device’s attributes. For example, we can manually change the address, or change its state to “up” or “down”:
ip link set [device] [action]
In truth, ip link has a great many actions, and we can really get down to the dirty details of our devices, including adding and deleting bridges (for you more advanced users who need this).

ip address (replaces ifconfig)

Sometimes we need to manage our network (IP) addresses. ip address allows us to set the address for a given device, and using the appropriate protocol. To see our current address(es), we can simply do:
ip addr or ip a or ip address list
ip -6 address list -- show IPv6 addresses
ip -6 address show dev enp3s0 -- show IPv6 address for specific device (your device name may be a bit different)
Here’s an example of adding an IP address. Note that we use the “/24″ at the end of the address, in addition to the “brd +” to assign a standard 24-bit broadcast address to the device “enp3s0″:
ip addr add 192.168.1.15/24 brd + dev enp3s0

ip neighbor (replaces arp)

The old net-tools “arp” command lets us see and manipulate the Address Resolution Protocol information (stored in a cache). Using the new iproute2 format, we can see the list of neighboring computers (assuming they are in our arp cache), add, delete, change and replace neighbors and even flush the neighbors table. Let’s take a quick look at an example. Mind you, I pinged a few systems on my local LAN, and so have a few entries in my ARP cache.
ip neighbor show
ip neigh show
Click to enlarge.
We can manage this cache using other ip neighbor commands. Thus, if we need to add a static ARP entry, we could easily just associate the IP address with a particular MAC address, like so:
ip neigh add 192.168.1.25 [mac address here]
Hopefully, you are starting to see the consistency in using certain commands (show, add, delete, set) with various objects (link, address, neighbor, etc.). The iproute2 suite mostly avoids arcane option flags, preferring to use something closer to “plain English” for accomplishing tasks. Let’s take a look at the routing commands.

ip route (replaces route)

You can probably guess what command we need to run if we want to see the routing table. That’s right! As I mentioned above, the show/list keywords are optional. We can really just run:
ip route -- you can add show (sh) or list (ls) for clarity
What are we going to do if we need to add a static route? Right again!
ip route add default via 192.168.1.254 -- adds a new default route (assuming we don’t already have one)
Suppose our router (or some switches) is connected to another network, and we want to add a route to it. Simply use the network address:
ip route add 192.168.2.0 via 192.168.1.254
To delete a route, substitute delete or del, or even just “d”, for “add”. Naturally, there are a lot more things we can do with route objects. The “get” command effectively finds routes by acting as if it is sending/receiving packets. We can also add routing rules (a routing plan, if you will), based on the various fields in a routing packet. Since we don’t have time to dive deeper, I’ll leave you to explore this area on your own.

ss (replaces netstat)

In order to get the same information as the old netstat command (on a basic level), we’ll want to run the ss utility. The output will scroll right off the screen, so we’ll use a pager here to make it easier to scroll through the information at our own pace:
ss -l | less -- that’s a lower-case “L”, and gives us only the sockets listening for traffic
If we need more details, we can use the “extended” option:
ss -e -- add another “e” for even more details
If you need to work with networking — or even security — these tools are good to know. There is, of course, much more you can do, including managing bridges. In fact, one of my buddies really likes the bridge capabilities of the iproute2 suite. In general, I like the relative simplicity and consistency in using the commands across the suite.
Here are a few resources you can check out for more details:

How to manage Vim plugins

$
0
0
http://xmodulo.com/manage-vim-plugins.html

Vim is a versatile, lightweight text editor on Linux. While its initial learning curve can be overwhelming for an average Linux user, its benefits are completely worthy. As far as the functionality goes, Vim is fully customizable by means of plugins. Due to its high level of configuration, though, you need to spend some time with its plugin system to be able to personalize Vim in an effective way. Luckily, we have several tools that make our life with Vim plugins easier. The one I use on a daily basis is Vundle.

What is Vundle?

Vundle, which stands for Vim Bundle, is a Vim plugin manager. Vundle allows you to install, update, search and clean up Vim plugins very easily. It can also manage your runtime and help with tags. In this tutorial, I am going to show how to install and use Vundle.

Installing Vundle

First, install Git if you don't have it on your Linux system.
Next, create a directory where Vim plugins will be downloaded and installed. By default, this directory is located at ~/.vim/bundle
$ mkdir -p ~/.vim/bundle
Now go ahead and install Vundle as follows. Note that Vundle itself is another Vim plugin. Thus we install Vundle under ~/.vim/bundle we created earlier.
$ git clone https://github.com/gmarik/Vundle.vim.git ~/.vim/bundle/Vundle.vim

Configuring Vundle

Now set up you .vimrc file as follows:
1
2
3
4
5
6
7
8
9
10
11
12
13
14
15
16
17
18
19
20
21
22
23
24
25
26
27
28
29
30
31
32
33
34
setnocompatible              " This is required
filetype off                  " This is required
 
" Here you setup the runtime path
setrtp+=~/.vim/bundle/Vundle.vim
 
" Initialize vundle
call vundle#begin()
 
" This should always be the first
Plugin 'gmarik/Vundle.vim'
 
" This examples are from https://github.com/gmarik/Vundle.vim README
Plugin 'tpope/vim-fugitive'
 
" Plugin from http://vim-scripts.org/vim/scripts.html
Plugin 'L9'
 
"Git plugin not hosted on GitHub
Plugin 'git://git.wincent.com/command-t.git'
 
"git repos on your localmachine (i.e. when working on your own plugin)
Plugin 'file:///home/gmarik/path/to/plugin'
 
" The sparkup vim script is ina subdirectory of this repo called vim.
" Pass the path to setthe runtimepath properly.
Plugin 'rstacruz/sparkup', {'rtp': 'vim/'}
 
" Avoid a name conflict with L9
Plugin 'user/L9', {'name': 'newL9'}
 
"Every Plugin should be before this line
 
call vundle#end()            " required
Let me explain the above configuration a bit. By default, Vundle downloads and installs Vim plugins from github.com or vim-scripts.org. You can modify the default behavior.
To install from Github:
1
Plugin 'user/plugin'
To install from http://vim-scripts.org/vim/scripts.html:
1
Plugin 'plugin_name'
To install from another git repo:
1
Plugin 'git://git.another_repo.com/plugin'
To install from a local file:
1
Plugin 'file:///home/user/path/to/plugin'
Also you can customize others such as the runtime path of you plugins, which is really useful if you are programming a plugin yourself, or just want to load it from another directory that is not ~/.vim.
1
Plugin 'rstacruz/sparkup', {'rtp': 'another_vim_path/'}
If you have plugins with the same names, you can rename you plugin so that it doesn't conflict.
1
Plugin 'user/plugin', {'name': 'newPlugin'}

Using Vundle Commands

Once you have set up you plugins with Vundle, you can use it to to install, update, search and clean unused plugins using several Vundle commands.

Installing a new plugin

The PluginInstall command will install all plugins listed in your .vimrc file. You can also install just one specific plugin by passing its name.
1
2
:PluginInstall
:PluginInstall

Cleaning up an unused plugin

If you have any unused plugin, you can remove it by using the PluginClean command.
1
:PluginClean

Searching for a plugin

If you want to install a plugin from a plugin list provided, search functionality can be useful.
1
:PluginSearch

While searching, you can install, clean, research or reload the same list on the interactive split. Installing plugins won't load your plugins automatically. To do so, add them to you .vimrc file.

Conclusion

Vim is an amazing tool. It can not only be a great default text editor that can make your work flow faster and smoother, but also be turned into an IDE for almost any programming language available. Vundle can be a big help in personalizing the powerful Vim environment quickly and easily.
Note that there are several sites that allow you to find the right Vim plugins for you. Always check http://www.vim-scripts.org, Github or http://www.vimawesome.com for new scripts or plugins. Also remember to use the help provider for you plugin.
Keep rocking with your favorite text editor!

Web Server Load Testing Tool: Siege

$
0
0
http://sysadmindesk.com/web-server-load-testing-tool-siege

What is Siege?
Siege is a benchmarking and load testing tool that can be used to measure the performance of a web server when under immense pressure. Siege performs following tests:
  • Amount of data transferred.
  • Response time of server.
  • Transaction rate.
  • Throughput.
  • Concurrency.
  • Times the program returned ok.
Siege provides three modes of operation:
  • Regression.
  • Internet Simulation.
  • Brute Force.
Note: The guide is only for Debian and Ubuntu servers.
1: Before installing any new program, update your server:
sudo apt-get update && sudo apt-get upgrade --show-upgraded

2: Download the latest version of Siege from Siege’s Website:
wget  http://download.joedog.org/siege/siege-3.1.0.tar.gz
3: Unzip the file:
tar -zxvf siege-latest.tar.gz

4: Go to Siege directory:
cd siege-*/

5: Before configuration, if GNU compiler collection (gcc) is not installed, install now:
sudo apt-get install build-essential

6: Configure and complete the installation process:
./configure
make
sudo make install


7: Generate a configuration file:
siege.config

8: After that open .siegerc file located in your home directory.
9: By default Siege configuration suggests 25 concurrent users over a period of 1 minute. Choose a location for your log file. Uncomment the variables shown below, and also if you want any other commented settings then don’t forget to remove the pound sign (#):
...

#
# Variable declarations. You can set variables here
# for use in the directives below. Example:
# PROXY = proxy.joedog.org
# Reference variables inside ${} or $(), example:
# proxy-host = ${PROXY}
# You can also reference ENVIRONMENT variables without
# actually declaring them, example:
logfile = $(HOME)/siege.log

...

#
# Default number of simulated concurrent users
# ex: concurrent = 25
#
concurrent = 25

#
# Default duration of the siege. The right hand argument has
# a modifier which specifies the time units, H=hours, M=minutes,
# and S=seconds. If a modifier is not specified, then minutes
# are assumed.
# ex: time = 50M
#
time = 1M

How to run Siege?

At last, now you are ready to run Siege!
To run Siege, enter the following command, replacing www.example.com with your IP address or domain name.
siege www.example.com
Output
** SIEGE 2.70
** Preparing 25 concurrent users for battle.
The server is now under siege...
Lifting the server siege... done.
Transactions: 2913 hits
Availability: 100.00 %
Elapsed time: 59.51 secs
Data transferred: 0.41 MB
Response time: 0.00 secs
Transaction rate: 48.95 trans/sec
Throughput: 0.01 MB/sec
Concurrency: 0.04
Successful transactions: 2913
Failed transactions: 0
Longest transaction: 0.01
Shortest transaction: 0.00

FILE: /var/log/siege.log
You can disable this annoying message by editing
the .siegerc file in your home directory; change
the directive 'show-logfile' to false.

Commands and further configuration of Siege

If the availability remains 100% with no failed connections then you are not in any problem.
URL file creation
If you want to test number of websites, configure the tool to read from a urls.txt .
1: Open the urls.txt  file located at /usr/local/etc/urls.txt. Add domain names, pages or IPs addresses to that file.
# URLS file for siege
# --
# Format the url entries in any of the following formats:
# http://www.whoohoo.com/index.html
# http://www/index.html
# www/index.html
# http://www.whoohoo.com/cgi-bin/howto/display.cgi?1013
# Use the POST directive for pages that require it:
# http://www.whoohoo.com/cgi-bin/haha.cgi POST ha=1&ho=2
# or POST content from a file:
# http://www.whoohoo.com/melvin.jsp POST
2: To run Siege with above mentioned file, enter the following command siege.
 siege
3: For separate file enter following command.
siege -f your/file/path.txt

For more information about Siege and it’s commands, visit their website: Siege Home.

Home Automation with Raspberry Pi

$
0
0
http://www.linuxjournal.com/content/home-automation-raspberry-pi

The Raspberry Pi has been very popular among hobbyists and educators ever since its launch in 2011. The Raspberry Pi is a credit-card-sized single-board computer with a Broadcom BCM 2835 SoC, 256MB to 512MB of RAM, USB ports, GPIO pins, Ethernet, HDMI out, camera header and an SD card slot. The most attractive aspects of the Raspberry Pi are its low cost of $35 and large user community following.
The Pi has several pre-built images for various applications (http://www.raspberrypi.org/downloads), such as the Debian-based Raspbian, XBMC-based (now known as Kodi) RASPBMC, OpenELEC-based Plex Player, Ubuntu Core, RISC OS and more. The NOOBS (New Out Of the Box Setup) image presents a user-friendly menu to select and install any of the several distributions and subsequently boot into any of the installed OSes. The Raspbian image comes with the Wolfram language as part of the setup.
Since its initial launch in February 2011, the Raspberry Pi has been revised four times, each time receiving upgrades but maintaining the steady price of $35. The newest release of the Pi (the Raspberry Pi 2) boasts a 900MHz quad core cortex A7 and 1GB of RAM. Moreover, Microsoft announced Windows 10 for the Raspberry Pi 2 through its IoT developer program for no charge (https://dev.windows.com/en-us/featured/raspberrypi2support). This, in addition to its versatile features, has caused fans like me to upgrade to the Raspberry Pi 2. With a few new Raspberry Pi 2 boards in hand, I set out to find some useful ways to employ my older Pi boards.
In this article, I briefly describe the requirements of the project that I outlined, and I explain the various tools I decided to use to build it. I then cover the hardware I chose and the way to assemble the parts to realize the system. Next, I continue setting up the development environment on the Raspbian image, and I walk through the code and bring everything together to form the complete system. Finally, I conclude with possible improvements and hacks that would extend the usefulness of a Pi home automation system.

The Internet of Things

An ongoing trend in embedded devices is to have all embedded devices connected to the Internet. The Internet was developed as a fail-safe network that could survive the destruction of several nodes. The Internet of Things (IoT) leverages the same redundancy. With the move to migrate to IPv6, the IP address space would be large enough for several trillion devices to stay connected. A connected device also makes it very convenient to control it from anywhere, receive inputs from various sensors and respond to events. A multitude of IoT-connected devices in a home has the potential to act as a living entity that exhibits response to stimuli.

Raspberry Pi Home Automation

Inspired by the idea of having a home that has a life of its own, I settled on a home automation project to control the lights in my living room. The goal of my project was to be able to time the lights in my living room and control them remotely over the Internet using a Web browser. I also wanted to expose an API that could be used to control the device from other devices programatically.
The interesting part of this project is not the hardware, which is fairly simple and easy to construct, but the UI. The UI that I had in mind would support multiple users logged in to the same Pi server. The UI state had to keep up with the actual state of the system in real time indicating which lights actually were on when multiple users operated the system simultaneously. Apart from this, the lights may toggle on or off when triggered by the timer. A UI running on a device, such as a phone or a tablet, may be subject to random connection drops. The UI is expected to handle this and attempt to reconnect to the Pi server.

Hardware

Having outlined the requirements, I began to build the hardware. Table 1 shows the bill of materials that I used to build the hardware part of the system, and Figure 1 shows a block diagram of the hardware system.

Table 1. Bill of Materials

ComponentQuantityApproximate PriceProcured fromFunction
Raspberry Pi1$35NewarkThe CPU
SD card1$25amazon.comTo boot the RPi
Edimax WiFi1$10amazon.comTo give the RPi wireless connectivity
Relay module1$10amazon.comUsed for switching
Ribbon cable1$7amazon.comTo connect the RPi header to the relay module
Power supply1$8amazon.comTo power the RPi and the relay module
Extension cord9$54WalmartTo power the SMPS and to provide a plug interface to the relays
Pencil box1$2WalmartTo house the entire setup
USB cable1$5amazon.comTo power the RPi
14 gauge wire16Home DepotTo wire the relay terminals to the live wire from the wall outlet
Cable clamp1$2Home DepotAs a strain relief
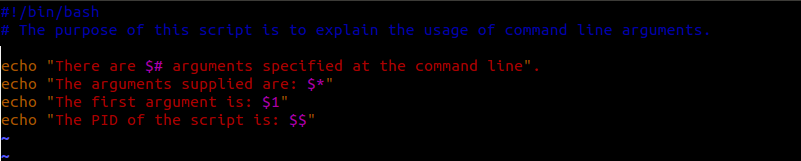
Figure 1. Block Diagram of the Hardware System
Wiring this is time-consuming but easy. First, wire the SMPS to the wall outlet by cutting off an extension cord at the socket end. Strip the wires and screw them into the screw terminals of the SMPS. Next, wire the Raspberry Pi to the SMPS by cutting off the type A end of the USB cable and wiring it to the wire ends of the SMPS and the micro B end to the RPi. Strip out two strands of wires from the ribbon cable, and wire the appropriate terminals to GND and JDVcc. Remove the jumper that connects the JDVcc and Vcc. Not removing this jumper will feed back 5v to the 3.3v pins of the Pi and damage it.
Now that all the terminals are wired for power, connect the IN1-IN8 lines of the relay module to the appropriate GPIO pins of the RPi using more of the ribbon cable as shown in Figure 2. The code I present here is written for the case where I wire IN1-IN8 to GPIO1-GPIO7. Should you decide to wire them differently, you will need to modify your code accordingly.
The RPi's GPIO pins are shown in Figure 2. The RPi's IO ports operate at 3.3v, and the relay module works at 5v. However, the relays are isolated from the RPi's GPIO pins using optocouplers. The optocouplers may be supplied 3.3v over the Vcc pin. The Vcc pin of the relay module may be supplied 3.3v from the GPIO header of the Pi. Make sure you have removed the jumper that bridges the Vcc and JDVcc on the relay module board. The JDVcc pin should be supplied 5v for proper operation of the relay. The relay module is designed to be active low. This means that you have to ground the terminals IN1-IN8 to switch on a relay.
Figure 2. The RPi's GPIO Pins
Warning: handle all wiring with caution. Getting a shock from the line can be fatal!
Cut the remaining extension cables at the plug end, and screw in the wire end to the relay. Also daisy-chain the live wire from the wall outlet to the relay terminals. The entire setup can be housed in a pencil box or something similar. Plan this out in advance to avoid having to unwire and rewire the terminals. Additionally, I added a few screw cable clamps to the holes I made in my housing to act as a strain relief (Figure 3).
Figure 3. The Hardware Setup

Environment

I built my environment starting with a fresh install of Raspbian. For the initial installation, you need an HDMI-capable display, a USB keyboard, mouse and a wired Ethernet connection. You also optionally may connect a Wi-Fi adapter. Build the SD card for the first boot by following the instructions given at http://www.raspberrypi.org/documentation/installation/installing-image. During the first boot, the installer sets up the OS and expands the image to fill the entire card. After the first boot, you should be able to log in using the default credentials(user "pi" and password "raspberry").
Once you successfully log in, it's good practice to update the OS. The Raspbian image is based on Debian and uses the aptitude package manager. You also will need python, pip and git. I also recommend installing Webmin to ease administration processes. Instructions for installing Webmin are at http://www.webmin.com/deb.html (follow the directions in the "Using the Webmin APT repository" section):

sudo apt-get update && sudo apt-get dist-upgrade
sudo apt-get install python python-pip git git-core
Next, you need to set up the Wi-Fi connection. You can find detailed instructions for this at http://www.raspberrypi.org/documentation/configuration/wireless. I recommend the wicd-curses option. At this point, you can make changes to the RPi setup using the sudo raspi-config command. This will bring up a GUI that lets you choose options like the amount of RAM you share with the GPU, overclocking, GUI Boot and so on.
Another useful tool is the Cloud 9 IDE. The Cloud9 IDE allows you to edit your code on the RPi using a Web browser. It also gives you a shell interface in the browser. You can develop and execute all your code without leaving the Web browser. The Cloud 9 IDE requires a specific version of NodeJS. Using the wrong version will cause frequent crashes of the Cloud 9 server, resulting in constant frustration. Instructions for installing NodeJS on the Raspberry Pi are outlined at http://weworkweplay.com/play/raspberry-pi-nodejs.

Software

I decided to build my front-end UI using HTML5, CSS3 and JavaScript. The combination of these three form a powerful tool for building UIs. JavaScript provides easy communication APIs to servers. There also are a lot of JavaScript libraries like JQuery, Bootstrap and so on from which to choose. HTML5 supports the WebSocket API that allows the browser to keep a connection alive and receive communication over this connection. This makes WebSocket useful for implementing live and streaming apps, such as for games and chat interfaces. CSS is useful for styling the various HTML elements. When used properly, it lets one build dynamic UIs by switching the styles on an element in response to events. For this project, I chose JQuery to handle events, Bootstrap CSS to lay out the buttons in a grid form and pure JavaScript to handle WebSocket communications.

Libraries

The back-end server on the Raspberry Pi needs to control the GPIO pins on the Raspberry Pi board. It also needs an HTTP interface to serve the UI and a WebSocket interface to pass command and status messages. Such a specific server did not exist for off-the-shelf deployment, so I decided to write my own using Python. Python has prebuilt modules for the Raspberry Pi GPIO, HTTP server and WebSockets. Since these modules are specialized, minimum coding was required on my part.
However, these modules are not a part of Python and need to be installed separately. First, you need to be able to control the RPi's GPIO pins. The easiest way to do this from Python is by using the RPi.GPIO library from https://pypi.python.org/pypi/RPi.GPIO. Install this module with:

sudo pip install RPi.GPIO
Using the RPi.GPIO module is very simple. You can find examples of its usage at http://sourceforge.net/p/raspberry-gpio-python/wiki/Examples. The first step in using the module is to import it into the code. Next, you need to select the mode. The mode can be either GPIO.BOARD or GPIO.BCM. The mode decides whether the pin number references in the subsequent commands will be based on the BCM chip or the IO pins on the board. This is followed by setting pins as either input or output. Now you can use the IO pins as required. Finally, you need to clean up to release the GPIO pins. Listing 1 shows examples of using the RPi.GPIO module.

Listing 1. Using the RPi.GPIO Module


import RPi.GPIO as GPIO # import module
GPIO.setmode(GPIO.BOARD) # use board pin numbering
GPIO.setup(0, GPIO.IN) # set ch0 as input
GPIO.setup(1, GPIO.OUT) # set ch1 as output
var1=GPIO.input(0) # read ch0
GPIO.output(1, GPIO.HIGH) # take ch1 to high state
GPIO.cleanup() # release GPIO. 
CherryPy is a Web framework module for Python. It is easily extendible to support WebSocket using the ws4py module. CherryPy and ws4py also can be installed using pip:
pip install cherrypy pip install ws4py Examples of using the CherryPy framework and the ws4py plugin can be found in the CherryPy docs and the ws4py docs. A basic CherryPy server can be spawned using the code shown in Listing 2.

Listing 2. Spawning a Basic CherryPy Server

# From the CherryPy Docs at # https://cherrypy.readthedocs.org/en/latest/tutorials.html import cherrypy # import the cherrypy module class HelloWorld(object): # @cherrypy.expose # Make the function available def index(self): # Create a function for each request return "Hello world!" # Returned value is sent to the browser if __name__ == '__main__': cherrypy.quickstart(HelloWorld()) # start the CherryPy server # and pass the class handle # to handle request Slightly more advanced code would pass the quickstart method an object with configuration. The partial code in Listing 3 illustrates this. This code serves requests to /js from the js folder. The js folder resides in the home directory of the server code.

Listing 3. Passing the quickstart Method

cherrypy.quickstart(HelloWorld(), '', config={ '/js': { # Configure how to serve requests for /js 'tools.staticdir.on': True, # Serve content statically # from a directory 'tools.staticdir.dir': 'js' # Directory with respect to # server home. } }); To add WebSocket support to the CherryPy server, modify the code as shown in Listing 4. The WebSocket handler class needs to implement three methods: opened, closedand received_message. Listing 4 is a basic WebSocket server that has been kept small for the purpose of explaining the major functional parts of the code; hence, it does not actually do anything.

Listing 4. Basic WebSocket Server

import cherrypy # Import CherryPy server module # Import plugin modules for CherryPy from ws4py.server.cherrypyserver import WebSocketPlugin, WebSocketTool from ws4py.websocket import WebSocket # Import modules for # the ws4py plugin. from ws4py.messaging import TextMessage class ChatWebSocketHandler(WebSocket): def received_message(self, m): msg=m.data.decode("utf-8") print msg cherrypy.engine.publish('websocket-broadcast', ↪"Broadcast Message: Received a message") def closed(self, code, reason="A client left the room ↪without a proper explanation."): cherrypy.engine.publish('websocket-broadcast', ↪TextMessage(reason)) class Root(object): @cherrypy.expose def index(self): return "index" @cherrypy.expose def ws(self): print "Handler created: %s" % repr(cherrypy.request.ws_handler) if __name__ == '__main__': WebSocketPlugin(cherrypy.engine).subscribe() # initialize websocket # plugin cherrypy.tools.websocket = WebSocketTool() # cherrypy.config.update({'server.socket_host': '0.0.0.0', 'server.socket_port': 9003, 'tools.staticdir.root': '/home/pi'}) cherrypy.quickstart(Root(), '', config={ '/ws': { 'tools.websocket.on': True, 'tools.websocket.handler_cls': ChatWebSocketHandler } }); On the client side, the HTML needs to implement a function to connect to a WebSocket and handle incoming messages. Listing 5 shows simple HTML that would do that. This code uses the jQuery.ready() event to start connecting to the WebSocket server. The code in this Listing implements methods to handle all events: onopen(), onclose(), onerror()and onmessage(). To extend this example, add code to the onmessage() method to handle messages.

Listing 5. Connecting to WebSocket and Handling Incoming Messages

Pi Home Automation

Now that you've seen the basics of WebSockets, CherryPy and the HTML front end, let's get to the actual code. You can get the code from the Git repository at https://bitbucket.org/lordloh/pi-home-automation. You can clone this repository locally on your RPi, and execute it out of the box using the command:
git clone https://bitbucket.org/lordloh/pi-home-automation.git git fetch && git checkout LinuxJournal2015May cd pi-home-automation python relay.py The relayLabel.json file holds the required configuration, such as labels for relays, times for lights to go on and off and so on. Listing 6 shows the basic schema of the configuration. Repeat this pattern for each relay. The dow property is formed by using one bit for each day of the week starting from Monday for the LSB to Sunday for the MSB.

Listing 6. Basic Schema of the Configuration

{ "relay1": { "times": [ { "start": [ , , ], "end": [ , , ], "dow": } ], "id": 1, "label": "" } } Figure 4 shows the block diagram of the system displaying the major functional parts. Table 2 enumerates all the commands the client may send to the server and the action that the server is expected to take. These commands are sent from the browser to the server in JSON format. The command schema is as follows:
{ "c":"", "r":} The update and updateLabels commands do not take a relay number. Apart from relay.py and relayLabel.json, the only other file required is index.html. The relay.py script reads this file and serves it in response to HTTP requests. The index.html file contains the HTML, CSS and JavaScript to render the UI.
Figure 4. Block Diagram of the System

Table 2. Commands

CommandDescription
onSwitch a relay on
offSwitch a relay off
updateSend status of GPIO pins and relay labels
updateLabelsSave new labels to JSON files
Once the system is up and running, you'll want to access it from over the Internet. To do this, you need to set a permanent MAC address and reserved IP address for the Raspberry Pi on your local network, and set up port forwarding on your router. The process for doing this varies according to router, and your router manual is the best reference for it. Additionally, you can use a dynamic domain name service so that you do not need to type your IP address to access your Pi every time. Some routers include support for certain dynamic DNS services.

Conclusion

I hope this article helps you to build this or other similar projects. This project can be extended to add new features, such as detecting your phone connected to your Wi-Fi and switching on lights. You also could integrate this with applications, such as OnX and Android Tasker. Adding password protection for out-of-network access is beneficial. Feel free to mention any issues, bugs and feature requests at http://code.lohray.com/pi-home-automation/issues.

How to record from JACK with Ardour on Linux

$
0
0
https://www.howtoforge.com/tutorial/record-jack-ardour-linux

With all the madness that prevails the Linux audio engines and complex inter-related frameworks and subsystems, it is very easy to get lost and overwhelmed when you want to do something as simple as to record yourself playing an electric musical instrument. Recording from JACK is imperative in that case, as using a “mic to speaker” arrangement will introduce unwanted noise to the recording, no matter what. Thankfully, there are many ways to perform a JACK recording on Linux and one of the easiest ones is by using the Ardour sound workstation.
You can find the latest version of Ardour in the official website, or search for the “ardour” package on your distribution's software center/package manager.
For Ubuntu, run:
sudo apt-get install ardour
Once you open the software for the first time, you will be prompt to set some key options like the Audio System, Driver, Active Device etc. These settings override your system's settings as Ardour takes control of the sound server. To record from JACK, you should choose the corresponding option on the Audio Setup screen, as shown below.
Now you may insert a new recording channel through “Session/Add Track or Bus” option from the top panel menu. Adding a mixer is also helpful for setting the channel levels when recording on top of a previous recording, or when recording from multiple sources. This is done through “View/Show Editor Mixer” from the top panel again. You can start the recording by pressing the “record” button on the channel and then the “record” and “play” buttons on the top left.
Notice the points when the recording peaks. This is a basic problem that has to do with the recording levels, and fixing it is important as the audio gets distorted in these points. You may adjust the recording level from your distribution's Sound Settings. Go to the “input sources” and choose the device you have plugged your JACK cable on, and then reduce the input volume level as much as needed for the recording not to peak. Depending on the instrument and frequency range, this adjustment may differ greatly. I used an electric bass and electric guitar with only the first peaking and only at low frequency notes. After reducing the input volume level, the recording got into a seamless range, as indicated by the following screenshot.
Once you are done with the recording, you may save your work through “Session/Export” option located on the top menu panel. This will allow you to choose from a variety of formats, export channels independently and even split two channels to mono files. I chose to export my recording in three different files simultaneously (CD wav, FLAC and OGG vorbis).
One thing to note is the fact that depending on your system hardware and OS kernel, you may experience a recording latency (lag) that may be confusing for the performer. This can be relieved by installing a low-latency kernel, or by connecting your instrument on your amp or head, listen to your playing through headphones, and connecting the amp with the PC through the DI (Direct Out). Have fun!

LUCI4HPC

$
0
0
http://www.linuxjournal.com/content/luci4hpc

Today's computational needs in diverse fields cannot be met by a single computer. Such areas include weather forecasting, astronomy, aerodynamics simulations for cars, material sciences and computational drug design. This makes it necessary to combine multiple computers into one system, a so-called computer cluster, to obtain the required computational power.
The software described in this article is designed for a Beowulf-style cluster. Such a cluster commonly consists of consumer-grade machines and allows for parallel high-performance computing. The system is managed by a head node and accessed via a login node. The actual work is performed by multiple compute nodes. The individual nodes are connected through an internal network. The head and login node need an additional external network connection, while the compute nodes often use an additional high-throughput, low-latency connection between them, such as InfiniBand.
This rather complex setup requires special software, which offers tools to install and manage such a system easily. The software presented in this article—LUCI4HPC, an acronym for lightweight user-friendly cluster installer for high performance computing—is such a tool.
The aim is to facilitate the maintenance of small in-house clusters, mainly used by research institutions, in order to lower the dependency on shared external systems. The main focus of LUCI4HPC is to be lightweight in terms of resource usage to leave as much of the computational power as possible for the actual calculations and to be user-friendly, which is achieved by a graphical Web-based control panel for the management of the system.
LUCI4HPC focuses only on essential features in order not to burden the user with many unnecessary options so that the system can be made operational quickly with just a few clicks.
In this article, we provide an overview of the LUCI4HPC software as well as briefly explain the installation and use. You can find a more detailed installation and usage guide in the manual on the LUCI4HPC Web site (see Resources). Figure 1 shows an overview of the recommended hardware setup.
Figure 1. Recommended Hardware Setup for a Cluster Running LUCI4HPC
The current beta version of LUCI4HPC comes in a self-extracting binary package and supports Ubuntu Linux. Execute the binary on the head node, with an already installed operating system, to trigger the installation process. During the installation process, you have to answer a series of questions concerning the setup and configuration of the cluster. These questions include the external and internal IP addresses of the head node, including the IP range for the internal network, the name of the cluster as well as the desired time zone and keyboard layout for the installation of the other nodes.
The installation script offers predefined default values extracted from the operating system for most of these configuration options. The install script performs all necessary steps in order to have a fully functional head node. After the installation, you need to acquire a free-of-charge license on the LUCI4HPC Web site and place it in the license folder. After that, the cluster is ready, and you can add login and compute nodes.
It is very easy to add a node. Connect the node to the internal network of the cluster and set it to boot over this network connection. All subsequent steps can be performed via the Web-based control panel. The node is recognized as a candidate and is visible in the control panel. There you can define the type (login, compute, other) and name of the node. Click on the Save button to start the automatic installation of Ubuntu Linux and the client program on the node.
Currently, the software distinguishes three types of nodes: namely login, compute and other. A login node is a computer with an internal and an external connection, and it allows the users to access the cluster. This is separated from the head node in order to prevent user errors from interfering with the cluster system. Because scripts that use up all the memory or processing time may affect the LUCI4HPC programs, a compute node performs the actual calculation and is therefore composed out of potent hardware. The type "other" is a special case, which designates a node with an assigned internal IP address but where the LUCI4HPC software does not automatically install an operating system. This is useful when you want to connect, for example, a storage server to the cluster, where an internal connection is preferred for performance reasons, but that already has an operating system installed. The candidate system has the advantage that many nodes can be turned on at the same time and that you can later decide from the comfort of your office on the type of each node.
An important part of a cluster software is the scheduler, which manages the assignment of the resources and the execution of the job on the various nodes. LUCI4HPC comes with a fully integrated job scheduler, which also is configurable via the Web-based control panel.
The control panel uses HTTPS, and you can log in with the user name and password of the user that has the user ID 1000. It is, therefore, very easy and convenient to change the login credentials—just change the credentials of that user on the head node. After login, you'll see a cluster overview on the first page. Figure 2 shows a screenshot of this overview.
Figure 2. LUCI4HPC Web-Based Control Panel, Cluster Overview Page
This overview features the friendly computer icon called Clusterboy, which shows a thumbs up if everything is working properly and a thumbs down if there is a problem within the cluster, such as a failed node. This allows you to assess the status of the cluster immediately. Furthermore, the overview shows how many nodes of each type are in the cluster, how many of them are operational and installed, as well as the total and currently used amount of CPUs, GPUs and memory. The information on the currently used amount of resources is directly taken from the scheduler.
The navigation menu on the right-hand side of the control panel is used to access the different pages. The management page shows a list of all nodes with their corresponding MAC and IP addresses as well as the hostname separated into categories depending on their type. The top category shows the nodes that are marked as down, which means that they have not sent a heartbeat in the last two minutes. Click on the "details" link next to a node to access the configuration page. The uptime and the load as well as the used and total amount of resources are listed there. Additionally, some configuration options can be changed, such as the hostname, the IP address and the type of the node, and it also can be marked for re-installation. Changing the IP address requires a reboot of the node in order to take effect, which is not done automatically.
The scheduler page displays a list of all current jobs in the cluster, as well as whether they are running or queuing. Here you have the option of deleting jobs.
The queue tab allows you to define new queues. Nodes can be added to a queue very easily. Click on the "details" link next to a queue to get a list of nodes assigned to it as well as a list of currently unassigned nodes. Unassigned nodes can be assigned to a queue, and nodes assigned to a queue can be removed from it to become an unassigned node. Additionally, a queue can have a fair use limit; it can be restricted to a specific group ID, and you can choose between three different scheduling methods. These methods are "fill", which fills up the nodes one after another; "spread", which assigns a new job to the least-used node and thus performs a simple load balancing; and finally, "full", which assigns a job to an empty node. This method is used when several jobs cannot coexist on the same node.
There also is a VIP system. This system gives temporary priority access to a user when, for example, a deadline has to be met. VIP users always are on the top of the queue, and their job is executed as soon as the necessary resources become available. Normally, the scheduler assigns a weight to each job based on the amount of requested resources and the submission time. This weight determines the queuing order.
Finally, the options page allows you to change configuration options of the cluster system, determined during the installation. In general, everything that can be done in the control panel also can be done by modifying the configuration scripts and issuing a reload command.
With the current beta version, a few tasks cannot be done with the control panel. These include adding new users and packages as well as customizing the installation scripts. In order to add a user to the cluster, add the user to the head node as you normally would add a user under Linux. Issue a reload command to the nodes via the LUCI4HPC command-line tool, and then the nodes will synchronize the user and group files from the head node. Thus, the user becomes known to the entire cluster.
Installing new packages on the nodes is equally easy. As the current version supports Ubuntu Linux, it also supports the Ubuntu package management system. In order to install a package on all nodes as well as all future nodes, a package name is added to the additional_packages file in the LUCI4HPC configuration folder. During the startup or installation process, or after a reload command, the nodes install all packages listed in this file automatically.
The installation process of LUCI4HPC is handled with a preseed file for the Ubuntu installer as well as pre- and post-installation shell scripts. These shell scripts, as well as the preseed file, are customizable. They support so-called LUCI4HPC variables defined by a #. The variables allow the scripts to access the cluster options, such as the IP of the head node or the IP and hostname of the node where the script is executed. Therefore, it is possible to write a generic script that uses the IP address of the node it runs on through these variables without defining it for each node separately.
There are special installation scripts for GPU and InfiniBand drivers that are executed only when the appropriate hardware is found on the node. The installation procedures for these hardware components should be placed in these files.
Because of the possibility to change the installation shell scripts and to use configuration options directly from the cluster system in these scripts, you can very easily adapt the installation to your specific needs. This can be used, for example, for the automated installation of drivers for specific hardware or the automatic setup of specific software packages needed for your work.
For the users, most of this is hidden. As a user, you log in to the login node and use the programs lqsub to submit a job to the cluster, lqdel to remove one of your jobs and lqstat to view your current jobs and their status.
The following gives a more technical overview of how LUCI4HPC works in the background.
LUCI4HPC consists of a main program, which runs on the head node, as well as client programs, one for each node type, which run on the nodes. The main program starts multiple processes that represent the LUCI4HPC services. These services communicate via shared memory. Some services can use multiple threads in order to increase their throughput. The services are responsible for managing the cluster, and they provide basic network functionality, such as DHCP and DNS. All parts of LUCI4HPC were written from scratch in C/C++. The only third-party library used is OpenSSL. Besides a DNS and a DHCP service, there also is a TFTP service that is required for the PXE boot process.
A heartbeat service is used to monitor the nodes and check whether they are up or down as well as to gather information, such as the current load. The previously described scheduler also is realized through a service, which means that it can access the information directly from other services, such as the heartbeat in the shared memory. This prevents it from sending jobs to nodes that are down. Additionally, other services, such as the control panel, can access information easily on the current jobs.
A package cache is available, which minimizes the use of the external network connection. If a package is requested by one node, it is downloaded from the Ubuntu repository and placed in the cache such that subsequent requests from other nodes can download the package directly from it. The synchronization of the user files is handled by a separate service. Additionally, the LUCI4HPC command-line tool is used to execute commands on multiple nodes simultaneously. This is realized through a so-called execution service. Some services use standard protocols, such as DNS, DHCP, TFTP and HTTPS for their network communication. For other services, new custom protocols were designed to meet specific needs.
In conclusion, the software presented here is designed to offer an easy and quick way to install and manage a small high-performance cluster. Such in-house clusters offer more possibilities for tailoring the hardware and the installed programs and libraries to your specific needs.
The approach taken for LUCI4HPC to write everything from scratch guarantees that all components fit perfectly together without any format or communication protocol mismatches. This allows for better customization and better performance.
Note that the software currently is in the beta stage. You can download it from the Web site free of charge after registration. You are welcome to test it and provide feedback in the forum. We hope that it helps smaller institutions maintain an in-house cluster, as computational methods are becoming more and more important.

Resources

LUCI4HPC: http://luci.boku.ac.at
Institute of Molecular Modeling and Simulation: http://www.map.boku.ac.at/en/mms

Saving laptop power with powertop

$
0
0
http://fedoramagazine.org/saving-laptop-power-with-powertop


laptop-battery
If there’s one thing you want from a laptop, it’s long battery life. You want every drop of power you can get to work, read, or just be entertained on a long jaunt. So it’s good to know where your power is going.
You can use the powertop utility to see what’s drawing power when your system’s not plugged in. This utility only runs on the Terminal, so you’ll need to open a Terminal to get it. Then run this command:
sudo dnf install powertop
powertop needs access to hardware to measure power usage. So you have to run it with special privileges too:
sudo powertop
The powertop display looks similar to this screenshot. Power usage on your system will likely be different:
powertop-screenshot
The utility has several screens. You can switch between them using the Tab and Shift+Tab keys. To quit, hit the Esc key. The shortcuts are also listed at the bottom of the screen for your convenience.
The utility shows you power usage for various hardware and drivers. But it also displays interesting numbers like how many times your system wakes up each second. (Processors are so fast that they often sleep for the majority of a second of uptime.)
If you want to maximize battery power, you want to minimize wakeups. One way to do this is to use powertop‘s Tunables page. “Bad” indicates a setting that’s not saving power, although it might be good for performance. “Good” indicates a power saving setting is in effect. You can hit Enter on any tunable to switch it to the other setting.
The powertop package also provides a service that automatically sets all tunables to “Good” for optimal power saving. To use it, run this command:
sudo systemctl start powertop.service
If you’d like the service to run automatically when you boot, run this command:
sudo systemctl enable powertop.service
Caveat about this service and tunables: Certain tunables may risk your data, or (on some odd hardware) may cause your system to behave erratically. For instance, the “VM writeback timeout” setting affects how long the system waits before writing changed data to storage. This means a power saving setting trades off data security. If the system loses all power for some reason, you could lose up to 15 seconds’ of changed data, rather than the default 5. However, for most laptop users this isn’t an issue, since your system should warn you about low battery.

Nagios Core Configuration Using NagiosQL (Web Interface)

$
0
0
http://www.ubuntugeek.com/nagios-core-configuration-using-nagiosql-web-interface.html

NagiosQL is a web based administration tool designed for Nagios, but might also work with forks. It helps you to easily build a complex configuration with all options, manage and use them. NagiosQL is based on a webserver with PHP, MySQL and local file or remote access to the Nagios configuration files.

NagiosQL Features
create, delete, modify and copy settings
create and export configuration files
create and download configuration files
easy configuration import
auto backup configuration files
consistency checks
syntax verification
user management
instant activation of new configs
many translations
easy Installation wizard
MySQL database platform
We have already discussed how to Install Nagios4.0.8 on ubuntu 15.04 Server
Install NagioSQL on Ubuntu 15.04
Download the latest version from here .Once you have .tar.gz file you can move this to /var/www directory
cp nagiosql_320.tar.gz /var/www
Extract the file
sudo tar -xvzf nagiosql_320.tar.gz
Change the permissions
sudo chown -R www-data:www-data nagiosql32
Now you need to configure NagioSQL website under /etc/apache2/sites-available
sudo vi /etc/apache2/sites-available/nagiosql32.conf
add the following lines
Alias /nagiosql32 /var/www/nagiosql32/

Options None
Order allow,deny
allow from all
Save and exit the file
Enable NagioSQL website using the following command
sudo a2ensite nagiosql32
Enabling site nagiosql32.
To activate the new configuration, you need to run:
sudo service apache2 reload
Now you can access the NgiosQL web interface using the following URL
http://serverip/nagiosql32
You can see similar to the following screen here click the button START INSTALLATION
1
NagiosQL installation requirements verification
2
From the above screen we can see date.timezone setting missing so this can be changed from /etc/php5/apache/php.ini file
sudo vi /etc/php5/apache2/php.ini
change the following line
;date.timezone =
to
date.timezone =Europe/London
Save and exit the file
NsqiosQL configuration tool required certain permission to change the Naqios Core configuration files from the web interface. Following commands will give proper permission to NagiosQL plugin for the successful installation.
sudo chgrp www-data /usr/local/nagios/etc/
sudo chgrp www-data /usr/local/nagios/etc/nagios.cfg
sudo chgrp www-data /usr/local/nagios/etc/cgi.cfg
sudo chmod 775 /usr/local/nagios/etc/
sudo chmod 664 /usr/local/nagios/etc/nagios.cfg
sudo chmod 664 /usr/local/nagios/etc/cgi.cfg
sudo chown nagios:www-data /usr/local/bin/nagios
sudo chmod 750 /usr/local/bin/nagios
Once you have fixed the error you can see simiilar to the following screen and click next
3
In this step installer will input the database details to be used for nagiosql. Also update the nagiosql path values as per given screenshots. Click Next
4
This screen showing that all the steps has successfully completed. You just need to click Next
5
After completing installation, you will be redirected to NagiosQL login screen here you need to enter login credentials
6
Once you logged in you can see similar to the following screen
7
Configure NagiosQL3.2.0 with Nagios Core
This is very important part of NagiosQL setup which will help you to complete integration
Edit NagiosQL Configuration
Login to NagiosQL administrator section and navigate to Administration ---> Administration ---> Config targets and click on Modify button for Local installation.
8
9
Edit Nagios Core Configuration File
Now edit nagios configuration file ( Eg: /usr/local/nagios/etc/nagios.cfg ) and commend all earlier cfg_file and cfg_dir configuration settings and add new cfg_dir with /usr/local/nagios/nagiosql only.
sudo vi /usr/local/nagios/etc/nagios.cfg
Comment out all the following lines
#cfg_file=/usr/local/nagios/nagiosql/commands.cfg
#cfg_file=/usr/local/nagios/nagiosql/contacts.cfg
#cfg_file=/usr/local/nagios/nagiosql/timeperiods.cfg
#cfg_file=/usr/local/nagios/nagiosql/templates.cfg
#cfg_file=/usr/local/nagios/etc/objects/localhost.cfg
#cfg_file=/usr/local/nagios/etc/objects/windows.cfg
#cfg_file=/usr/local/nagios/etc/objects/switch.cfg
#cfg_file=/usr/local/nagios/etc/objects/printer.cfg
#cfg_dir=/usr/local/nagios/etc/servers
#cfg_dir=/usr/local/nagios/etc/printers
#cfg_dir=/usr/local/nagios/etc/switches
#cfg_dir=/usr/local/nagios/etc/routers
Add the following line
cfg_dir=/usr/local/nagios/nagiosql
Save and exit the file
Verify Nagios core configuration file
sudo /usr/local/nagios/bin/nagios -v /usr/local/nagios/etc/nagios.cfg
If above command show no errors on screen, restart nagios core service
sudo /etc/init.d/nagios restart

First Open Automotive Grade Linux Spec Released

$
0
0
http://www.linux.com/news/embedded-mobile/mobile-linux/833358-first-open-automotive-grade-linux-spec-released

AGL IVI
For now, AGL is primarily focused on IVI, defining requirements for services such as WiFi, Bluetooth, multimedia, application lifecycle management, windowing, power management, and location based services.
Since its inception, the Linux Foundation's Automotive Grade Linux project has promoted itself as a collaborative open source project. With the release of the first AGL Requirements Specification for Linux-based in-vehicle infotainment (IVI), AGL has earned that description more than ever. In July 2014, AGL released its first AGL reference platform built on the Tizen IVI platform running HTML5 apps. The new release instead details precise specifications and requirements for any AGL-compliant IVI stack. For the first time, automakers, automotive suppliers, and open source developers can collaborate on refining the spec -- the first draft of a common, Linux-based software stack for the connected car.
Announced this week at the Automotive Linux Summit in Tokyo, the specification allows OEMs and suppliers to identify gaps between code and requirements. Automotive companies can then provide input to the developer community for resolution in future AGL releases. This will be particularly helpful for supporting multiple architectures, says Dan Cauchy, general manager of automotive at the Linux Foundation, in an interview with Linux.com.
The Tizen IVI stack released last year was based on draft version 0.82 of the spec, which was not published at the time. Since then, the reference stack has been updated with improvements such as moving to a Crosswalk runtime and adopting Smack as the default security framework. Smack is now being considered for the full Specification, as well, says Cauchy. There has also been considerable progress on supporting the Renesas R-Car platform, he adds.
While the specification defines a standard, as opposed to supplying a reference platform, Cauchy says there is no plan to implement a compliance program at this time. "The specification is used to identify the gaps between what is required and what is in the code," he says. "Where there are gaps, we will implement those features and functions. Our aim is still to use existing code whenever possible."
Cauchy emphasizes that the spec is "more than just a technical document." The document is "a clear indication that the automakers and suppliers are adopting an open development methodology for the first time," says Cauchy. "This will allow the industry to leverage and interact directly with thousands of open source developers, by providing requirements directly to the developer community."
According to Cauchy, the AGL spec differs from the Linux-oriented GENIVI Alliance spec in that AGL is "completely open source, both in the specification and the code." This also relates to governance, he says. "Anyone can participate in AGL's development," says Cauchy.
Another difference is that AGL "is focusing on a complete reference platform, and not just components," says Cauchy. The platform includes the Linux kernel, board support package, middleware, application framework, and support for both native-Linux and HTML5 apps. "Also, there are plans to have multiple profiles of the same base platform so that we can address functions such as instrument cluster, heads up display, and telematics," says Cauchy. "Basically, if the car runs Linux, we want it all to be based on AGL, no matter the application or function."
Despite the distinctions Cauchy makes in regard to GENIVI, there is hope that the two projects could collaborate, as Cauchy suggested might happen last July. At the Automotive Linux Summit, the AGL announced that it has started building a "Unified Code Base, whereby we will be taking the best of AGL, Tizen, and GENIVI projects and combining them into a single AGL distribution for the entire industry," explains Cauchy. "The Unified Code Base will be based on creating an architecture of multiple Yocto-based meta layers. This will be a big step forward in eliminating the fragmentation in the industry."
So far, there has been no official announcement from either the AGL or GENIVI camps, and no further explanation from Cauchy. Further details will be forthcoming, he adds.

AGL: IVI now, clusters and telematics tomorrow

For now, AGL is primarily focused on IVI, defining requirements for services such as WiFi, Bluetooth, multimedia, application lifecycle management, windowing, power management, and location based services. It does, however, define connectivity and interaction with CAN- and MOST-based vehicle buses, complete with APIs for middleware and applications.
"There are also growing requirements for aligning with IoT efforts for seamless connectivity to other devices and the cloud," says Cauchy. He notes that on the AGL's related Tizen IVI platform, "there has been a lot of work on the Remote Vehicle Interaction project. The RVI sub-project is said to "build a reference implementation of the infrastructure that drives next generation's connected vehicle services."
rvi backend
On the AGL's related Tizen IVI platform, the Remote Vehicle Interaction project is working on a reference implementation for the infrastructure that drives connected vehicle services.
There are no current plans to add Android Auto or Apple CarPlay support to AGL, says Cauchy. However, he notes that "an AGL based system is perfect for implementing a CarPlay or Android Auto solution. It is up to the automotive OEM to port CarPlay or Android Auto and take care of the necessary agreements with Apple and Google."
Cauchy also went out of his way to correct the common misperception that these "projection" technologies are complete IVI specs like AGL, GENIVI, or proprietary platforms such as Windows Embedded Automotive. While Google has suggested that Android Auto could evolve into such a full-blown stack, it is currently limited to defining interactions with Android smartphones and tablets within the car.
A week ago, Hyundai announced the first Android Auto implementation from a carmaker. The technology will appear in its 2015 Sonata cars.
This week, Mitsubishi announced it would add both Android Auto and CarPlay support to the European version of the 2016 Pajero SUV, known as the Montero in the U.S. It's unclear if this is related to Mitsubishi's recently announced, FlexConnect.IVI system, which runs Android on a Texas Instruments Jacinto 6 SoC. FlexConnect.IVI is notable for controlling IVI, heads up display, and cluster displays simultaneously. Finally, Pioneer recently announced Android Auto support in some of its NEX aftermarket multimedia receivers.
Cauchy had no comment on the progress of the GlobalLogic-backed Automotive Grade Android (AGA), which we reported on last summer. This offshoot of AGA, of which GlobalLogic is a Silver member, is a Jacinto 6-based Android reference platform that uses Xen virtualization technology.
At the Automotive Linux Summit, AGL also announced four new members including Sony, Alps Electric, Konsulko Group, and Virtual Open Systems. They join several dozen other members, led by gold members Intel, Jaguar/Land Rover, Panasonic, Renesas, ST, and Toyota.
Cauchy wouldn't say when the first cars with AGL-compliant systems would hit the road. However, he noted that Toyota and Jaguar/Land Rover are both very active in the project. Other carmaker members include Nissan and Mitsubishi.
The open source AGL Requirements Specification v1.0 is now available for public download. Participants can call upon collaborative tools such as Git repositories, Gerrit code review, Jira bug tracking, and a Doors database.

Linux Hotplug a CPU and Disable CPU Cores At Run Time

$
0
0
http://www.cyberciti.biz/faq/debian-rhel-centos-redhat-suse-hotplug-cpu

I would like to dynamically enable or disable a CPU on a running system. How do I hotplug a CPU on a running Linux system? How do I disable cpu cores on a Linux operating system at run time?

Linux kernel does supports cpu-hotplug mechanism. You can enable or disable CPU or CPU core without a system reboot. CPU hotplug is not just useful to replace defective components it can also be applied in other contexts to increase the productivity of a system. For example on a single system running multiple Linux partitions, as the workloads change it would be extremely useful to be able to move CPUs from one partition to the next as required without rebooting or interrupting the workloads.
Tutorial details
DifficultyIntermediate (rss)
Root privilegesYes
RequirementsNone
Estimated completion time5m
This is known as dynamic partitioning. Other applications include Instant Capacity on Demand where extra CPUs are present in a system but aren't activated. This is useful for customers that predict growth and therefore the need for more computing power but do not have at the time of purchase the means to afford. Please note that not all server supports cpu hotplug but almost all server can support disabling or enabling cpu core on a Linux operating systems. There are couple OEMS that support NUMA hardware which are hot pluggable as well, where physical node insertion and removal require support for CPU hotplug. This tutorial will explain how to hotplug a cpu and disable/enable core on a Linux.

List all current cpus and cores in the system

Type the following command:
# cd /sys/devices/system/cpu
# ls -l

Sample output:
total 0
drwxr-xr-x 4 root root 0 Apr 2 12:03 cpu0
drwxr-xr-x 4 root root 0 Feb 15 07:06 cpu1
drwxr-xr-x 4 root root 0 Feb 15 07:06 cpu2
drwxr-xr-x 4 root root 0 Feb 15 07:06 cpu3
drwxr-xr-x 4 root root 0 Feb 15 07:06 cpu4
drwxr-xr-x 4 root root 0 Feb 15 07:06 cpu5
drwxr-xr-x 4 root root 0 Feb 15 07:06 cpu6
drwxr-xr-x 4 root root 0 Feb 15 07:06 cpu7
-rw-r--r-- 1 root root 4096 Apr 2 12:03 sched_mc_power_savings
I've total 8 core cpu logically started from cpu0 to cpu7. To get more human readable format, try:
# lscpu
Sample outputs:
Architecture:          x86_64
CPU op-mode(s): 32-bit, 64-bit
Byte Order: Little Endian
CPU(s): 32
On-line CPU(s) list: 0-31

Thread(s) per core: 2
Core(s) per socket: 8
Socket(s): 2
NUMA node(s): 2
Vendor ID: GenuineIntel
CPU family: 6
Model: 45
Stepping: 7
CPU MHz: 2000.209
BogoMIPS: 4001.65
Virtualization: VT-x
L1d cache: 32K
L1i cache: 32K
L2 cache: 256K
L3 cache: 20480K
NUMA node0 CPU(s): 0-7,16-23
NUMA node1 CPU(s): 8-15,24-31
Under each directory you would find an "online" file which is the control file to logically online/offline a processor.

How do I logically turn off (offline) cpu#6 ?

Warning: It is not possible to disable CPU0 on Linux systems i.e do not try to take cpu0 offline. Some architectures may have some special dependency on a certain CPU. For e.g in IA64 platforms we have ability to sent platform interrupts to the OS. a.k.a Corrected Platform Error Interrupts (CPEI). In current ACPI specifications, we didn't have a way to change the target CPU. Hence if the current ACPI version doesn't support such re-direction, we disable that CPU by making it not-removable. In such cases you will also notice that the online file is missing under cpu0.
Type the following command:
# echo 0 > /sys/devices/system/cpu/cpu6/online
# grep "processor" /proc/cpuinfo

How do I logically turn on (online) cpu#6 ?

Type the following command:
# echo 1 > /sys/devices/system/cpu/cpu6/online
# grep "processor" /proc/cpuinfo

Sample session:
Fig.01: Howto enable and disable CPU core in  on a multi-core server
Fig.01: Howto enable and disable CPU core in on a multi-core server

Once done, you can can actually remove CPU if your BIOS and server vendor supports such operation.

How do I verify cpu is online and offline?

Type the following cat command to see a list of cpus which are online:
# cat /sys/devices/system/cpu/online
To see a list of all offline cpus, run:
# cat /sys/devices/system/cpu/offline

Further readings:

OpenDaylight is One of the Best Controllers for OpenStack — Here’s How to Implement It

$
0
0
http://thenewstack.io/opendaylight-is-one-of-the-best-controllers-for-openstack-heres-how-to-implement-it

14090408637_171cdb0eda_k
This is part two of our posts about implementing controllers with OpenStack. Part one explored SDN’s scale out effect on OpenStack Neutron.
The integration of OpenStack and OpenDaylight (ODL) is a hot topic, with abundant, detailed information available; however, the majority of these articles focus on explaining usage aspects, rather than how the integration is implemented.
In this article, we’ll focus on detailed implementation of integrating the differing components. Here are some extremely useful references:
From these links we can summarize the complete setup process as follows:
  1. Build and install the appropriate OpenDaylight edition (depending on your implementation choice) on a virtual or physical machine. Ensure that you have the right bundles to implement the Neutron APIs (OVSDB, VTN Manager, LISP, etc.).
  2. Start the OpenDaylight controller with the appropriate configurations.
  3. Deploy OpenStack, preferably with a multi-node configuration – a control node, a network node, and one or more compute nodes.
  4. Perform the necessary OpenStack configurations for interaction with the OpenDaylight controller:
    1. Ensure the core plugin is in ML2.
    2. Add OpenDaylight as one of the “mechanism_drivers” in ML2.
    3. Setup the “[ml2_odl]” section in the “ml2_conf.ini” file with the following:
      1. username = admin
      2. password = admin
      3. url = http://IP-Address-Of-OpenDayLight:8080/controller/nb/v2/neutron
  5. Start creating and adding VMs from OpenStack, with their corresponding virtual networks.
  6. Verify the same (topologies) from the OpenDaylight GUI.
There are also excellent videos which demonstrate the step-by-step process of integrating OpenStack and OpenDaylight.

Integration of OpenStack and OpenDaylight 

The overall process of OpenStack and OpenDaylight integration is summarized in figure one. On the OpenStack front, Neutron consists of the ML2 mechanism driver, which acts as a REST proxy and passes all Neutron API calls into OpenDaylight. OpenDaylight contains a northbound REST service (called Neutron API service) which caches data from these proxied API calls and makes it available to other services inside of OpenDaylight. Shown below, when we describe the two components in detail, these RESTful APIs achieve the binding of OpenStack and OpenDaylight.
FigureOne
Figure One: OpenStack and OpenDaylight Integration

OpenStack

As introduced in SDN Controllers and OpenStack, the modular layer 2 (ML2) plugin for OpenStack Neutron is a framework designed to utilize the variety of layer 2 networking technologies simultaneously. The main idea behind the ML2 plugin is to separate the network type from the mechanism that realizes the network type. Drivers within the ML2 plugin implement extensible sets of network types (local, flat, VLAN, GRE and VXLAN), and mechanisms to access these networks.
In ML2, the registered mechanism drivers, which are typically vendor-specific, are called twice when the three core resources — networks, subnets and ports — are created, updated or deleted. The first call, typically referred to as a pre-commit call, is part of the DB transaction, where driver-specific states are maintained. In the case of the OpenDaylight mechanism driver, this pre-commit operation is not necessary. Once the transaction has been committed, the drivers are called again, typically referred as a post-commit call, at which point they can interact with external devices and controllers.
4
Figure Two: ML2 Mechanism Driver Architecture
Mechanism drivers are also called as part of the port binding process, to determine whether the associated mechanism can provide connectivity for the network, and if so, the network segment and VIF driver to be used.
Figure two above summarizes OpenStack Neutron’s ML2 OpenDaylight mechanism driver architecture. The OpenDaylight mechanism driver is made up of a single file “mechanism_odl.py” and a separate networking OpenDaylight driver. The mechanism driver is divided into two different parts (core and extension), based on API handling. The OpenDaylight mechanism driver and OpenDaylight drive classes implement the core APIs. OpenDaylight’s L3 router plugin class realizes the extension APIs only. Firewall as a service (FWaaS) and load balancing as a service (LBaaS) are currently not supported by the ODL driver.
The OpenDaylight mechanism driver receives the calls to create/update/delete the core resources (network, subnet and port). It forwards these calls to the OpenDaylight driver class by invoking the synchronize function. This function, in turn, invokes the ‘sendjson’ API.
Similarly, the OpenDaylight L3 router plugin class handles the L3 APIs to create/update/delete the router and floating IPs. Hence, the final call for both the core and L3 extension APIs is “sendjson” – which sends a REST request to the OpenDaylight controller and waits for the response.
In the next section, we’ll see how OpenDaylight handles these REST calls.

OpenDaylight

OpenDaylight exposes the OpenStack Neutron API service – which provides Neutron API handling for multiple implementations. Figure three summarizes the architecture of Neutron API implementation in OpenDaylight. There are mainly three different bundles that constitute the Neutron API service – termed Northbound API, Neutron Southbound provider interface (SPI) and transcriber – and a collection of implementations. In this section, we will take a detailed look at these components.
2
Figure 3: OpenDaylight Neutron API Implementation Architecture

Northbound API Bundle

This bundle handles the REST requests from the Openstack plugin and returns the appropriate responses. The contents of the Northbound API bundle can be described as follows:
  1. A single parent class for requests: IneutronRequest.
  2. A collection of JAXB (Java architecture for XML Binding) annotated request classes for each of the resources: network, subnet, port, firewall, load balancer, etc. These classes are used to represent a specific request, which implements the IneutronRequest interface. For example, the network request contains the following attributes: class NeutronNetworkRequest implements INeutronRequest
    @XmlElement(name="network")
    NeutronNetwork singletonNetwork;
    @XmlElement(name="networks")
    List bulkRequest;
    @XmlElement(name="networks_links")
    List links;
  3. A collection of Neutron northbound classes* which provide REST APIs for managing corresponding resources. For example, NeutronNetworksNorthbound class includes the following APIs: listNetworks(), showNetwork(), createNetworks(), updateNetwork() and deleteNetwork().
The symbol *, unless mentioned otherwise, represents any of the following: network, subnet, port, router, floating IP, security group, security group rules, load balancer, load balancer health, load balancer listener, load balancer pool, etc.

Neutron SPI Bundle

This is the most important bundle that links the northbound APIs to the appropriate implementations. The Neutron southbound protocol interface (SPI) bundle includes the following:
    1. JAXB (Java architecture for XML binding) annotated base class and subclasses, named Neutron* for supporting the API documented in networking API v2.0.
    2. INeutron*CRUD interfaces, which are implemented by the transcriber bundle.
    3. INeutron*Aware interfaces, which are implemented by the specific plugins (OpenDove, OVSDB, VTN, etc.).
Images-SDNController-Openstack-Part3-5
The symbol *, unless mentioned otherwise, represents any of the following: Network, subnet, port, router, floating-IP, security-group, security-group rules, load-balancer, load-balancer health, load-balancer listener and load-balancer-pool etc.

Transcriber Bundle

The transcriber module consists of a collection of Neutron*Interface classes, which implement the INeutron*CRUD interfaces for storing Neutron objects in caches. Most of these classes include a concurrent HashMap. For example, private ConcurrentMap portDB = new ConcurrentHashMap() – and all the add, remove, and get operations work on this HashMap.

Implementation Bundle

The advantage of OpenDaylight is it includes multiple implementations of Neutron networks, providing several ways to integrate with OpenStack. The majority of the northbound services that aim to provide network virtualization can be used as an implementation of the Neutron networks. Hence, OpenDaylight includes the following options for Neutron API implementations:
  1. OVSDB: OpenDaylight has northbound APIs to interact with Neutron, and uses OVSDB for southbound configuration of vSwitches on compute nodes. Thus OpenDaylight can manage network connectivity and initiate GRE or VXLAN tunnels for compute nodes. OVSDB Integration is a bundle for OpenDaylight that will implement the Open vSwitch Database management protocol, allowing southbound configuration of vSwitches. It is a critical protocol for Network Virtualization with Open vSwitch forwarding elements. OVSDB neutron bundle in the virtualization edition supports network virtualization using VXLAN and GRE tunnel for OpenStack and CloudStack deployments
  2. VTN Manager (Virtual Tenant Network): VTN manager, one of the network virtualization solutions in OpenDaylight, is implemented as an OSGi (Open Services Gateway initiative) bundle of controllers using AD-SAL, and manages OpenFlow switches. VTN Manager can also include a separate component that works as a network service provider for OpenStack. VTN Manager’s Neutron component enables OpenStack to work in pure OpenFlow environments, in which all switches in the data plane support OpenFlow. VTN Manager can also make use of OVSDB-enhanced VTN. Neutron bundles can make use of OVSDB plugins for operations such as port creation.
  3. Open DOVE: Open DOVE is a “network virtualization” platform with a full control plane implementation for OpenDaylight and data plane based on “Open vSwitch.” It aims to provide logically isolated multitenant networks with layer-2 or layer-3 connectivity, and runs on any IP network in a virtualized data center. Open DOVE is based on IBM SDN virtual environments and DOVE technology from IBM Research. Open DOVE has not been updated after the Hydrogen release, and its existence in the Lithium release of OpenDaylight is doubtful.
  4. OpenContrail (plugin2oc): provides the integration/interworking between the OpenDaylight controller and the OpenContrail platform. This combined open source solution will seamlessly enable OpenContrail platform capabilities such as cloud networking and network functions virtualization (NfV) within the OpenDaylight project.
  5. LISP Flow Mapping: Locator/ID Separation Protocol (LISP) aims to provide a “flexible map-and-encap framework that can be used for overlay network applications, and decouples network control plane from the forwarding plane.” LISP includes two namespaces: endpoint identifiers (EIDs — IP address of the host), and routing locators (RLOCs —IP address of the LISP router to the host). LISP flow mapping provides LISP mapping system services, which store and serve the mapping data (including a variety of routing policies such as traffic engineering and load balancing) to data plane nodes, as well as to OpenDaylight applications.
These implementations typically realize some or all of the following handlers: network, subnet, port, router, floating-IP, firewall, firewall policy, firewall rule, security group, security group rules, load balancer, load balancer health, load balancer listener, load balancer pool and load balancer pool member. These handlers support create, delete and update operations for the corresponding resource. For example, a NeutronNetworkHandler implements the following operations for the network resource:
canCreateNetwork(NeutronNetwork network)
neutronNetworkCreated(NeutronNetwork network)
canUpdateNetwork(NeutronNetwork delta, NeutronNetwork original)
neutronNetworkUpdated(NeutronNetwork network)
canDeleteNetwork(NeutronNetwork network)
neutronNetworkDeleted(NeutronNetwork network)
The exact mechanism involved in these handlers depends on the southbound plugin they use: OpenFlow (1.0 or 1.3), OVSDB, LISP, REST (OpenContrail), etc. Let us use the example of a NeutronNetworkCreated handler in VTN Manager. The steps involved in this handler can be summarized as:
  1. Check if the network can be created (again) by calling canCreateNetwork.
  2. Convert Neutron network’s tenant ID and network ID to tenant ID and bridge ID, respectively.
  3. Check if a tenant already exists, and if not, create a tenant.
  4. Create a bridge and perform VLAN mapping.
For the actual operations, the Neutron component of VTN manager invokes VTN manager’s core function, which in turn uses the OpenFlow (1.0) plugin to make necessary configurations on the OpenFlow switches.

Using All Bundles for Network Creation

3
Figure Four: Process for Network Creation in OpenDaylight
Figure four above briefly summarizes the process involved in network creation, and the corresponding calls in all of the above described bundles of the Opendaylight Neutron implementation. This figure should help the reader understand the control flow across all the bundles.
In summary, OpenDaylight is one of the best open source controllers for providing OpenStack integration. Though the support for load balancer and firewall services is still missing, the freedom of multiple implementations and support of complete core APIs itself provides immense advantage and flexibility to the administrator. In the near future, we can expect OpenDaylight to support all the extensions of OpenStack to achieve the perfect integration.

How to Boot a Linux Live USB Drive on Your Mac

$
0
0
http://www.howtogeek.com/213396/how-to-boot-a-linux-live-usb-drive-on-your-mac


Think you can just plug a standard Linux live USB drive into your Mac and boot from it? Think again. You’ll need to go out of your way to create a live Linux USB drive that will boot on a Mac.
This can be quite a headache, but we’ve found a graphical utility that makes this easy. You’ll be able to quickly boot Ubuntu, Linux Mint, Kali Linux, and other mainstream Linux distributions on your Mac.

The Problem

RELATED ARTICLE
How to Create Bootable USB Drives and SD Cards For Every Operating System
Creating installation media for your operating system of choice used to be simple. Just download an ISO and burn it... [Read Article]
Apple’s made it difficult to boot non-Mac OS X operating systems off of USB drives. While you can connect an external CD/DVD drive to your Mac and boot from standard Linux live CDs and USBs, simply connecting a Linux live USB drive created by standard tools like Universal USB Installer and uNetbootin to a Mac won’t work.
There are several ways around this. For example, Ubuntu offers some painstaking instructions that involve converting the USB drive’s file system and making its partitions bootable, but some people report these instructions won’t work for them. There’s a reason Ubuntu recommends just burning a disc.
rEFInd should allow you to boot those USB drives if you install it on your Mac. But you don’t have to install this alternative UEFI boot manager on your Mac. The solution below should allow you to create Linux live USB drives that will boot on modern Macs without any additional fiddling or anything extra — insert, reboot, and go.

Use Mac Linux USB Loader

RELATED ARTICLE
How to Use Your Mac’s Disk Utility to Partition, Wipe, Repair, Restore, and Copy Drives
Your Mac includes a built-in partition manager and disk management tool known as Disk Utility. It’s even accessible from Recovery... [Read Article]
A tool named “Mac Linux USB Loader” by SevenBits worked well for us. This Mac application will allow you to create USB drives with your preferred Linux distro on them from within Mac OS X in just a few clicks. You can then reboot and boot those USB drives to use the Linux distribution from the live system.
Note: Be sure to move the Mac Linux USB Loader application to your Applications folder before running it. This will avoid a missing “Enterprise Source” error later.
First, insert the USB drive into your Mac and open the Disk Utility application. Check that the USB drive is formatted with an MS-DOS (FAT) partition. If it isn’t, delete the partition and create a FAT partition — not an ExFAT partition.

Next, open the Mac Linux USB Loader application you downloaded. Select the “Create Live USB” option if you’ve already downloaded a Linux ISO file. If not, select the “Distribution Downloader” option to easily download Linux distribution ISOs for use with this tool.

Select the Linux distribution’s ISO file you downloaded and choose a connected USB drive to put the Linux system on.

Choose the appropriate options and click “Begin Installation” to continue. Mac Linux USB Loader will create a bootable USB drive that will work on your Mac and boot into that Linux distribution without any problems or hacks.

Before booting the drive, you may want to change some other options here. For example, you can set up “persistence” on the drive and part of the USB drive will be reserved for your files and settings. This only works for Ubuntu-based distributions.
Click “Persistence Manager” on the main screen, choose your drive, select how much of the drive should be reserved for persistent data, and click “Create Persistence” to enable this.

Booting the Drive

RELATED ARTICLE
How to Install and Dual Boot Linux on a Mac
Installing Windows on your Mac is easy with Boot Camp, but Boot Camp won’t help you install Linux. You’ll have... [Read Article]
To actually boot the drive, reboot your Mac and hold down the Option key while it boots. You’ll see the boot options menu appear. Select the connected USB drive. The Mac will boot the Linux system from the connected USB drive.
If your Mac just boots to the login screen and you don’t see the boot options menu, reboot your Mac again and hold down the Option key earlier in the boot process.


This solution will allow you to boot common Linux USB drives on your Mac. You can just boot and use them normally without modifying your system.
Exercise caution before attempting to install a Linux system to your Mac’s internal drive. That’s a more involved process.
Viewing all 1406 articles
Browse latest View live


<script src="https://jsc.adskeeper.com/r/s/rssing.com.1596347.js" async> </script>