Quantcast
Channel: Sameh Attia
Viewing all 1413 articles
Browse latest View live

Monkeying around on the bash command line in 2016

$
0
0
http://www.computerworld.com/article/3018637/open-source-tools/monkeying-around-on-the-bash-command-line-in-2016.html


Year of the Monkey
Soon it will be 2016 -- the Year of the Monkey in the Chinese Zodiac's 12 year cycle. People born in these years (e.g., 1920, 1932, 1944, 1956, 1968, 1980, 2004, and now 2016) are supposed to be quick-witted, optimistic, ambitious, etc. So, let's see what quick-witted, optimistic, ambitious things we can do to monkey around on the command line more gracefully.
To start, let's look at some of the more unusual and less obvious things that you can do with Linux history. The tricks that most command line users know include these relatively easy commands:
Example   Description
======= ===========
!e run the last command you ran that started
with "e"
!22 run the 22nd command as stored in the
history commands
!! run the previously entered command
sudo !! run the previous command using sudo (very
helpful if you forgot to use sudo and don't
want to retype the entire command)
sudo !e run the last command you ran that starting
with "e" using sudo
sudo !22 run the 22nd command in your history using
sudo
Less obvious are commands such as !-2 that run previous commands based on how far we have to reach back in our history. This one runs the command that was entered two commands ago (i.e., the command before the most recent command).
$ echo one
one
$ echo two
two
$ echo three
three
$ !-2
echo two
two
Command line substitution commands can also be very helpful. One that I find fairly useful is !$ which allows you to reuse the last string from the previous command. Here's an example where the argument is a fairly long path:


# ls /home/jdoe/scripts/bin
showmypath trythis
# cd !$
cd /home/jdoe/scripts/bin
Here's another example that might make it easier to see that only the last of three arguments is reused.
# echo one two three
one two three
# echo !$
echo three
three
# echo one two three
one two three
# echo !^
echo one
one
Clearing history can be useful if you want to focus on just recent commands, though this doesn't clear out your .bash_history file. You should also remove the file if you want your command history removed from the system.
# history -c
# history
238 history
Some other interesting options for history commands include using HISTCONTROL settings. These allow you to ignore commands entered with preceding blanks, ignore duplicate commands (when they've been entered consecutively), and do both.
HISTCONTROL=
ignoredups ignore duplicate commands
ignorespace ignore commands starting with spaces
ignoreboth ignore consecutive duplicates and commands starting with blanks
HISTSIZE set the size of your history queue
The first of these (HISTCONTROL=ignoredups) ensures that, when you type the same command multiple times in a row, you will only see one of the repeated commands in your history file. Notice how the pwd command appears only once in the history output though we entered it three times.


# pwd
/home/jdoe/bin
# pwd
/home/jdoe/bin
# pwd
/home/jdoe/bin
# echo hello
hello
# history | tail -4
249 HISTCONTROL=ignoredups
250 pwd
251 echo hello
252 history | tail -4
The second option (HISTCONTROL=ignorespace) means that, when you start a command with blanks, it won't be stored in your history file. This can be very useful when you want to run commands that you don't want recorded (e.g., when they include a password).
#      echo do not store this command in my history
do not store this command in my history
# echo ok
ok
# history -3
244 clear
245 echo ok
246 history -3
The third (HISTCONTROL=ignoreboth) option sets up both of these history control settings.
The HISTSIZE setting adjusts the size of your history queue. Unless you make this change permanent by putting in one of your dot files (e.g., .bashrc), the setting won't persist and your history queue will go back to its original size.
The following command line options are useful, but hard enough to remember that many of these changes might be easier to do manually than trying to store these tricks in your head. And keep in mind that the position of the cursor on the command line often determines what each of the commands will do. Fortunately, there's an undo command to reverse any change you just made.
ctl+a    move to the beginning of the command line
ctl+e move to end of line
alt+f move to space following the end of the word
alt+b move to start of current or previous word (if you're in
the space)
ctl+t swap 2 characters (the current and preceding)
alt+t swap the current and previous words
ctl+u cut text before cursor
ctl+w cut part of the word before the cursor
ctl+k cut text of current command after the curssor
ctl+y paste the cut text after the cursor
alt+u uppercase the next word or remaining part of current
word (curson and on)
alt+l lowercase the next word
alt+c capitalize the next word
ctl+L clear the screen
ctl+_ undo the change you just made

In all of these command line tricks, alt+ means hold down the alt key and then type the letter that follows while ctl+ mans hold down the control key. I show the subsequent letters all in lowercase since you don't need to use the shift key.
Position your cursor on the "three" in this echo command and you'll see the two and three swapping places:
$ echo one two three four five
one two three four five
$ echo one three two four five
While these are all nice options for manipulating your commands, you might find that many are just not worth trying to keep all the alt and ctl sequences straight. Maybe several will come in handy depending on the command line changes you frequently need to make.

How to reset the password in an LXC container

$
0
0
http://ask.xmodulo.com/reset-password-lxc-container.html

Question: I created an LXC container, but I cannot log in to the container as I forgot the default user's password and the root password. How can I reset the password on an LXC container?
When you create an LXC container, it will have the default username/password set up. The default username/password will vary depending on which LXC template was used to create the container. For example, Debian LXC will have the default username/password set to root/root. Fedora LXC will have the root password set as expired, so it can be set on the first login. Ubuntu LXC will have ubuntu/ubuntu as the default username/password. For any pre-built container images downloaded from third-party repositories, their default username/password will also be image-specific.
If you do not know the default username/password of your LXC container, there is an easy way to find the default username and reset its password.
First of all, make sure to stop the LXC container before proceeding.
$ sudo lxc-stop -n

Find the Default User of an LXC Container

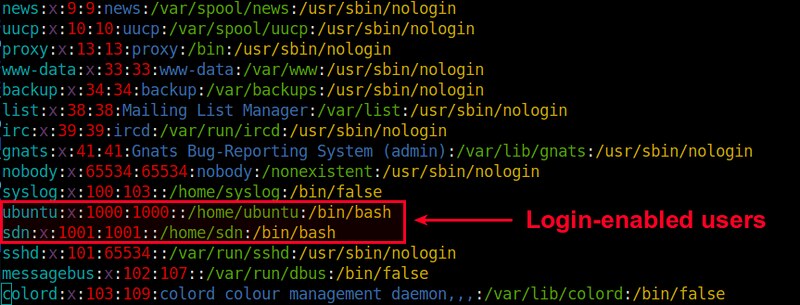
To find the default username created in an LXC container, open the /etc/passwd of the container, which can be found at /var/lib/lxc//rootfs/etc/passwd of the LXC host. In the passwd file of the container, look for "login-enabled" users, which have "/bin/bash" (or something similar) listed as their login shell. Any of such usernames can be the default username of the container. For example, in the screenshot below, the usernames "ubuntu" or "sdn" are login-enabled.

Any username which has "/usr/sbin/nologin" or "/bin/false" as its login shell is login-disabled.

Reset the User Password in an LXC Container

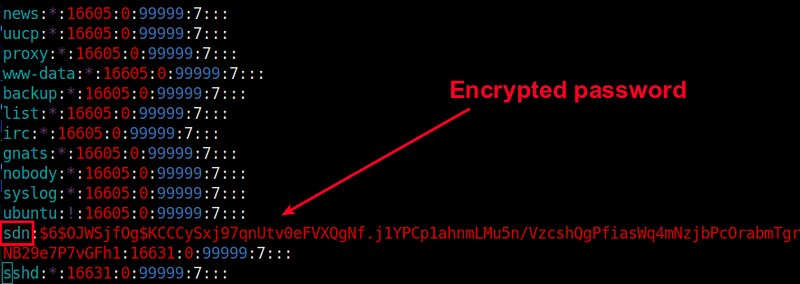
To reset the password of any login-enabled username, you can modify /etc/shadow file of the container, which can be fount at /var/lib/lxc//rootfs/etc/shadow of the LXC host. In Linux, the /etc/shadow file stores one-way encrypted passwords (password hashes) of user accounts. Each line in /etc/shadow is formatted as strings concatenated with ":" delimeter. The first two strings represent a username and its encrypted password.
::16728:0:99999:7:::

If the password field is set to '!' or '*', it means the user account is locked for access or completely disabled for login.
To reset the password of any login-enabled username, all you have to do is to remove the password hash of the username and leave the ":" delimeter only. For example, for username "sdn", change:
sdn:$6$OJWSjfOg$KCCCySxj97qUtv0eFVXQgNf.j1YPCp1ahnmLMu5n/VzcshQgPfiasWq4mNzjbPcOrabmTgrRNB29e7P7vGFh1:16631:0:99999:7:::
to:
sdn::16631:0:99999:7:::
Similarly, to reset the root password, simply delete the password hash of the root.
root::16631:0:99999:7:::
With the password field set to empty, you will be able to login to the user account without any password from the console. Now start the container, and verify password-less console login.
Don't forget to set a new password using passwd after successful login.

What Is Fork Bomb And How Can You Prevent This Danger?

$
0
0
http://www.unixmen.com/fork-bomb-can-prevent-danger

If you are not thrilled with the real bomb, you can try typing this  :(){ :|:& };: on your Linux terminal to crash your computer. you do not need to be the root user to do that. That string is known as the Fork bomb. Before you get to know how that works, it would be better to know what a fork bomb does exactly.

WHAT IS A FORK BOMB?
Fork_bomb
The name sounds Fork bomb does not throw dining forks at you, when you executing the strings in terminal. In terms of nixology (Linux & Unix) the word fork means, to create a new process.Similarly, when you create a new process using ‘fork’ (actually a function that can be called on Linux/Unix-like machines), the new process is created from the image of the original one and is basically a inherited copy of the parent process.
A fork bomb will calls the fork function indefinitely and rapidly in no time, thus exhausting all system resources. It comes in the category of Denial of Service attack due to its nature of quickly ripping up system resources and making it unusable within a very short span of time.
All these special characters stands with their unique functionality in *nix operating system. Fork bomb actually associated with the concept of recursion in bash script by using functions in it.
Syntax of function in bash,

function_name()
{
Commands
}
HOW FORK BOMB WORKS?
In this case ‘:’ colon is the function name then followed by ‘()’ parentheses and curly brace ‘{‘ to open a function, then the definition of ‘:|:&’ tells the bash  to launch the ‘:’ function and ‘|’ pipe its output to the same function ‘:’ and send the process to the background defined by ‘&’, so that it can’t be killed by hitting “Ctrl + C”. Then the close curly brace ‘}’ followed by ‘:;’ which points the function again to keep the process recursive.
To launch the bomb, all you need to do is just to copy or type   :(){ :|:& };:  this code in Terminal and hit Enter. Your session will get slow down to hell in matter of seconds and you will be left with no option but to go with warm reset. The actual time in which your system will succumb to paralysis depends on the speed of your processor, number of processing cores available and the amount of RAM installed. Even though the size of swap partition is also a factor, if it starts getting used by the bomb, the system would typically take long enough to respond for you.
Before we proceed further let me make sure that Fork bomb is not a property of Linux, the technique of creating new processes does work on Windows as well and also the same problem can be raised in other system programming languages such as C or C++, for your instance  compile the following code and execute it, you will come to know that.

FORK BOMB IN C
#include
int main(void) {
    for(;;)
    fork();
    return 0;
}


HOW TO PROTECT FROM FORK BOMB?Fork bombs hang the system by creating a ‘N’ number of processes. The worst part is that one does not even need to be the super user to launch a fork bomb. To shield your system from Fork bomb ensure that you are limiting the number of processes to the local users where they could create, you can limit around 1000 to 4000 process for the local users to create. Generally a user could work about 200-300 process at same time. However for people who do a lot of multitasking, 1000 might be little less.
Understanding /etc/security/limits.conf file!
Each line describes a limit for a user in the form:

Where:

  • can be:
    • an user name
    • a group name, with @group syntax
    • the wildcard *, for default entry
    • the wildcard %, can be also used with %group syntax, for maxlogin limit
  • can have the two values:
    • “soft” for enforcing the soft limits
    • “hard” for enforcing hard limits
  • can be one of the following:
    • core – limits the core file size (KB)
  • can be one of the following:
    • core – limits the core file size (KB)
    • data – max data size (KB)
    • fsize – maximum filesize (KB)
    • memlock – max locked-in-memory address space (KB)
    • nofile – max number of open files
    • rss – max resident set size (KB)
    • stack – max stack size (KB)
    • cpu – max CPU time (MIN)
    • nproc – max number of processes
    • as – address space limit
    • maxlogins – max number of logins for this user
    • maxsyslogins – max number of logins on the system
    • priority – the priority to run user process with
    • locks – max number of file locks the user can hold
    • sigpending – max number of pending signals
    • msgqueue – max memory used by POSIX message queues (bytes)
    • nice – max nice priority allowed to raise to
    • rtprio – max realtime priority
    • chroot – change root to directory (Debian-specific)
To limit the number of processes according to the users, you can open the file /etc/security/limits.conf and add the following line at the bottom:

mohammad hard nproc 4000

This will keep the the specified user account to restrict more than 4000 processes. Save the file and reboot the system and try with launching the Fork bomb. System should prevent the crash and withstand the attack now!
If a Fork bomb has already been launched and the restrictions for number of processes are active, you can login as root and kill all the bash processes to terminate the fork bomb. In case if a Fork bomb script is activated by a local user and you haven’t restrict the number of processes to that particular user, but still your CPU left with little time to clear the Fork bomb.
You should not use the following command to kill the script.

$killall -9 Script_Name

This will not work due the nature of a fork bomb. The reason is the killall does not hold a lock on the process table so each one that is killed a new one takes its place in the process table. Also you will not be able to run a killall due to the shell forking off another shell to run the killall.
Instead you can run these command to stop Fork bomb,

$ exec killall -9 ScritName

$ exec killall STOP ScriptName
NOTE :
This Restrictions will have no effect on the root user or any process with the CAP_SYS_ADMIN or CAP_SYS_RESOURCE capabilities are not affected by this kind of limitation on a Linux based system.
Hope you enjoyed the article , make me happy with your comments if you have any questions :-)

How to setup a intermediate compatible SSL website with LetsEncrypt certificate

$
0
0
https://www.howtoforge.com/tutorial/how-to-setup-intermediate-compatible-ssl-website-with-letsencrypt-certificate

Let’s Encrypt is a free, automated, and open certificate authority (CA), run for the public’s benefit.
The key principles behind Let’s Encrypt are:
  • Free: Anyone who owns a domain name can use Let’s Encrypt to obtain a trusted certificate at zero cost.
  • Automatic: Software running on a web server can interact with Let’s Encrypt to painlessly obtain a certificate, securely configure it for use, and automatically take care of renewal.
  • Secure: Let’s Encrypt will serve as a platform for advancing TLS security best practices, both on the CA side and by helping site operators properly secure their servers.
  • Transparent: All certificates issued or revoked will be publicly recorded and available for anyone to inspect.
  • Open: The automatic issuance and renewal protocol will be published as an open standard that others can adopt.
  • Cooperative: Much like the underlying Internet protocols themselves, Let’s Encrypt is a joint effort to benefit the community, beyond the control of any one organization.
(source: https://letsencrypt.org/about/)

Intro:

First, we have to mention about some dark sides of Let's Encrypt service. However great the idea of free public and open certificate authority is, it brings also many troubles for us. Developers have tried to make the system of obtaining certificates as simple as possible, but it still requires a higher skill of server administering. Therefore, many of developers like the one from ISPConfig (http://www.ispconfig.org/) have implemented this solution directly into their. This brings people more effective deployment and supervision over the whole system much easier and flexible.

Real complication:

Many people have decided to implement Let's Encrypt into their production sites. I find this still a very bad idea to be done without being very (but really very) careful. Let's Encrypt brings you freedom but also limits you in using the certificate with SHA-256 RSA Encryption. Support for SHA-2 has improved over the last few years. Most browsers, platforms, mail clients and mobile devices already support SHA-2. However, some older operating systems such as Windows XP pre-SP3 do not support SHA-2 encryption. Many organizations will be able to convert to SHA-2 without running into user experience issues, and many may want to encourage users running older, less secure systems to upgrade.
In this tutorial, we are going to deal with this incompatibility in a simple, but still nasty way.

Prerequisites:

  • Apache version 2.4 and higher
  • OpenSSL version 1.0.1e and higher
  • Apache mod_rewrite enabled

The whole idea:

As mentioned before, there are still devices incompatible with SHA-256 signature in the Internet. When I was forced to deploy an SSL to some websites, I had to decide from two options:
  1. Using Let's Encrypt having it for free but not for all
  2. Buying a certificate with 128 bit signature
Well, still the option no. 1 was the only way as it was promised to customer long days ago (:

No more theory:

I hope I have explained the needed and now we can deal with the unsupported viewers of our website. There are many people using Windows XP machines with SP2 and lower (Yes, there are still plenty of them). So we have to filter these people.
In your “/etc/apache2/sites-available/your_domain.com.conf” add following on the end of the file:
RewriteEngine on
RewriteCond %{HTTP_USER_AGENT} !(NT\ 5) [NC]
RewriteRule ^(.*) https:// your_domain.com [R]
RewriteCond gets a string from http header of the guest accessing your page. You can simply check yours and find more information here: http://www.useragentstring.com/
The condition we used tells us something like “if string doesn't contain 'NT 5'” then RewriteRule executes/applies the rule of redirecting [R] to https variant of your domain, NT 5 is a OS version string for Windows XP devices.
If you don't use this redirection, incompatible users won't be able to access your https website.
I have to warn you this solution is not 100% perfect as some of guest doesn't have to provide you relevant or real information. I have worked with AWstats to figure out what rate of unknown systems are accessing my page and it is about 1.3%, so pretty few requests. If you want to deal with unknown operating systems to ensure their compatibility, you can add unknown in the condition as well (RewriteCond %{HTTP_USER_AGENT} !(NT\ 5|unknown) [NC]).
AWstats:
Awstats graphic.
After successfully “non-redirecting” your incompatible visitors (keeping them in http insecure world) you can focus on https side.

HTTPS configuration:

Now we assume you already assigned the certificate to your web server and also enabled it.
In your vhost config file again, add following:
SSLCipherSuite ECDHE-RSA-AES128-GCM-SHA256:ECDHE-ECDSA-AES128-GCM-SHA256:ECDHE-RSA-AES256-GCM-SHA384:ECDHE-ECDSA-AES256-GCM-SHA384:DHE-RSA-AES128-GCM-SHA256:DHE-DSS-AES128-GCM-SHA256:kEDH+AESGCM:ECDHE-RSA-AES128-SHA256:ECDHE-ECDSA-AES128-SHA256:ECDHE-RSA-AES128-SHA:ECDHE-ECDSA-AES128-SHA:ECDHE-RSA-AES256-SHA384:ECDHE-ECDSA-AES256-SHA384:ECDHE-RSA-AES256-SHA:ECDHE-ECDSA-AES256-SHA:DHE-RSA-AES128-SHA256:DHE-RSA-AES128-SHA:DHE-DSS-AES128-SHA256:DHE-RSA-AES256-SHA256:DHE-DSS-AES256-SHA:DHE-RSA-AES256-SHA:ECDHE-RSA-DES-CBC3-SHA:ECDHE-ECDSA-DES-CBC3-SHA:EDH-RSA-DES-CBC3-SHA:AES128-GCM-SHA256:AES256-GCM-SHA384:AES128-SHA256:AES256-SHA256:AES128-SHA:AES256-SHA:AES:CAMELLIA:DES-CBC3-SHA:!aNULL:!eNULL:!EXPORT:!DES:!RC4:!MD5:!PSK:!aECDH:!EDH-DSS-DES-CBC3-SHA:!KRB5-DES-CBC3-SHA 
SSLProtocol All -SSLv2 -SSLv3
SSLCompression off
SSLHonorCipherOrder On
The CipherSuite used here is a bit longer than usual. It's for better compatibility. You can get your own from: https://cipherli.st/ or https://mozilla.github.io/server-side-tls/ssl-config-generator/
I must again mention, you wont ever get a perfect configuration to meet the high security policy and also compatibility. You should find a compromise.
After using these settings, you can test your server configuration and compatibility at: https://www.ssllabs.com/ssltest/index.html
You are going to find a long list of compatible devices and the incompatible ones, also some more information to point you for your own “perfect” solution.

How Linux CPU usage time and Percentage can be calculated

$
0
0
https://github.com/Leo-G/DevopsWiki/wiki/How-Linux-CPU-usage-time-and-Percentage-can-be-calculated

Overview

CPU time is allocated in discrete time slices (ticks). For a certain number of time slices, the cpu is busy, other times it is not (which is represented by the idle process). In the picture below the CPU is busy for 6 of the 10 CPU slices. 6/10 = .60 = 60% of busy time (and there would therefore be 40% idle time).

Note: A tick(cycle) is the time it takes to send a single pulse. A pulse consists of a high voltage followed by a low voltage. There can be billions of ticks per second depending on the frequency(GHz) of the CPU clock.
You can get the number of CPU ticks since boot from /proc/stat
 cat /proc/stat
user nice system idle iowait irq softirq steal guest guest_nice
cpu 4705 356 584 3699 23 23 0 0 0 0
  • user: normal processes executing in user mode
  • nice: niced processes executing in user mode
  • system: processes executing in kernel mode
  • idle: twiddling thumbs
  • iowait: waiting for I/O to complete
  • irq: servicing interrupts
  • softirq: servicing softirqs
  • steal: involuntary wait
  • guest: running a normal guest
  • guest_nice: running a niced guest

Formula

To calculate Linux CPU usage time subtract the idle CPU time from the total CPU time as follows:
Total CPU time since boot = user+nice+system+idle+iowait+irq+softirq+steal
Total CPU Idle time since boot = idle + iowait
Total CPU usage time since boot = Total CPU time since boot - Total CPU Idle time since boot
Total CPU percentage = Total CPU usage time since boot/Total CPU time since boot X 100
If you use the formula on the example data above you should get a Linux CPU usage Percentage of 60%.
Note: Guest and Guest_nice are already accounted in user and nice, hence they are not included in the total calculation
For real time CPU usage, you will need to calculate the time between two intervals.
Below is an example of a Bash Script by Paul Colby that does this
    #!/bin/bash
# by Paul Colby (http://colby.id.au), no rights reserved ;)

PREV_TOTAL=0
PREV_IDLE=0

while true; do
# Get the total CPU statistics, discarding the 'cpu ' prefix.
CPU=(`sed -n 's/^cpu\s//p' /proc/stat`)
IDLE=${CPU[3]} # Just the idle CPU time.

# Calculate the total CPU time.
TOTAL=0
for VALUE in "${CPU[@]}"; do
let "TOTAL=$TOTAL+$VALUE"
done

# Calculate the CPU usage since we last checked.
let "DIFF_IDLE=$IDLE-$PREV_IDLE"
let "DIFF_TOTAL=$TOTAL-$PREV_TOTAL"
let "DIFF_USAGE=(1000*($DIFF_TOTAL-$DIFF_IDLE)/$DIFF_TOTAL+5)/10"
echo -en "\rCPU: $DIFF_USAGE% \b\b"

# Remember the total and idle CPU times for the next check.
PREV_TOTAL="$TOTAL"
PREV_IDLE="$IDLE"

# Wait before checking again.
sleep 1
done
Ref https://www.kernel.org/doc/Documentation/filesystems/proc.txt section 1.8
https://github.com/pcolby/scripts/blob/master/cpu.sh
http://stackoverflow.com/questions/23367857/accurate-calculation-of-cpu-usage-given-in-percentage-in-linux
http://serverfault.com/questions/648704/how-are-cpu-time-and-cpu-usage-the-same
http://www.webopedia.com/TERM/C/clock_tick.html
http://www.pcworld.com/article/221559/cpu.html
http://stackoverflow.com/questions/16726779/how-do-i-get-the-total-cpu-usage-of-an-application-from-proc-pid-stat
http://www.ask.com/technology/many-times-system-clock-tick-per-second-1-ghz-processor-b9028ab0b0de7883
https://github.com/torvalds/linux/blob/master/fs/proc/stat.c

Advantages disadvantages of using Proxy vs VPN vs TOR vs TOR and VPN together

$
0
0
http://www.blackmoreops.com/2016/01/04/advantages-disadvantages-of-using-proxy-vs-vpn-vs-tor

What makes you truly anonymous and leaves next to no trace in the internet? In this post I will discuss the advantages disadvantages of Proxy vs VPN vs TOR vs TOR and VPN together.
Ultimate anonymity Advantages and disadvantages of using Proxy, VPN, TOR and TOR and VPN together - blackMORE Ops - 6Internet is a huge and gravely important part of our life these days. It is not anymore so simple “I will find your IP address (and DoS you)” and thus anonymity has became more complex as surveillance became more probing than ever. As more and more things are connected to the ‘Web’, you can potentially expose more info, exploit more, protect more or plunder more than ever. It is very important to be able to monitor and surveillance effectively and at the same time it is very important to be able to bypass surveillance and  monitoring. Why, that’s an entirely different philosophical discussion and I will simply leave that to the users imagination. Understanding Proxy vs VPN vs TOR vs TOR and VPN together is important as these are main methods used for anonymity.
If you are wondering how you can browse the web anonymously, you will be happy to know that there are numerous different methods guaranteeing that nobody is ever going to track you down and threaten you digitally. However, not all of these methods are equally effective and qualitative and this is what has led us in this article.
In this article, I will discuss the pros and cons of using methods like:
  1. Proxy,
  2. VPN
  3. TOR and
  4. TOR and VPN together.
This article will benefit you greatly if you are a mafia Whistle-blower, or a dissident living under regime in which it would be very dangerous to be caught performing certain activity (such as writing political blogs) and such.

What is a Proxy?

A proxy directs your traffic via another computer instead of your own. While there are public and private proxy servers, only private proxies, usually paid, provide any type of stability or reliability. Ultimate anonymity - blackMORE Ops - 3

SOCKS vs HTTP Proxy

A SOCKS server is a general purpose proxy server that establishes a TCP connection to another server on behalf of a client, then routes all the traffic back and forth between the client and the server. It works for any kind of network protocol on any port. SOCKS Version 5 adds additional support for security and UDP. The SOCKS server does not interpret the network traffic between client and server in any way, and is often used because clients are behind a firewall and are not permitted to establish TCP connections to servers outside the firewall unless they do it through the SOCKS server. Most web browsers for example can be configured to talk to a web server via a SOCKS server. Because the client must first make a connection to the SOCKS server and tell it the host it wants to connect to, the client must be “SOCKS enabled.” On Windows, it is possible to “shim” the TCP stack so that all client software is SOCKS enabled. A free SOCKS shim is available from Hummingbird at http://www.hummingbird.com/products/nc/socks/index.html.
An HTTP proxy is similar, and may be used for the same purpose when clients are behind a firewall and are prevented from making outgoing TCP connections to servers outside the firewall. However, unlike the SOCKS server, an HTTP proxy does understand and interpret the network traffic that passes between the client and downstream server, namely the HTTP protocol. Because of this the HTTP proxy can ONLY be used to handle HTTP traffic, but it can be very smart about how it does it. In particular, it can recognize often repeated requests and cache the replies to improve performance. Many ISPs use HTTP proxies regardless of how the browser is configured because they simply route all traffic on port 80 through the proxy server.

Proxy advantages

  1. Proxies are like a Web Filter. The proxy settings are applied to your internet browser whether you’re using MSIE, Chrome, Safari, Firefox, etc.
  2. When browsing the internet through a proxy server, all benefits with that server are used, for example, (Security, Speed, and Geographic Location).
  3. The proxy will only secure traffic via the internet browser using the proxy server settings.

Proxy disadvantages

  1. The primary proxy protocols in use today are SOCKS and HTTP/HTTPS. SOCKS and HTTP proxies provide no encryption, whereas HTTPS proxies offer the same level of encryption as any SSL website.
  2. Proxies were not designed to protect all of your Internet traffic, usually only the browser.
  3. Many proxies pass the user’s original IP address to the destination site, making them unsuitable for security or privacy conscious users.
  4. Proxies must be configured separately for each application (email, browser, third-party apps) and some applications may not support them.

What is a VPN?

Ultimate anonymity - blackMORE Ops - 5A Virtual Private Network is a network connection that enables you to create a secure connection to another location, thereby allowing you to appear as if you were in another place. Your computer creates an encrypted virtual tunnel to the VPN server and all of your browsing appears as if it is coming from the VPN server. All of the Internet traffic goes through this encrypted tunnel, keeping your data from being exposed to eavesdroppers between your computer and the VPN server.
Unlike a Proxy, a VPN service provider(Virtual Private Network) encrypts all of your traffic, replacing your ISP and routing ALL traffic through the VPN server, including all programs and applications. This also will use all benefits of the VPN server such as (Speed, Geopgraphic Location, and Security).
The VPN can be easily connected or disconnected with the click of a button.

VPN advantages

  1. Fast – generally speaking you will see very little slowdown to your raw internet connection speeds when using a VPN service
  2. Location spoofing is very easy – most VPN providers offer servers in many locations worldwide. Because connections are fast, VPN is ideal for streaming geo-restricted media content
  3. Ideal for P2P filesharing – while many providers prohibit it, many are set up with filesharing in mind

VPN disadvantages

It is imperative that you choose a quality VPN service that does not store data or communications logs. In the event that a government agency demands the VPN provider to reveal logs, users would be exposed. Furthermore, it is important that the VPN service implements proper load balancing and server randomization so that users always connect to a different VPN server.
  1. The VPN provider can see your internet activity – and in many countries is required by law to keep records of it, which may be handed over to the authorities or to copyright lawyers.
  2. VPNs are also vulnerable to server raids by the police, in an effort to obtain the information they may contain. This is why it is vital to choose a provider who keeps no logs (and is in a position to keep this promise). Of course, even when a VPN provider promises to keep no logs, you must trust them to keep their word …
  3. Costs money (although typically under $10 a month, or less if you buy in bulk)

What is Tor?

Tor is free software for enabling anonymous communication. The name is an acronym derived from the original software project name The Onion Router. Tor directs Internet traffic through a free, worldwide, volunteer network consisting of more than six thousand relays to conceal a user’s location and usage from anyone conducting network surveillance or traffic analysis. Using Tor makes it more difficult for Internet activity to be traced back to the user: this includes “visits to Web sites, online posts, instant messages, and other communication forms”. Tor’s use is intended to protect the personal privacy of users, as well as their freedom and ability to conduct confidential communication by keeping their Internet activities from being monitored. Ultimate anonymity - blackMORE Ops - 4
Onion routing is implemented by encryption in the application layer of a communication protocol stack, nested like the layers of an onion. Tor encrypts the data, including the destination IP address, multiple times and sends it through a virtual circuit comprising successive, randomly selected Tor relays. Each relay decrypts a layer of encryption to reveal only the next relay in the circuit in order to pass the remaining encrypted data on to it. The final relay decrypts the innermost layer of encryption and sends the original data to its destination without revealing, or even knowing, the source IP address. Because the routing of the communication is partly concealed at every hop in the Tor circuit, this method eliminates any single point at which the communicating peers can be determined through network surveillance that relies upon knowing its source and destination. It is a decentralized system that allows users to connect through a network of relays rather than making a direct connection. The benefit of this method is that your IP address is hidden from the sites you visit by bouncing your connection from server to server at random, in essence, losing the trail.

Tor advantages

  1. No-one can trace you to external IPs visited
  2. Distributed network – almost impossible to shut down or attack in a meaningful way
  3. Free

Tor disadvantages

While your data is encrypted along each of the relay nodes, the final connection point at the last relay in the chain can be compromised if the requested site does not use SSL. Tor has a known drawback of substantially slowing down your browsing because of the numerous hops your data is relayed through. For those concerned with the prying eyes of the government, Tor was created in conjunction with the U.S. Navy and is still used by many government agencies. Because Tor has been widely used by political dissidents, journalists, and even criminals, many governments are watchful of Tor users. This could potentially lead to you being earmarked as a criminal type and having all of your online activity monitored.
  1. Very slow – because your data is randomly bounced through a number of nodes, each of which could be anywhere in the world, using Tor can be painfully slow.
  2. Not suitable for P2P filesharing – while there is no way to stop you from using BitTorrent over Tor (and people do it) it is a) very slow, and b) very bad form as it slows down the entire network for every other user, for some of whom access to the internet via Tor may be of critical and possibly life threatening importance.
  3. While it can, at a pinch, be used for location spoofing, Tor is a very fiddly and inefficient way to go about it. In addition to this, the slowness of Tor means that using the service to stream geo-restricted media services is unfeasible.

Tor and VPN together

Advantages and disadvantages of using Proxy, VPN, TOR and TOR and VPN together - blackMORE Ops - 1The two can be used in conjunction with one another for an added layer of security, however this will dramatically slow down service due to Tor’s method of randomly sending the connection through many servers throughout the world. However, it is imperative to use a VPN so your data is encrypted in that a VPN is used to keep data secure. A VPN provider that does not keep logs is equally important.
The great advantage of Tor is that you do not need to trust anyone – your internet use is completely anonymised. However it is very slow, and largely as a consequence of this, it is not suitable for many of the most popular activities people want to use VPN for, such as filesharing and streaming geo-restricted media content.
As long as a trustworthy no logs VPN provider is used, then VPN is a very secure, consumer oriented privacy solution that provides much greater performance and flexibility than Tor can offer.
It should be noted that with either method users will suffer the combined speed hit of using both services together. There’s two variations of it:

Tor through VPN

In this configuration you connect first to your VPN server, and then to the Tor network, before accessing the internet:
Your computer -> VPN -> Tor -> internet
This is what happens when you use the Tor Browser (less safe) or Whonix (more safe) while connected to a VPN server, and means that your apparent IP on the internet is that of the Tor exit node.

Tor through VPN advantages

  1. Your ISP will not know that you are using Tor (although they will know that you are using VPN)
  2. If your traffic is being monitored by a malicious Tor exit node then it less likely that your VPN provider will keep logs than your ISP. It therefore provides an additional level of privacy, but not anonymity.

Tor through VPN disadvantages

  1. A malicious Tor exit node will still be able to monitor your internet activity and trace it back to your VPN provider. Good VPN providers promise to keep no logs of users’ activities, and use shared IP addresses. If these promises are kept then this will provide a very effective second layer of protection, but it does rely entirely on trusting your VPN provider (as does regular VPN use).
  2. Tor exit nodes are often blocked.
So basically, this configuration hides Tor use from your ISP, and if using a trustworthy logless VPN service can provide a meaningful extra layer of security. Unfortunately there is no way of ever guaranteeing that a VPN provider is 100 per cent trustworthy, and even the best of them can be compelled by a subpoena or court order to start real-time logging of an individual’s actions (although this would require that law enforcement is actively seeking that individual).
Journalist and whistleblowers who are only concerned about law enforcement in their own country, and are not facing an adversary with an international reach, should find this setup very effective if using an overseas VPN provider, but should remember that some governments are not above taking extra-legal measures to obtain the information they want.

VPN through Tor

This involves connecting first to Tor, and then through a VPN server to the internet:
Your computer -> encrypt with VPN -> Tor -> VPN -> internet
This setup requires you to configure your VPN client to work with Tor, and the only VPN providers we know of to support this are the excellent AirVPN and BolehVPN. Your apparent IP on the internet is that of the VPN server.

VPN through Tor advantagesUltimate anonymity - blackMORE Ops - 2

  1. Because you connect to the VPN server through Tor, the VPN provider cannot ‘see’ your real IP address – only that of the Tor exit node. When combined with an anonymous payment method (such as properly mixed Bitcoins) made anonymously over Tor, this means the VPN provider has no way of identifying you, even if it did keep logs.
  2. Protection from malicious Tor exit nodes, as data is encrypted by the VPN client before entering (and exiting) the Tor network (although the data is encrypted, your ISP will be able to see that it is heading towards a Tor node).
  3. Bypasses any blocks on Tor exit nodes.
  4. Allows you to choose server location (great for geo-spoofing).

VPN through Tor disadvantages

  1. None really, apart from the speed hit, and that setup can be a little more complex.
  2. Slightly more vulnerable to global end-to-end timing attack.
  3. To access Tor hidden services you need to run the Tor browser. This introduces yet another layer of obfuscation, but will slow the connection down even further.
As you can see, this is by far the better configuration. With care, you can maintain true anonymity while benefiting from the extra layer of protection afforded by using VPN (with the side-benefit of not suffering from blocked Tor exit nodes.)

Conclusion

In conclusion, a proxy server is completely browser based, and is not as compatible with certain web pages that use non-browser technology. However, a VPN will work with ALL internet based services, but will offer less choice on which applications will get run through your ISP, as with the VPN, everything is routed through that server when connected.
Having all that in mind, if you are a mafia Whistle-blower, or a dissident living under regime in which it would be very dangerous to be caught performing certain activity (such as writing political blogs), then VPN through Tor is the ultimate safest solution as at that point you are almost certainly going via solid encryption and will help you browse the web absolutely anonymously. Yes, Even it means you need to spend a few coins more, the result you get will be stellar and it is worth it!
Just remember that there is no such thing as a 100% guarantee of anonymity, whichever route you take. There are always, at least potentially, loopholes in any security arrangement, and individuals often give their true identifies away through patterns of behaviors such browsing pattern, super cookies, unguarded comments made while on-line, or any other number of simple and not-so-simple mistakes. But as far as I’ve researched, there’s no match for VPN through Tor at this point. I personally use PrivateInternetAccess for VPN service as they are yet to be proven otherwise. Instruction for setting up PIA can be found here.
Do you think otherwise? Let us know via comment section.

How to block an IP address with ufw on Ubuntu Linux server

$
0
0
http://www.cyberciti.biz/faq/how-to-block-an-ip-address-with-ufw-on-ubuntu-linux-server

I am using UFW to manage firewall on my Ubuntu Linux 12.04/14.04 LTS server. I need to block a specific IP address from accessing my server. How do I block an IP address using ufw?

UFW (Uncomplicated Firewall) is a front-end for iptables and is particularly well-suited for a single server or host-based firewalls. It is the default firewall configuration tool for Ubuntu Linux. The UFW developed for a new sysadmin with ease use in mind. It is a user-friendly way to create an IPv4 or IPv6 based firewall to protect the server.

ufw block specific IP address

The syntax is:
sudo ufw deny from {ip-address-here} to any
To block or deny all packets from 192.168.1.5, enter:
sudo ufw deny from 192.168.1.5 to any

Show firewall status including your rules

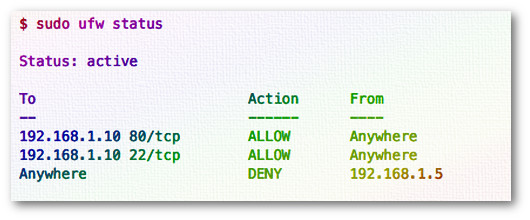
Verify newly added rules, enter:
$ sudo ufw status numbered
OR
$ sudo ufw status
Fig.01: ufw firewall status

ufw block specific IP and port number

The syntax is:
ufw deny from {ip-address-here} to any port {port-number-here}
To block or deny spammers IP address 202.54.1.5 to port 80, enter:
sudo ufw deny from 202.54.1.5 to any port 80
Again verify with the following command:
$ sudo ufw status numbered
Sample outputs:
Status: active
 
To Action From
-- ------ ----
[ 1] 192.168.1.10 80/tcp ALLOW Anywhere
[ 2] 192.168.1.10 22/tcp ALLOW Anywhere
[ 3] Anywhere DENY 192.168.1.5
[ 4] 80 DENY IN 202.54.1.5

ufw deny specific IP, port number, and protocol

The syntax is:
sudo ufw deny proto {tcp|udp} from {ip-address-here} to any port {port-number-here}
For example block hacker IP address 202.54.1.1 to tcp port 22, enter:
$ sudo ufw deny proto tcp from 202.54.1.1 to any port 22
$ sudo ufw status numbered

ufw block subnet

The syntax is same:
$ sudo ufw deny proto tcp from sub/net to any port 22
$ sudo ufw deny proto tcp from 202.54.1.0/24 to any port 22

How do I delete blocked IP address or unblock an IP address again?

The syntax is:
$ sudo ufw status numbered
$ sudo ufw delete NUM

To delete rule number # 4, enter:
$ sudo ufw delete 4
Sample outputs:
Deleting:
deny from 202.54.1.5 to any port 80
Proceed with operation (y|n)? y
Rule deleted

Tip: UFW NOT blocking an IP address

UFW (iptables) rules are applied in order of appearance, and the inspection ends immediately when there is a match. Therefore, for example, if a rule is allowing access to tcp port 22 (say using sudo ufw allow 22), and afterward another Rule is specified blocking an IP address (say using ufw deny proto tcp from 202.54.1.1 to any port 22), the rule to access port 22 is applied and the later rule to block the hacker IP address 202.54.1.1 is not. It is all about the order. To avoid such problem you need to edit the /etc/ufw/before.rules file and add a section to “Block an IP Address” after “# End required lines” section.
$ sudo vi /etc/ufw/before.rules
Find line that read as follows:
# End required lines
Append your rule to block spammers or hackers:
# Block spammers 
-A ufw-before-input -s 178.137.80.191 -j DROP
# Block ip/net (subnet)
-A ufw-before-input -s 202.54.1.0/24-j DROP
Save and close the file. Finally, reload the firewall:
$ sudo ufw reload

Microsoft Azure Series - Creating a Linux virtual machine from template

$
0
0
https://www.howtoforge.com/tutorial/microsoft-azure-series-creating-virtual-machine-from-template

Microsoft Azure Cloud computing is a service made by Microsoft for companies and also end-users who’d like to jump into cloud environment quickly and effectively. Azure offers you many services not only virtual machines. There is also networking services, application services, websites, databases, mobile applications and many more.
How to get in touch which Microsoft Azure? If you are a lucky man, maybe your company offers you an MSDN subscription as a benefit. It comes also with 130Eur / month credit for Azure. The second option is to visit Microsoft Azure trial request page (https://azure.microsoft.com/en-us/pricing/free-trial/) where you are given 170Eur credit. This is far enough for one large virtual machine for a month or 4-5 small machines for the same time. Or you can spend it just for one small testing virtual machine (or other service for much longer time).

Introduction and your first login

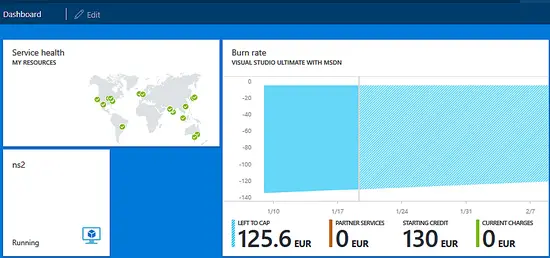
 As Azure portal has nice tutorial itself, there is no need to provide much information here. After your first login, you get redirected to the dashboard where you can see your actual credit, running services and their status. The portal is really well scalable and customizable (similar to metro style in windows).

Azure first login.

Your very first virtual machine

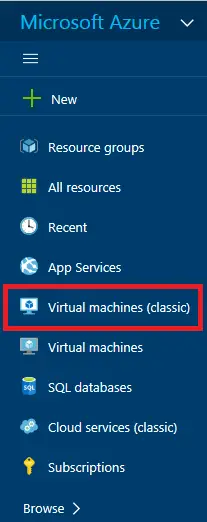
 In time of this tutorial creation (1/19/2016 of intergalactic time), there are two options for virtual machines in Azure portal. As you can see in the picture below, there is Virtual machines (classic) and the non-classic option. After further investigation, the non-classic one is on-premise computing, something we don’t want now. So, let’s click on the Virtual machines (classic) option in our menu.
Add a classic virtual machine.

If you already have any machines (probably not), you can see it listed below in the next “slide”. For creating a new virtual machine, simply click the “+ Add” button in the top menu of the slide. As this slide-style menu in azure portal is pretty annoying, you won’t simply get a list of available images. Therefore you must type the name of the instance you’d like to install. For example, let’s install Ubuntu server now. While you’re typing into the search field, you can see the available instances for your search. There more versions of Ubuntu server, typically the stable one, the latest one and some other instances, even customized like ownCloud preinstalled server based on Ubuntu OS. Let’s choose some of the newest instances, Ubuntu 15.10 for now (version may depend on the time you follow this guide). Now you get a result of your search and you can choose the desired image.
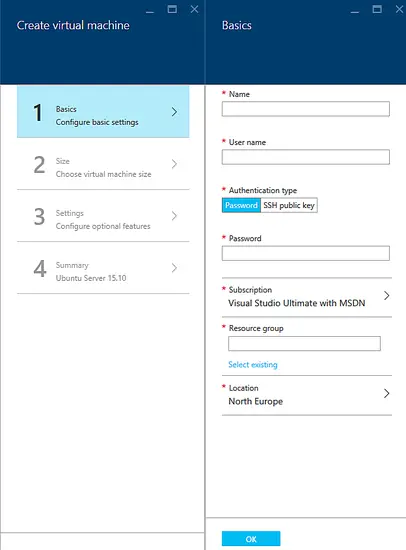
The Basic configuration should show up.

Select the authentication type.

Step 1: Fill in the basic information as Name of the machine (this is not the hostname itself, just a name for you to identify the machine), User name for login, Password or ssh key, Resource group – this is very important as the hostname is going to be the name of resource group and the Microsoft Azure prefix. And the last but not least you can choose the region you wish your machine to be in.
Select the location for the VM instance.

To be honest, the location is somehow based on the registration itself. But I am not sure how. I have available all locations from Brasilia to China, and I have seen people with only Europe region available having the same account preferences as I have.
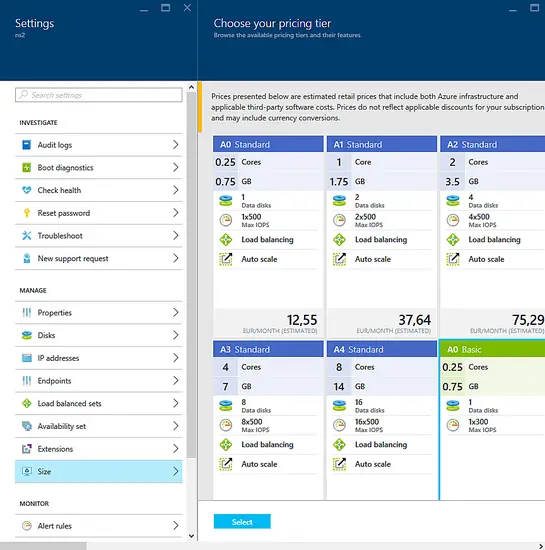
Step 2: The size of your virtual machine. Here you can choose the resources. Notice the Azure offers you recommended virtual machines (probably based on users’ choice). You can always click on “View all” for all available options. Each virtual machine has different parameters, number of cores, memory size, how many physical disks are below your virtual disk, what’s the IOPS limit, SSD size of drive and so on.
The basic difference between basic and standard machines lays in your needs. The basic one is simply the basic. It has almost no additional futures, you can’t scale it or request load balancing. This is the best option for testing. On the other side, if you plan to use the machine in productive environment, use the Standard one for better support and reliability. Each machines has its cost on the bottom. Don’t forget the Azure charges you for all outgoing traffic and IOPS (those charges are really not high, typically few cents or euros per month).
Step 3: Configure optional futures (or future options). This is something like advanced settings. The nice new feature is choosing between classic HDD and SSD drive. However, you can use the SSD drive only with Standard virtual machines. Network options a little different here in Azure. As all the machines don’t have public IP, you get just one for your virtual/cloud service. The easiest way to understand it is imagine it as a router. The cloud service is a NAT service which holds your public IP and DNS. All your machines are assigned private IPs. Don’t worry, you can of course redirect all your needed ports where needed. The last option is monitoring, which I find not useful for us now. Monitoring keeps an eye on your machine and there is even an option of auto scale later.
Step4: Summary. Once again, you can review all your settings here. You may now ask what about the hard drive? There is just simple answer. The size of your drive is static and you can’t modify it now. Every image has its own primary disk size. However, you can later add more drivers to your machine and work with them.
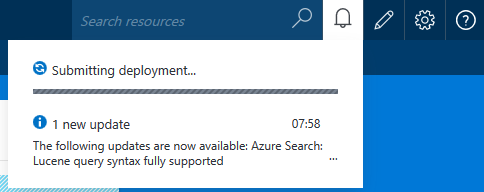
When you are ready to hit the “ok” button, your machine starts to provision. This may take a few minutes and you can check the progress in the notification area.
Select a pricing tier.

Once the machine is up and running, you can login to it, change the port redirections (aka Endpoints) and set many other features. One nice feature is changing the size of your machine. Even if it’s Basic one, you can stick to Standard or other Basic whenever you want.

Submit Deployment.

Summary

This tutorial guides you through the basic setup of predefined images by Microsoft. If you plan using the Azure in much more productive way, come to see the next guide “Microsoft Azure Series - Creating virtual machine from custom image” where you can find the way to create an image from your existing machine and using it again to deploy a new one whenever you want.

GPG: a Fedora primer

$
0
0
https://fedoramagazine.org/gnupg-a-fedora-primer

GPG, or GnuPG, refers to the Gnu Privacy Guard utility. GPG is a freely available implementation of the OpenPGP standard that was released by Werner Koch in 1999. The security and privacy of data and individuals is an important topic in modern culture. The OpenPGP standard allows GPG and other applications to work together to secure and protect your data.
This series will explain the basic fundamentals of GPG and take you step by step through using it. The OpenPGP standard includes the basic features of confidentiality, integrity, and non-repudiation. By supporting this standard, GPG provides all three features.

Confidentiality

Confidentiality is the ability to keep contents of a file or message private. To provide confidentiality, GPG can convert the original contents of a file, called plaintext, to an encrypted version called ciphertext. This can help keep your files secure on a computer, removable drives, or when transmitted over the Internet. Think of it as using a secret code to write a letter. Even if the letter is intercepted and the envelope steamed open, the message cannot be read.
The example plaintext below is encrypted with the pass phrase “openme”. This is an example of a symmetric algorithm, where the same key is used for both encryption and decryption.
Plain text:
the quick brown fox
Encrypted text:
jA0EBwMCqQso2Gtwdw9g0k0B+60qwezrj/6rR3KXt/ckSHtqr0jt2feIKKRV+Qwt
HnsVUOu51Amd9pE1xR0WE75GQjWfwEN9P34Z1HkP0pVyDOGKme06AJDL6W8uRA==
=/Yrs

A future article in this series will cover email encryption with GPG.

Integrity

Another function of GPG ensures the integrity of a file. This feature is used by the Fedora Project to help ensure the image you download is the one Fedora provides. In the case of Fedora, both a checksum and a signature are generated.
A checksum is a set of digits that represent data, such as a file. The checksum is generated by a special one-way mathematical algorithm. The algorithm cannot be reversed to discover the original data from the checksum. The algorithm is also designed to make it exceedingly difficult for two sets of data to generate the same checksum.
You will see this on the page that thanks you for downloading Fedora:
GnuPG Fedora Download
The text below is from the page you see when you click the Validate button on the page above. To verify this information and the image itself, follow the link for the instructions.
-----BEGIN PGP SIGNED MESSAGE-----
Hash: SHA256

# The image checksum(s) are generated with sha256sum.
SHA256 (Fedora-Workstation-netinst-x86_64-23.iso) = f38d1aca6211b6bbb2873a550f393d03866294e3e5094256feb4cd647c25a310
SHA256 (Fedora-Live-Workstation-x86_64-23-10.iso) = a91eca2492ac84909953ef27040f9b61d8525f7ec5e89f6430319f49f9f823fe
-----BEGIN PGP SIGNATURE-----
Version: GnuPG v1

iQIcBAEBCAAGBQJWM9N7AAoJEDJHTPg07Jy6vLQP/2m9NYWcPo8cIZDw7fq+u5LC
g50R+8TQlY76LMzv0NAuIsx6pw3JW/BZSRVd74Jlg+cPK6te9XVmJ2HS9WoSWvPw
T821eRRbV8ou3JthST/ZPbcdy1L3Qz6Xbfu1u7LwE4yjgh+8fQJ7ZKANpchEuOhk
j9JK45vwbgUj9gWSQghoe+2dXOtTmtJAnPjTirYmeB0JJubwjEgT+O9y+EaUXABs
oKTUH2ej6qsLSWjbjcH3bxjaQwvzZKEN3KgKyFIBpIdeCVMp/JiLqHwQ8Fqtwsu9
j2sv7oB+arE/RjOprgC6TDgbx753zoFmHo0maiCMCCFfSDsea8pHay3n7u/Exr/8
8XE9UFXRMnFPFmdY21uE8SIilnE/Ig3BAqCIo2qN/8gx6bEAIaC10B+h7gtS2D46
J5982pneqyw88MCLUIN27kx59vTr9N6DNPomz5VEgf2J7rmfE3ZbrIS45r2zJPjt
sbr6mjmJrx+sPWx5Ie0pgkjMbgQeZ8yN4GegyJwwhjRIoYZl3W7QyAaYJbKRfFPP
hn+oOoe3RB8Jhhoma29MezDesL9t8wafmPelp5sNU02ORvuhvwcpKdmPyku0VzI+
PuYzDB19DCNjHV3UKMQ2BlR6m1AevCtra/WDqeXliwFWGT//iQjIBMwB4o2byxFe
R3cfguVlycgsPAIPKhKW
=Jvm2
-----END PGP SIGNATURE-----
The signature also provides integrity checking for the checksums. If the checksum values were to change, the signature would no longer match. After verifying the signature, the hash values can be used to compare to a checksum on the downloaded image file. If they are the same, you can be certain the image is not tampered with or corrupted.

Non-repudiation

Non-repudiation ensures that a person cannot deny signing a file or message. If you always sign your messages, someone receiving an unsigned message should suspect it is a fake. The non-repudiation process requires a more complex cryptographic system than the symmetric example shown earlier. Asymmetric or public-key cryptography makes this feature possible.
In a public-key system, each user has a public key, which they share as widely as possible; and a private key, which they protect as carefully as possible. Keyservers on the internet can collect and advertise public keys to make exchange of information easier.
To know if a signature is valid requires use of a keyserver to retrieve the public key for that signature. However, downloading or having a public key labeled as owned by someone does not prove the key actually belongs to that person.
For this reason, keys must be verified personally to be trusted. If you meet someone in person and verify their identity, you can trust their key. This “web of trust,” which will be discussed later in the series, allows you to trust a key from a person you haven’t personally met.

Authenticity

When confidentiality, integrity and non-repudiation are combined, authenticity is achieved. A file or message can be kept secret, verified to not have been tampered with, and verified to come from the specified source.
This is the beginning of a series of articles about using GPG. This series will show you how to create and maintain keys with GPG, understand and use the web of trust, understand and run key signing events, use GPG with email, and encrypt and sign files.

3 Emerging Open Source Data Analytics Tools Beyond Apache Spark

$
0
0
https://www.linux.com/news/3-emerging-open-source-data-analytics-tools-beyond-apache-spark

Projects

These data analytics projects are on the rise: Apache Grappa, Apache Drill, and Apache Kafka.
On the data analytics front, profound change is in the air, and open source tools are leading many of the changes. Sure, you are probably familiar with some of the open source stars in this space, such as Hadoop and Apache Spark, but there is now a strong need for new tools that can holistically round out the data analytics ecosystem. Notably, many of these tools are customized to process streaming data.
The Internet of Things (IoT), which is giving rise to sensors and other devices that produce continuous streams of data, is just one of the big trends driving the need for new analytics tools. Streaming data analytics are needed for improved drug discovery, and NASA and the SETI Institute are even collaborating to analyze terabytes of complex, streaming deep space radio signals.
While Apache Spark grabs many of the headlines in the data analytics space, given billions of development dollars thrown at it by IBM and other companies, several unsung open source projects are also on the rise. Here are three emerging data analytics tools worth exploring:

Grappa

Big organizations and small ones are working on new ways to cull meaningful insights from streaming data, and many of them are working with data generated on clusters and, increasingly, on commodity hardware. That puts a premium on affordable data-centric approaches that can improve on the performance and functionality of tools such as MapReduce and even Spark. Enter the open source Grappa project, which scales data-intensive applications on commodity clusters and offers a new type of abstraction that can beat classic distributed shared memory (DSM) systems.
You can get the source code for Grappa and find more about it here. Grappa began when a group of engineers with experience running Big Data jobs on Cray systems wondered if they could challenge the analytics that Cray systems were capable of on off-the-shelf commodity hardware.
As the developers note: “Grappa provides abstraction at a level high enough to subsume many performance optimizations common to data-intensive platforms. However, its relatively low-level interface provides a convenient abstraction for building data-intensive frameworks on top of. Prototype implementations of (simplified) MapReduce, GraphLab, and a relational query engine have been built on Grappa that out-perform the original systems.”
Grappa is freely available on GitHub under a BSD license. If you are interested in seeing Grappa at work, you can follow easy quick-start directions in the application’s README file to build and run it on a cluster. To learn how to write your own Grappa applications, check out the tutorial.

Apache Drill

The Apache Drill project is making such a difference in the Big Data space that companies such as MapR have even wrapped it into their Hadoop distributions. It is a Top-Level project at Apache and is being leveraged along with Apache Spark in many streaming data scenarios.
For example, at the New York Apache Drill meeting back in January of this year, MapR system engineers showed how Apache Spark and Drill could be used in tandem in a use case involving packet capture and near-real-time query and search.
Drill is notable in streaming data applications because it is a distributed, schema-free SQL engine. DevOps and IT staff can use Drill to interactively explore data in Hadoop and other NoSQL databases, such as HBase and MongoDB. There is no need to explicitly define and maintain schemas, as Drill can automatically leverage the structure that's embedded in the data. It is able to stream data in memory between operators, and minimizes the use of disks unless needed to complete a query.

Apache Kafka

The Apache Kafka project has emerged as a star for real-time data tracking capabilities. It provides unified, high-throughput, low-latency processing for real-time data. Confluent and other organizations have also produced custom tools for using Kafka with data streams.
Apache Kafka was originally developed by LinkedIn, and was subsequently open sourced in early 2011. It is a hardened, tested tool and many organizations require workers with Kafka knowledge. Cisco, Netflix, PayPal, Uber, and Spotify are among well-known companies using Kafka.
The engineers who created Kafka at LinkedIn also created Confluent, which focuses on Kafka. Confluent University offers training courses for Kafka developers, and for operators/administrators. Both onsite and public courses are available.
Are you interested in more unsung open source data analytics projects on the rise? If so, you can find more in my recent post on the topic.

Gathering insights from data: An overview of the Elastic stack

$
0
0
https://opensource.com/life/16/6/overview-elastic-stack

Gathering insights from data: An overview of the Elastic stack
Image credits : 
Tony Smith via Flickr (CC BY 2.0)
The Elastic stack is a versatile collection of open source software tools that make gathering insights from data easier. Formerly referred to as the ELK stack (in reference to ElasticsearchLogstash, and Kibana), the growing list of tools that integrate with the platform (such as Beats) have outgrown the acronym but provide ever-growing capability for users and developers alike.
At the upcoming Southeast Linuxfest 2016, I'll be covering some of the steps to get started using each of these parts of the stack. In this article, we'll look at each in turn to summarize the capabilities, requirements, and interesting use cases that apply to each.

Beats & Logstash

Collecting data is where it all starts. Logstash and Beats both serve this need, though each is finely tuned to suit different needs and uses. Whether your priority is light resource usage or extensive features, either solution has been designed to meet those requirements.

Beats

Beats are lightweight, fast data shippers and collectors that typically do one thing and do it well. For example, Packetbeat collects and ships data about packet activity on a network interface, while Filebeat can tail a log file and send logs to be processed downstream. Beats are designed to be fast, portable, and easy to deploy on individual hosts for specific needs. There are even community-created Beats for uses like monitoring HTTP endpoints and NGINX health.
Written in Go and based upon the shared foundation of libbeat, Beats are meant to be easily implemented so that even resource-constrained environments can be measured easily and without much overhead.

Logstash

Logstash is similarly capable of collecting machine data, but where it shines is the plethora of open source plugins available to enrich data. For example, while collecting webserver logs is useful, deeply parsing the user-agent data to extract traffic statistics can be beneficial, which the useragent filter can do. Or, if using the Twitter plugin, you may want to perform sentiment analysis on user tweets.
Custom plugins are simple Ruby libraries, which enable users to extend functionality and prototype new features quickly. Performance isn't an afterthought, however: Logstash ships with JRuby by default, which opens up possibilities for concurrency and real threads.

Elasticsearch

Once data has been collected and enriched, storing it in Elasticsearch opens up a range of possibilities.
Elasticsearch is a search engine at its heart, with a myrid of use cases borne of its flexibility and ease of use. Based on Apache Lucene, Elasticsearch strives to make both the operational challenges (such as scalability and reliability) and application-based needs (like freetext search and autocomplete) easier for end users.
Operationally, Elasticsearch's elasticity stems from splitting indices into shards, which can be spread across multiple hosts to balance load and boost performance. With planning, this means that datasets can grow well beyond the capabilities of one machine to handle.
Some examples of the analytics that can be performed on Elasticsearch include:
  • Geo searching. When documents are inserted with geo metadata, results can be overlaid on a map to visualize how documents relate to real-world longitudes and latitudes.
  • Graphing. Recent plugins have added graph search to Elasticsearch, which can answer interesting questions such as relationships between data in the Panama Papers.
  • Aggregations. Answering questions such as which pages returned the most 500 errors become a matter of forming the right query for the fields in a log file.
While all these capabilities are driven by Elasticsearch's core, exposing them in a user-friendly interface is left to the next layer in the stack.

Kibana

Kibana is a browser-based visualization frontend for Elasticsearch. It enables users to easily consume data in aggregate that would otherwise be difficult to process; making logs, metrics, and unstructured data searchable and more usable for humans. Additional plugins can be used for specialized cases, such as Timelion for timeseries data.
Because Kibana persists most of its data within Elasticsearch, managing Kibana dashboards and visualizations is a similar exercise as managing other indices in Elasticsearch. Charts, graphs, and other visualizations sit atop Elasticsearch APIs which can be easily inspected for closer analysis or use in other systems.

An open ecosystem

Like other multi-faceted systems, the Elastic stack is supported by tools to help manage deployment and configuration, such as with AnsiblePuppet, and Chef. Standard distribution repositories are similarly available.
It's worth noting that all of these open source projects are spread across a wide array of languages. While Beats are written in Go for portable, efficient distribution of compiled binaries, Kibana uses Javascript for unified development of frontend and backend components. With many languages and an open codebase, users should feel free to get involved with the feature development and bugfixing efforts that matter to them.
Now is a great time to play with the stack and see what you can accomplish with it, with a wide variety of solutions and global community standing by to support users and developers alike.

How to effectively clear your bash history

$
0
0
http://www.techrepublic.com/article/how-to-effectively-clear-your-bash-history

If you're serious about security on your Linux machines, you might want to clear the bash history. Learn how to do this more effectively than with just a single command.


Image: Jack Wallen
On your Linux machines, a history of your bash commands is retained. This is great when you need to repeat a command or can't remember exactly how you executed a command in a previous session. However, this can also be seen as a security issue. What if someone gains access to your machine, opens a terminal window, and checks through your bash history to see what commands you've run?
Bash has a handy way to clear the history: issue the command history -c. There's a slight problem with that approach. Let me explain.

First off, your bash history is retained in the file ~/.bash_history. When you have a terminal open, and you issue a command, it writes the command to the history file. So issuing history -c will clear the history from that file. The problem comes about when you have multiple terminal windows open. Say you have two terminal windows open and you issue history -c from the first one and close that window. You then move to the second terminal window, and you type the exit command to close that window. Because you had a second bash window open, even after running the history -c command in the first, that history will be retained. In other words, the history -c command only works when it is issued from the last remaining terminal window.
How do you get around that? You empty the .bash_history file either on a per-instance basis or by using a crontab job to do it regularly. If security is a serious matter for you, consider setting up the crontab job. Here's how.
SEE:Linux Foundation launches badge program to boost open source security (ZDNet)

Clearing bash history on a regular basis

Before I show how to set up the crontab job for this, know that the ~/.bash_history file can be cleared with the command:
cat /dev/null > ~/.bash_history
That will empty out the contents of the file, but keep the file in place.
Let's say you want to clear the .bash_history file for user olivia (who administers your Linux server) at 11:00 p.m. every day. You would create a cron job under the olivia account. To do that, log in as the user olivia, open a terminal window, and issue the command crontab -e. When the crontab editor opens, enter the following:
00 23 * * * cat /dev/null > ~/.bash_history
Save that file and cron will start clearing out olivia's history at 11:00 p.m. every day.

A surefire method

This is a surefire method of clearing out your bash history. Don't always rely on the history -c command, because you never know when a second (or a third) terminal is still open, ready to keep that history retained.

How To Install Btrfs Tools And Manage BTRFS Operations

$
0
0
http://linuxpitstop.com/install-btrfs-tools-on-ubuntu-linux-to-manage-btrfs-operations


Hello everybody, today we are going to show you installation of Btrfs tools and its Operation. Btrfs is a new copy on write (CoW) filesystem for Linux aimed at implementing advanced features while focusing on fault tolerance, repair and easy administration. Jointly developed at multiple companies, Btrfs is licensed under the GPL and open for contribution from anyone. Considering the rapid development of Btrfs at the moment, Btrfs is currently considered experimental. But according to the wiki maintained by the btrfs community, many of the current developers and testers of Btrfs run it as their primary file system with very few “unrecoverable” problems. Thus, Linux distributions tend to ship with Btrfs as an option but not as the default. Btrfs is not a successor to the default Ext4 file system used in most Linux distributions, but it can be expected to replace Ext4 in the future.
Now we will be going to install the latest version of brtfs-tools on Ubuntu Linux based server.

Prerequisites

Before installing the Btrfs on your linux system, make sure that you are using the latest version of kernel as it has been included in the mainline kernel. After that you are required to install some packages that are are necessary and helps in the installation of Btrfs tools.
Let’s run the below command to install build tools on your Linux system.
# apt-get install git install asciidoc xmlto --no-install-recommends
installing build tools
Now run the command below to install some more libraries for your system and press ‘y’ to continue.
# apt-get install uuid-dev libattr1-dev zlib1g-dev libacl1-dev e2fslibs-dev libblkid-dev liblzo2-dev
required btrfs libs

Downloading Brtfs-tools

To download the latest stable version of brtfs-tools run the the following git command in your command line terminal.
# git clone git://git.kernel.org/pub/scm/linux/kernel/git/kdave/btrfs-progs.git
download btrfs-toosl

Build Btrf-tools

Run the following command for preparing your btrf-tools to build for compilation after changing directory to the downloaded package as shown.
# cd btrfs-progs/
# ./autogen.sh
After generating the build you will be asked to type ‘./configure’ and ‘make’ to compile. Just flow the below commands one by one.
# ./configure
make
compiling btrfs-tools

Installing Btrfs-Tools

Once the btrfs-tools compilation process completes, we can install it by using ‘make install’ command as shown below.
# make install
After installation, run below command to verify the installed version of btrfs-tools on your system.
# btrfs version
Installing btrfs-tools

Managing Btrfs Operations

BTRFS aims to provide a modern answer for making storage more flexible and efficient. Now we are going to show you some of the useful operations of Btrfs. It stores data in chunks across all of the block devices on the system. The total storage across these devices is shown in the standard output of df -h.
Raw data and filesystem metadata are stored in one or many chunks, typically 1 GiB in size. When RAID is configured, these chunks are replicated instead of individual files.

Btrfs Filesystem creation

‘mkfs.btrfs’ can accept more than one device on the command line using different options to control the raid configuration for data (-d) and metadata (-m). Once you have added another disk to your system and you wish to mount it using btrfs, then run below command to create its system.
# mkfs.btrfs /dev/sdb
creating btrfs
Once you have create a filesystem, you can mount your new btrfs device using below command.
# mount /dev/sdb /mnt

Btrfs Device scanning

btrfs device scan is used to scan all of the block devices under /dev and probe for Btrfs volumes. This is required after loading the btrfs module if you’re running with more than one device in a filesystem.
Let’s run below command to scan all devices.
#btrfs device scan
To scan a single device use below command.
#btrfs device scan /dev/sdb
You can use below command to print information about all of the btrfs filesystems on the machine.
# btrfs filesystem show

Adding New devices

New physical disks can be added to an existing btrfs filesystem. The first step is to have the new block device mounted on the machine like have already done this. Afterwards, let btrfs know about the new device and re-balance the file system. The key step here is re-balancing, which will move the data and metadata across both block devices.
So, first run below command to add new devices to a mounted filesystem.
#btrfs device add /dev/sdb /mnt
Then use below command to balance (restripe) the allocated extents across all of the existing devices. For example, with an existing filesystem mounted at /mnt, you can add the device /dev/sdb to it.
# btrfs filesystem balance /mnt
new device
Run the following command that prints very useful information that you can use to debug and check how the BTRFS volume has been created.
# btrfs filesystem df /mnt
Data, single: total=1.00GiB, used=320.00KiB
System, DUP: total=32.00MiB, used=16.00KiB
Metadata, DUP: total=128.00MiB, used=112.00KiB
GlobalReserve, single: total=16.00MiB, used=0.00B
Adding in /etc/fstab
If you don’t have an initrd, or your initrd doesn’t perform a btrfs device scan, you can still mount your volume btrfs filesystem by passing your devices in the filesystem explicitly to the mount command by adding below entry in your ‘/etc/fstab’ file.
# vim /etc/fstab
/dev/sdb /mnt btrfs 0 0
A common practice in system administration is to leave some head space, instead of using the whole capacity of a storage pool (just in case). With btrfs one can easily shrink and expand the volumes.
Let’s shrink the volume a bit (about 25%) using below command.
# btrfs filesystem resize -1g /mnt
To grow the volume run below command.
# btrfs filesystem resize +150m /mnt
This is the opposite operation, you can make a BTRFS grow to reach a particular size (e.g. 150 more megabytes) as in above command. You can also take an “all you can eat” approach via the max option, meaning all of the possible space will be used for the volume with below command.
 #btrfs filesystem resize max /mnt

Removing devices

Use below command to remove devices online. It redistributes the any extents in use on the device being removed to the other devices in the filesystem.
#btrfs device delete /dev/sdb /mnt

Conclusion

Btrfs is intended to address the lack of pooling, snapshots, checksums, and integral multi-device spanning in Linux file systems. These features are being crucial as the use of Linux scales upward into larger storage configurations. Btrfs is designed to be a multipurpose filesystem, scaling well on very large block devices. There are alot of its other operational usages that you can use. So, don’t wait and let’s get started with btrfs and I hope you find this quite better than other Linux file systems.
If you enjoy our article(s) , please like/follow and share our social network pages so we may keep running this non profit venture.

Make Peace With The Linux Process Table

$
0
0
http://linux-server-security.com/linux_servers_howtos/linux_process_table.html

A fundamental design feature of Unix-like Operating Systems is that many of a system’s resources are accessible via the filesystem, as a file. For example the “procfs” pseudo-filesystem offers us access to all kinds of valuable treasures.
By querying files present in “/proc” you can quickly find out the intricacies of your network connections, the server’s CPU vendor and look up a mountain of useful information such as the command line parameters passed to your latest-and-greatest application when it fired up. This is thanks to the fact that many of the functions of a server, such as a network connection are really just another stream of data and in most cases can be presented as a file on your filesystem.
Let’s jump ahead of ourselves for a moment in case you’re not too familiar with the “/proc” filesystem. If you knew that your Process ID was “16651” for example then you could run this command in order to find out what was sent to the Puppet process to start it up:
# xargs -0 < /proc/16551/cmdline
The output from that command is:
/usr/bin/ruby /usr/bin/puppet agent
As you can see Puppet’s agent is using the Ruby programming language in this case and the binary “/usr/bin/puppet” is passed the parameter “agent” to run it as an “agent” and not a “master”.
The “Everything Is A File” philosophy makes total sense if you think about it. The power harnessed within Unix’s standard tools (usually used for manipulating data held in the more common text files) such as “grep”, “awk” and “sed” are a major strength of the Operating System. But most importantly you can have a system’s components integrate very efficiently and easily if many things are simply files.
If you have you ever tried to look into a process running on a Unix-like machine then you’ll know that if anything the abundance of information adds confusion, rather than assists, if you don’t know where to look. There are all sorts of things to consider when you are eagerly trying to track down a rogue process on production machine.
In this chapter I will attempt to offer a broad insight into how the Process Table can be accessed by the ps command and in combination with “/proc” and “/dev” how it can help you manipulate your systems.

   Legacy


There are a few legacy stumbling blocks when it comes to looking up a process on different types of Unix boxes but thankfully we can rely on the trusty "ps" command to mitigate some of these headaches automatically for us.
For example, Unix used the "ps" command by grouping its parameters together and prepending a hyphen. Whereas BSD enjoyed grouping switches together but, for one reason or another, fell out with the hyphen entirely.
Throwing another spanner in the works however was good, old GNU's preference; where its long options used two dashes. Now that you've fully committed those confusing differences to memory let's assume that the ps command does as much as it can for us by mixing and matching the aforementioned options in an attempt to keep everyone happy.
Be warned that occasionally sometimes oddities can occur so keep an eye out for them just in case. I’ll try and offer alternative commands as we continue to act as a reminder that not all is to be taken exactly as read. For example a very common use of the ps command is:
# ps -aux
It should be noted however that this is indeed different to:
# ps aux
You might suspect, and would be forgiven for thinking as much, that this is purely to keep everyone on their toes. However according to the ps command’s manual this is apparently because POSIX and UNIX insist that they should cater for processes owned by a user called "x". However, if I’m reading the information correctly, then should the user "x" not exist then "ps aux" is run. I love the last sentence of the manual’s definition and draw your attention to it as a gentle warning: “It is fragile, subject to change, and thus should not be relied upon.”

   Process Tree


Enough eye-strain for a moment and let’s begin by looking at the ps command and what it is capable of helping with in relation to querying the Process Table.
For starters (and I won’t be betting the ranch on this statement) it's relatively safe to assume that upper and lower case mean the same thing.
If you’ve never seen the output of a Process Tree then it might help with understanding “child” threads which live under a “parent” process. In this case the command is simply:
# pstree
The not-so-impossible-to-decipher output from that command is shown in Listing One (on a server not running “systemd but good, old “init” (which is always Process ID (PID) number one, as an aside):
init-+-auditd---{auditd}
     |-certmonger
     |-crond
     |-dbus-daemon---{dbus-daemon}
     |-hald---hald-runner-+-hald-addon-acpi
     |                    `-hald-addon-inpu
     |-apache2---8*[apache2]
     |-master-+-pickup
     |        `-qmgr
     |-6*[mingetty]
     |-oddjobd
     |-rpcbind
     |-rsyslogd---3*[{rsyslogd}]
     |-sshd---sshd---sshd---bash---pstree
     |-udevd---2*[udevd]
Listing One: Output from the “pstree” command showing parent processes and their children
You can make your screen output much messier by adding the “-a” switch. Doing so will add command line arguments (pulled from the /proc filesystem in the same way that our example did earlier). This is very useful but you might want to do something like “grep” a specific process name from the output, as follows:
# pstree -ap | grep ssh
|-sshd,29076
  |   `-sshd,32365
  |       `-sshd,32370
  |               |-grep,8401 ssh
  |   |-sssd_ssh,1143 --debug-to-files
Listing Two: The command “pstree” showing only SSH processes with command line arguments and PIDs
As we can see from Listing Two, the command which we are querying with is also shown (starting with “grep”) in the output so try not to let that trip you up on your travels. I’ve added the “-p” switch to display the PIDs too for ease.
One final look at that example is seen in Listing Three. Here the all-pervasive “-Z” switch offers us any SELinux config associated with the parent and child detail displayed in our process table tree. That command for reference was:
# pstree -aZp | grep ssh
|-sshd,29076,`unconfined_u:system_r:sshd_t:s0-s0:c0.c1023'
  |   `-sshd,32365,`unconfined_u:system_r:sshd_t:s0-s0:c0.c1023'
  |       `-sshd,32370,`unconfined_u:unconfined_r:unconfined_t:s0-s0:c0.c1023'
  |               |-grep,8406,`unconfined_u:unconfined_r:unconfined_t:s0-s0:c0.c1023' ssh
  |   |-sssd_ssh,1143,`system_u:system_r:sssd_t:s0' --debug-to-files
Listing Three: The output now includes SELinux detail, command line arguments and PIDs

   Alternative View


Back to school for a moment and we’ll pick up some of the basics that will help us increase our knowledge later. We will (very loosely) mimic the Process Tree output we saw earlier with just the ps command now. You might stumble across “forest” puns in manuals with regards to “trees” in case it’s confusing.
The “-e” switch is also equal to “-A” and it will dutifully display ALL of the processes. We’re going to combine that with “-j” which should give us a “jobs format”. I’m sorry to potentially give you more headaches and I encourage to try a few of these of alternative options but one small caveat would be that running “j” and “-j” gives different levels of information. The non-hyphenated version giving more output in this case.
We will also add the “-H” to display the hierarchical output and we can achieve this by running:
# ps -ejH
Or, in a parallel universe, alternatively you can also use for vaguely similar results:
# ps axjf
Try it yourself. It’s far from identical to the “pstree” command but there are similarities in the output due to the hierarchies I’m sure that you will agree.

   Day-To-Day


It is easy to get overwhelmed by the level of detail that the ps command can provide. My favourite process command is:
# ps -ef
With “-e” this gives us a display of all the processes in the Process Table and the newly added “-f” switch gives us what’s known as full-format listing. Apparently we can add “-L” to this concoction in order to offer us process thread information. I find this command very easy to remember around Christmas time.
# ps -eLf
Et voilà, as requested two new columns NLWP (number of threads) and LWP (thread ID) are now added to the now busying display.
If you only wanted to print the name of a process (which might be ideal for scripting) then you can sort the wheat from the chaff by using this command for process number "37":
# ps -p 37 -o comm=
An option that I've used in the past a few times is checking what command my terminal is currently
responsible for. This is useful if you're stressing your server or worrying your workstation with lots of extra load. The simple (non-hyphenated) "T" switch lets us view this.
# ps T
You can test this by running something unusual, like a “for” loop with a pause in it using“sleep”, or anything odd that stands out such as this command.
# echo {1..999999} &
This simply runs a counter process in the background and when we run “ps T” we can see processes associated with the terminal in question.

   Built-In Features


Let’s look at a few other built-in basics of the pliable ps command.
You can reverse the output of a command with a non-hyphenated “N” switch, which stands for negate. Or more precisely from the manual “Select all processes except those that fulfill the specified conditions. (negates the selection) Identical to --deselect.” All is revealed in Listing Four. As we can see, there isn’t any mention of “ntp” except from our ps command.
# ps N ntp
 PID TTY   STAT   TIME COMMAND
 1414 tty1     Ss+    0:00 /sbin/mingetty /dev/tty1
 1416 tty2     Ss+    0:00 /sbin/mingetty /dev/tty2
 1418 tty3     Ss+    0:00 /sbin/mingetty /dev/tty3
 1420 tty4     Ss+    0:00 /sbin/mingetty /dev/tty4
 1426 tty5     Ss+    0:00 /sbin/mingetty /dev/tty5
 1430 tty6     Ss+    0:00 /sbin/mingetty /dev/tty6
 9896 pts/1    S       0:00 sudo -i
 9899 pts/1    S       0:00 -bash
10040 pts/1   R+     0:00 ps N ntp
Listing Four: Demonstrates running processes without including “ntp” (note our “ps” command again being seen)
Imagine that you again wanted to see what SSH activity was going on and also the Hardware Abstraction Layer daemon, “hald”. Hardly related I agree but you can never account for strange scenarios when it comes to computers.
The command which follows is a way of searching for a list of processes with a certain name. Separated without a space and just a comma in this case.
# ps -C sshd,hald
If you need to check any processes run by a particular system group you can achieve this with the
following command:
# ps -G ntp

   Compatability


Although not always the case the modern ps command cleverly mitigates our migraine-inducing compatibility headaches by letting us run a simple command in a number of ways where possible.
If you wanted to select a list of processes which belonged to the superuser, "root", then you can achieve this with the following three commands (which admittedly display ever-so-slightly different outputs):
# ps -u root
# ps U root
# ps --user root
The above commands dutifully offer us what's known as the "EUID" or “effective ID” of a user but
not the "real user ID". In reality, no pun intended, every process actually has two user IDs; just to keep things simple. This also applies to groups too but let's not worry about that.
Apparently the kernel is most concerned with the "effective user ID" for activities such as writing to a file and if a user is allowed to complete a request to do something that requires a privilege.
And, although that’s required for much of the time, there's an important scenario within which the "real user ID" needs to be paid attention to. If someone or something wants to alter the owner of "effective user ID" on an already running process then the kernel needs to check up on both the "real user ID" and the "effective user ID".
Changing the ownership of a process is particularly useful if a new user wants to do essentially the same thing (like write to a file) as the existing owner does. Rather than duplicating the process (adding extra strain to the system and potentially introducing more security aspects to consider) we can avoid duplicating the process and simply reassign it.
What about after a user is finished with their short task? The answer is that we only temporarily give access and then swap it back again to its original owner. If you want to reveal the somewhat elusive "real user IDs" then you can do so with system groups like this (which is the same as "-G"):
# ps --Group ntp
And, not surprisingly, we can do exactly the same thing for users as follows (we do this with "-U"):
# ps --User chrisbinnie
If you want to query a very specific Process ID (because you've spotted it in "top" or a script
has complained about it) then to all intents and purposes these commands all the do the same. I have included some output for comparison as it’s short and easy to read in this case:
# ps -p 1248
PID TTY   TIME      CMD
 1248 ?      00:00:08 ntpd
# ps p 1248
PID TTY STAT TIME COMMAND
 1248 ?      Ss    0:08   ntpd -u ntp:ntp -p /var/run/ntpd.pid -g
# ps --pid 1248
PID TTY    TIME      CMD
 1248 ?      00:00:08 ntpd
If you’ve ever wondered about the efficiencies of a system, here’s something interesting. The kernel has to be able to tidy up when a user logs out (otherwise there would be a plethora of useless processes clogging up the pipes) so Unix-like systems dutifully groups processes into “sessions”. You can test for session IDs by using "--sid" or as below with “-s”:
# ps -s 1526
If it’s of interest a session can have an associated terminal (of "tty" or "Teletype" varieties) controlling it however only one process can be at running in the foreground. All these components are given numbers to keep the system nice and orderly. A a result we have thread IDs, process IDs, process group IDs and session IDs. Here was you thinking that the ps command didn't have much to do.
If you’re interested in reading a little more about sessions this book’s excerpt is intriguing with sentences such as “Consequently, sessions are largely the business of shells. In fact, nothing else really cares about them.”:

   Children


Now picture the scene where we want to check for the parents of a process (we'll look at this in more detail in a second). You can achieve this by using this command:
# ps --ppid 21201
This shows us the processes with a parent process of that ID. In other words we can pinpoint processes that are children of process "21201"in this case.
Having said earlier that usually case-sensitivity shouldn't cause too many headaches I'm going to completely contradict myself with a few examples of why that statement isn’t always true.
Try running my favourite ps command again, its abbreviated output is shown underneath:
# ps -ef
UID        PID     PPID  C STIME TTY TIME      CMD
apache   23026 22856  0 Feb26 ?        00:00:00 /usr/sbin/apache2
Now try running the full fat version by using an uppercase "F":
# ps -eF
UID        PID  PPID  C    SZ   RSS PSR STIME TTY          TIME CMD
apache   23026 22856  0 44482  3116   0 Feb26 ?        00:00:00 /usr/sbin/apache2
The differences are that the latter includes SZ, RSS and PSR fields. The first two are memory related whereas PSR shows which CPU the process is using. For more information there’s lots more in the manual:
# man ps
Onwards we can look at another alternative to the “-Z” option which we briefly touched on before:
# ps -efM
unconfined_u:system_r:apache2_t:s0 apache  23031 22856  0 Feb26 ?        00:00:00 /usr/sbin/apache2
A useful BSD throwback I quite like the look of is possibly one of the shortest commands known to
mankind. Have a look at Listing Five.
# ps l
F   UID   PID  PPID PRI  NI    VSZ   RSS WCHAN  STAT TTY        TIME COMMAND
4     0  1414     1  20   0   4064   584 n_tty_ Ss+  tty1       0:00 /sbin/mingetty /dev/tty1
4     0  1416     1  20   0   4064   588 n_tty_ Ss+  tty2       0:00 /sbin/mingetty /dev/tty2
4     0  1418     1  20   0   4064   584 n_tty_ Ss+  tty3       0:00 /sbin/mingetty /dev/tty3
4     0  1420     1  20   0   4064   580 n_tty_ Ss+  tty4       0:00 /sbin/mingetty /dev/tty4
4     0  1426     1  20   0   4064   584 n_tty_ Ss+  tty5       0:00 /sbin/mingetty /dev/tty5
4     0  1430     1  20   0   4064   588 n_tty_ Ss+  tty6       0:00 /sbin/mingetty /dev/tty6
4     0  9896  9558  20   0 191392  2740 poll_s S    pts/1      0:00 sudo -i
4     0  9899  9896  20   0 110496  1960 wait   S    pts/1      0:00 -bash
4     0 10776  9899  20   0 108104   980 -      R+   pts/1      0:00 ps l
Listing Five:Shows us the “long formatted” output which can be embellished with other options, harking from BSD origins

   Clarity


Sometimes even the mighty ps command struggles to precisely refine its output. Imagine a scenario where Java processes are filling up the process table and all you want to do is find their parent so that you can stop (or "kill") the process abruptly. To summarise your information you can use the non-hyphenated “S” switch:
# ps S
This helps to find a parent when its child processes only live for a short period of time.
What about when your Process Table is brimming with processes and you need to list a number of process PIDs at once? As you’d expect there are different ways to achieve this as Listing Six shows when we run the following command:
# ps -p "1 2" -p 3,4
PID TTY   TIME CMD
    1 ?        00:00:03 init
    2 ?        00:00:01 kthreadd
    3 ?        00:00:01 migration/0
    4 ?        00:00:20 ksoftirqd/0
Listing Six: We can pick and choose the PIDs that we view in a number of ways

  Everything Is A File


As we mentioned earlier the well-considered principle of basing as much as possible on Unix-like systems around files is a well-advised approach. It could be said that this also extends to the Process Table; consider the treasure trove of gems to be found if you delve deeply into the “procfs” pseudo-filesystem, located in root level “/proc” on your filesystem.
Elements of the innards of /proc can only be read from and not written to. The key file here is
“/etc/sysctl.conf” where you can also change many tunable kernel settings so that they persist following a reboot. One not-so-trivial caveat is that, almost magically, any freshly entered parameters into “/proc” are usually set live instantly so be careful!
Clearly this has a number of advantages. There's no messing about with stopping and starting daemons but be warned that if you're in the slightest bit unsure of making a change (especially to servers) then take a deep breath before doing so. Rest assured that a reboot will revert any changes that you make if they are not entered into the file “/etc/sysctl.conf”.
There are zillions of hidden corridors and secret rooms to explore inside /proc and sadly we will only be able to look at a tiny percentage of them. Needless to say that on a test Virtual Machine or development machine you should spend a long time tweaking, fiddling and breaking your current kernel’s procfs settings. If you’re like me then you might even find it vaguely cathartic and it’s safe to say that the immediacy of the changes really appeal to the impatient.
You can look further into a particular process which you've found using the excellent ps command as we've already seen. The path of Process ID “23022” for example is simply “/proc/23022” in relation to /proc.
If we enter that directory then we are shown (after some complaints that we don't have access to parts of the directory structure if we’re not logged in as root) the contents is presented as follows in Listing Seven:
dr-xr-xr-x.   8 apache apache 0 Feb 26 03:15 .
dr-xr-xr-x. 144 root   root   0 Feb 11 13:31 ..
dr-xr-xr-x.   2 apache apache 0 Feb 26 04:03 attr
-rw-r--r--.   1 root   root   0 Feb 28 08:25 autogroup
-r--------.   1 root   root   0 Feb 28 08:25 auxv
-r--r--r--.   1 root   root   0 Feb 28 08:25 cgroup
--w-------.   1 root   root   0 Feb 28 08:25 clear_refs
-r--r--r--.   1 root   root   0 Feb 26 04:03 cmdline
-rw-r--r--.   1 root   root   0 Feb 28 08:25 comm
-rw-r--r--.   1 root   root   0 Feb 28 08:25 coredump_filter
-r--r--r--.   1 root   root   0 Feb 28 08:25 cpuset
lrwxrwxrwx.   1 root   root   0 Feb 28 08:25 cwd -> /
-r--------.   1 root   root   0 Feb 27 14:01 environ
lrwxrwxrwx.   1 root   root   0 Feb 28 08:25 exe -> /usr/sbin/apache2
dr-x------.   2 root   root   0 Feb 26 04:03 fd
dr-x------.   2 root   root   0 Feb 28 08:25 fdinfo
-r--------.   1 root   root   0 Feb 28 08:25 io
-rw-------.   1 root   root   0 Feb 28 08:25 limits
-rw-r--r--.   1 root   root   0 Feb 28 08:25 loginuid
-r--r--r--.   1 root   root   0 Feb 28 08:25 maps
-rw-------.   1 root   root   0 Feb 28 08:25 mem
-r--r--r--.   1 root   root   0 Feb 28 08:25 mountinfo
-r--r--r--.   1 root   root   0 Feb 28 08:25 mounts
-r--------.   1 root   root   0 Feb 28 08:25 mountstats
dr-xr-xr-x.   4 apache apache 0 Feb 28 08:25 net
dr-x--x--x.   2 root   root   0 Feb 28 08:25 ns
-r--r--r--.   1 root   root   0 Feb 28 08:25 numa_maps
-rw-r--r--.   1 root   root   0 Feb 28 08:25 oom_adj
-r--r--r--.   1 root   root   0 Feb 28 08:25 oom_score
-rw-r--r--.   1 root   root   0 Feb 28 08:25 oom_score_adj
-r--r--r--.   1 root   root   0 Feb 28 08:25 pagemap
-r--r--r--.   1 root   root   0 Feb 28 08:25 personality
lrwxrwxrwx.   1 root   root   0 Feb 28 08:25 root -> /
-rw-r--r--.   1 root   root   0 Feb 28 08:25 sched
-r--r--r--.   1 root   root   0 Feb 28 08:25 schedstat
-r--r--r--.   1 root   root   0 Feb 28 08:25 sessionid
-r--r--r--.   1 root   root   0 Feb 28 07:52 smaps
-r--r--r--.   1 root   root   0 Feb 28 08:25 stack
-r--r--r--.   1 root   root   0 Feb 26 03:15 stat
-r--r--r--.   1 root   root   0 Feb 26 03:15 statm
-r--r--r--.   1 root   root   0 Feb 26 04:03 status
-r--r--r--.   1 root   root   0 Feb 28 08:25 syscall
dr-xr-xr-x.   3 apache apache 0 Feb 27 11:41 task
-r--r--r--.   1 root   root   0 Feb 28 08:25 wchan
Listing Seven: Inside “/proc/23022” we can see a number of pseudo files and directories for our Web server
You might want to think of this content as belonging to runtime system information. It has been said that /proc is a centralised config system for the kernel and it’s easy to see that directory is full of a mountain of information for just one process. As suggested rummaging through these directories and looking up which file does what when you have a spare moment might be described as therapeutic. It’s well worth the effort.

  Pseudo Filesystems


It’s hard to dismiss the power which /proc wields. Be wary though that there’s a lot going on inside your server when it is running, even if no-one is hitting your website. As a result wouldn’t it be sensible to separate the tricksy hardware settings aside from the kernel settings and Process Table?
Continuing onwards with our “Everything Is A File” mantra that’s exactly what Unix-type Operating Systems do. Step forward “/dev”.
When dealing with physical devices, whether connected to the machine or not, we turn to “/dev” and not “/proc”.
Here’s an abbreviated directory listing of “/dev” as shown in Listing Eight.
drwxr-xr-x.  2 root root         740 Feb 11 13:31 block
drwxr-xr-x.  2 root root          80 Feb 11 13:31 bsg
lrwxrwxrwx.  1 root root           3 Feb 11 13:31 cdrom -> sr0
lrwxrwxrwx.  1 root root           3 Feb 11 13:31 cdrw -> sr0
drwxr-xr-x.  2 root root           2.5K Feb 11 13:31 char
crw-------.  1 root root            5,1 Feb 11 13:31 console
lrwxrwxrwx.  1 root root         11 Feb 11 13:31 core -> /proc/kcore
drwxr-xr-x.  4 root root          80 Feb 11 13:31 cpu
crw-rw----.  1 root root          10,  61 Feb 11 13:31 cpu_dma_latency
crw-rw----.  1 root root          10,  62 Feb 11 13:31 crash
drwxr-xr-x.  5 root root         100 Feb 11 13:31 disk
Listing Eight: We can see an abbreviated list of some of the devices which “/dev” deals with
What about another example of what “/dev” can do for us? Lets take an example of the superb “lsof” utility. If you're not familiar with “lsof” then it's unquestionably worth a look at, I’m a big fan. The abbreviation “lsof” stands for “list open files” and its seemingly endless functionality is exceptionally useful.
Listing Nine shows us output from “lsof” when looking up information relating to the directory “/var/log“. We can display this information having run this command:
# lsof +D /var/log/
COMMAND PID   USER   FD   TYPE DEVICE SIZE/OFF   NODE NAME
rsyslogd       1103   root    1w   REG  253,4     2743     19 /var/log/messages
rsyslogd       1103   root    2w   REG  253,4     1906     17 /var/log/cron
rsyslogd       1103   root    4w   REG  253,4      747     18 /var/log/maillog
rsyslogd       1103   root    5w   REG  253,4     1753     27 /var/log/secure
apache2       22856   root    2w   REG  253,4      245 131095 /var/log/apache2/error_log
apache2       22856   root    6w   REG  253,4        0 131104 /var/log/apache2/access_log
apache2       23022 apache    2w   REG  253,4      245 131095 /var/log/apache2/error_log
apache2       23022 apache    6w   REG  253,4        0 131104 /var/log/apache2/access_log
apache2       23024 apache    2w   REG  253,4      245 131095 /var/log/apache2/error_log
apache2       23024 apache    6w   REG  253,4        0 131104 /var/log/apache2/access_log
apache2       23026 apache    2w   REG  253,4      245 131095 /var/log/apache2/error_log
apache2       23026 apache    6w   REG  253,4        0 131104 /var/log/apache2/access_log
apache2       23027 apache    2w   REG  253,4      245 131095 /var/log/apache2/error_log
apache2       23027 apache    6w   REG  253,4        0 131104 /var/log/apache2/access_log
apache2       23028 apache    2w   REG  253,4      245 131095 /var/log/apache2/error_log
apache2       23028 apache    6w   REG  253,4        0 131104 /var/log/apache2/access_log
apache2       23029 apache    2w   REG  253,4      245 131095 /var/log/apache2/error_log
apache2       23029 apache    6w   REG  253,4        0 131104 /var/log/apache2/access_log
apache2       23030 apache    2w   REG  253,4      245 131095 /var/log/apache2/error_log
apache2       23030 apache    6w   REG  253,4        0 131104 /var/log/apache2/access_log
apache2       23031 apache    2w   REG  253,4      245 131095 /var/log/apache2/error_log
apache2       23031 apache    6w   REG  253,4        0 131104 /var/log/apache2/access_log
Listing Nine: The output from the mighty “lsof” looks much like that from the ps command
I am using this “lsof” example because it highlights how a system weaves in and out referencing data from “/proc” and “/dev”. I won’t pretend to understand the nuances.
From its manual the versatile “lsof” transparently informs us of how it gathered such information about that directory, by telling us which files it references:
“/dev/kmem” - the kernel virtual memory device
“/dev/mem” - the physical memory device
“/dev/swap” - the system paging device
From what I can gather these files change between varying Unix versions but hopefully they at least give you a taste of which file is responsible for which task.
As we can see “/dev and “/proc” are useful for all sorts of things whether they be network related, devices (real or virtual), disks (loop disks and physical drives) and much more.

  Counting Processes


Now we’ve whet our whistles with a quick look at the Process Table and pseudo filesystems, “/dev” and “/proc”, let’s explore a few (hopefully useful) unrelated command lines which may save the day at some point in the future.
You might be concerned that a single member of a cluster of identical machines is beginning to give up the ghost. You could check how many processes the system has created since its last reboot by using this command:
# grep processes /proc/stat
Shovel at the ready now look inside the file “/proc/$PID/cmdline” (replacing “$PID” for your Process ID) and there you will find some buried goodies. This file retains the entire and complete command line for a process (almost always at least, zombie processes being one of the exceptions so please don’t fret if your mileage varies).
Sitting alongside that file, in the PID’s directory, is the “cwd” symbolic link (or symlink) to the current working directory of that process.You may need to be logged in as “root”.
In order to discover the current-working-directory of that process run this command:
# cd /proc/$PID/cwd; /bin/pwd
We probably need to be “root” sometimes because the symlink is hidden to normal users. I won't claim to understand all of the intricacies of these pseudo files but if you use the commands “cat” or “less” to view some of these files usually then a little more light is shed on their raison d’ etre.
One such pseudo file (which is less mysterious thanks to its name) is the disk input/output statistics file, named “io”. By running this command and seeing its output in Listing Ten:
# cat io
rchar: 0
wchar: 0
syscr: 0
syscw: 0
read_bytes: 342
write_bytes: 11
cancelled_write_bytes: 0
Listing Ten: Here we can see what this process has been up to in relation to disk activities
Amongst many others there's another useful addition which is the "maps" file. In Listing Eleven we can see the memory regions and their access permissions for a process by using:
# cat maps
7eff839c7000-7eff839de000 r-xp 00000000 fd:01 3221                       /lib64/libpthread-2.12.so
7eff839de000-7eff83bde000 ---p 00017000 fd:01 3221                       /lib64/libpthread-2.12.so
7eff83bde000-7eff83bdf000 r--p 00017000 fd:01 3221                        /lib64/libpthread-2.12.so
7eff83bdf000-7eff83be0000 rw-p 00018000 fd:01 3221                       /lib64/libpthread-2.12.so
7eff843ac000-7eff843b3000 r-xp 00000000 fd:01 3201                       /lib64/libcrypt-2.12.so
7eff843b3000-7eff845b3000 ---p 00007000 fd:01 3201                       /lib64/libcrypt-2.12.so
7eff845b3000-7eff845b4000 r--p 00007000 fd:01 3201                       /lib64/libcrypt-2.12.so
7eff845b4000-7eff845b5000 rw-p 00008000 fd:01 3201                      /lib64/libcrypt-2.12.so
7eff82fb4000-7eff83025000 r-xp 00000000 fd:01 3478                        /lib64/libfreebl3.so
7eff83025000-7eff83224000 ---p 00071000 fd:01 3478                       /lib64/libfreebl3.so
7eff83224000-7eff83226000 r--p 00070000 fd:01 3478                       /lib64/libfreebl3.so
7eff83226000-7eff83227000 rw-p 00072000 fd:01 3478                      /lib64/libfreebl3.so
Listing Eleven: An extremely abbreviated sample of the “maps” file for a process
Apparently the legend for the permissions is as follows:
r = read
w = write
x = execute
s = shared
p = private (copy on write)
The "maps" file can be useful to see how a process is interacting with the system’s files. Or maybe you’re curious as to which libraries a process needs and you have forgotten the correct options to add to a tool like the super-duper “lsof”.
Any eagle-eyed console champions will spot that the file sizes, having used "ls" to list the
files in the directory, all appear as zero bytes. Clearly these pseudo files are different animals than we’re used to getting our fingers nipped by.

   Kernel Support


Let's now move onto other benefits of /proc and not just on a per-process basis.
For example you might look at the filesystems which were compiled into the kernel by checking out "/proc/filesystems".
In Listing Twelve you can see (an abbreviated list) of what filesystems our kernel supports and even as standard it’s a sizeable list.
nodev sysfs
nodev rootfs
nodev bdev
nodev proc
nodev cgroup
nodev cpuset
nodev tmpfs
nodev devtmpfs
nodev binfmt_misc
nodev debugfs
nodev securityfs
nodev sockfs
nodev usbfs
nodev pipefs
nodev anon_inodefs
nodev inotifyfs
nodev devpts
nodev ramfs
nodev hugetlbfs
nodev pstore
nodev mqueue

Listing Twelve: Here we can see an abbreviated list of the types of file systems supported by the kernel without having to make any tricky changes
You may have heard of an excellent lightweight utility called "vmstat" which reports back dutifully with screeds of useful memory statistics.
You may not, at this juncture, fall off your seat if I tell you that in order to retrieve this useful
information the following files are used. Note the asterisk for all PIDs etc.
/proc/meminfo
/proc/stat
/proc/*/stat
Another aspect that the kernel deals with on a system is the hardware ports, you know the kind that accept a keyboard or a mouse. Have a peek at Listing Thirteen having looked into the file "/proc/ioports", again abbreviated for ease.
0000-001f : dma1
0020-0021 : pic1
0040-0043 : timer0
0050-0053 : timer1
0060-0060 : keyboard
0064-0064 : keyboard
0070-0071 : rtc0
0080-008f : dma page reg
00a0-00a1 : pic2
00c0-00df : dma2
00f0-00ff : fpu
Listing Thirteen: Displaying an abbreviated output from the file "/proc/ioports"
As expected we can also look at network information. I’ll leave you to trying some of these yourself. You might want to begin by trying this:
# ls /proc/net
Or for live ARP information (the Address Resolution Protocol) use the “cat” command in front of this:
# cat proc/net/arp
If that output looks familiar then think of how many utilities which you’ve used in the past that refer to this file.
Why stop with ARP? SNMP statistics are also readily available:
# cat /proc/net/snmp
There's a whole heap (no memory puns intended) of other options which we could explore but instead what about a look at changing some of the "sysctl" settings I mentioned earlier too.
Sadly the majority of the powerful changes you can make to a running system's kernel are for another day (there's simply too many to cover) but let's take the popular "/proc/sys" directory for a quick look before we finish.
What about if the system-wide limit of the number of open files for every process on the system is holding you up when you’re trying to launch your latest ground-breaking application?
This setting can cause all sorts of system headaches if it’s abused (and it appears that not only the “root” user can change it on occasion). Warnings aside it’s very useful to arm yourself with this quick fix if it's ever necessary.
Try this command yourself on a test box:
# echo 999999 > /proc/sys/fs/file-max
Once you've conquered that particular outage-inducing issue, taking all the glory as you go, how about checking that the new setting has stuck? Treat it like any other file:
# cat /proc/sys/fs/file-max
I should have of course mentioned that you should check the original value before making any changes (so you can revert the value if need be). My computer used "6815744".
What about another setting? This usually uses a start/stop daemon to make the change, on some systems, but let's do it on the fly:
# echo "ChrisLinux"> /proc/sys/kernel/hostname
In case that you’re wondering you will probably struggle to edit these files with an editor (you may get “file has changed” errors) hence using “echo” as above.
On other distributions you can affect the same change with:
# hostname "ChrisLinux"
I'm sure you get the idea; it’s hardly Computer Science after all.

   The End


We have looked in some detail (but not nearly enough) at the very clever Unix-like process table, procfs and “/dev” briefly. We covered how to read and sometimes manipulate tunable settings and how they integrate with components running on Unix-like systems.
Hopefully this starter-for-ten chapter will give you enough of an insight to know what to look if you encounter issues in the future. Above everything else however it’s important for you to find the time to fire up a test machine, dig into otherwise buried file paths and tweak the available settings to further increase your knowledge.
Incidentally should you ever find yourself at a loss on a rainy afternoon then try running this command:
# /sbin/sysctl -a
That should definitely offer you some food for thought. It helpfully lists all of the tunable kernel parameters on a system, each of which can be altered with "echo", simply read the “dots” as “slashes” to find them inside /proc. Just don’t make ill-advised, arbitrary kernel changes on a production machine or you will likely rue the day!
If you weren’t aware of some of the settings that we’ve covered then I hope you will enjoy your newly gained Sysadmin knowledge and use it creatively in the future.


   Linux Books


If you've enjoyed reading the technical content on this site then please have a look at my Linux books which were both published in 2016 and some of my articles in Linux Magazine and Admin Magazine are available on their respective websites.

Container and Microservices Myths: The Red Hat Perspective

$
0
0
http://thevarguy.com/open-source-application-software-companies/container-and-microservices-myths-red-hat-perspective

Red Hat executive Lars Herrmann discusses container and microservices trends, including container portability, security and standards.

thinkstock.com
What are containers and microservices? What are they not? These are questions that Lars Herrmann, general manager of Integrated Solutions Business Unit at Red Hat, answered recently for The VAR Guy in comments about popular container misconceptions and myths.
It's no secret that containers have fast become one of the hottest new trends in computing. But like cloud computing or traditional virtualization before them, containers do not live up to the hype in all respects. In order to leverage container technology effectively, organizations need to understand the history behind containers, their limitations and where they fit in to the data center landscape alongside virtual machines.
The discussion of container misconceptions below is a condensed version of commentary delivered by Herrmann to The VAR Guy.
Misconception #1: Containers are New
Container packaging as we use it today is new (highlighted by the Docker/OCI image format), as is the concept of using container orchestration like Kubernetes to scale workloads across clusters of hosts. But the idea of sharing an operating system instance in isolating different parts of an application is not. From Unix Chroot to FreeBSD jail to Sun Microsystems’ Solaris Zones, solutions have been available for splitting up and dedicating system resources for some time now.
It’s also important to note that many of the technologies inherent to Linux containers (namespaces, cgroups, etc.) have been the foundation of many first generation PaaS offerings. What’s new is the ability to leverage the container capabilities of Linux to run and manage a very broad set of applications, ranging from cloud-native microservices to existing, traditional applications.
Misconception #2: Containers are Completely Self-Contained Entities
Despite their name, containers are not completely self-contained. Each container "guest" system leverages the same host OS and its services. This reduces overhead and improves performance, but may introduce potential security or interoperability issues.
Misconception #3: Containers can Replace Virtual Machines
Containers won’t replace virtual machines wholesale because they don’t work exactly like virtual machines. Each has its place in the enterprise, and companies must figure out which makes sense for what workloads. In short, virtualization provides flexibility by abstraction from hardware, while containers provide speed and agility through lightweight application packaging and isolation.
So, instead of thinking of containers as replacing virtual machines, companies should be thinking about containers as a complement to virtual machines -- with the workload and infrastructure needs determining what to use when.
Misconception #4: Containers are Universally Portable
Containers depend on the host OS kernel and services to function, with "depend" being the operative word. Containers also must cross physical hardware, hypervisors, private clouds, public clouds, and more. Indeed, for containers to be truly portable, developers must have in place an integrated application delivery platform built on open standards.
As with so many things, standards are key -- across the entire ecosystem.
Misconception #5: Containers are Secure by Default
There are many benefits to running containers in the enterprise, but those benefits must be weighed against the risk that can arise with the technology. Think about two physical machines -- you can isolate them on the network. If one goes down and/or is infected with a virus, the other machine can be pretty easily defended. In a containerized environment, on the other hand, the OS kernel on the host system is being used by all of the containers. This kind of sharing brings with it inherent risk.
The level of isolation provided by the Linux kernel is combining process isolation with namespaces which works very well, but by design doesn’t close out all potential paths malicious code could take to break out and gain access to the host or other containers. That’s why technologies such as SELinux provide a needed additional layer of policy and access control.
What is most important, though, is what’s running inside the container. Industry best practices such as relying on trusted components obtained from trusted sources, complemented with scanning capabilities to "trust but verify" enterprise applications, apply to containers as well. The immutable nature of containers creates an opportunity to manage changes at the image itself, not the running instance. So the container distribution architecture, often implemented as federated registries, becomes a critical element in managing the security and patching of containers.

How to record your terminal session on Linux

$
0
0
https://www.howtoforge.com/tutorial/how-to-record-your-terminal-session-on-linux


Recording a terminal session may be important in helping someone learn a process, sharing information in an understandable way, and also presenting a series of commands in a proper manner. Whatever the purpose, there are many times when copy-pasting text from the terminal won't be very helpful while capturing a video of the process is quite far-fetched and may not be always possible. In this quick guide, we will take a look at the easiest way to record and share a terminal session in .gif format.

Prerequisites

If you just want to record your terminal sessions and be able to play the recording in your terminal, or share them with people who will use a terminal for playback, then the only tool that you'll need is called “ttyrec”. Ubuntu users may install it by inserting the following command on a terminal:
sudo apt-get install ttyrec
If you want to produce a .gif file from the recording and be able to share it with people who don't use the terminal, publish it on websites, or simply keep a .gif handy for when you'll need it instead of written commands, you will have to install two additional packages. The first one is “imagemagick” which you can install with:
sudo apt-get install imagemagick
and the second one is “tty2gif” which can be downloaded from here. The latter has a dependency that can be satisfied with:
sudo apt-get install python-opster

Capturing

To start capturing the terminal session, all you need to do is simply start with “ttyrec” + enter. This will launch the real-time recording tool which will run in the background until we enter “exit” or we press “Ctrl+D”. By default, ttyrec creates a file named “ttyrecord” on the destination of the terminal session which by default is “Home”.
Capture Linux Termial session - part 1
Capture Linux Termial session - part 2
Capture Linux Termial session - part 3

Playing

Playing the file is as simple as opening a terminal on the destination of the “ttyrecord” file and using the “ttyplay” command followed by the name of the recording (in our case it's ttyrecord but you may change this into whatever you want).
Play back a terminal session.
This will result in the playback of the recorded session, in real-time, and with typing corrections included (all actions are recorded). This will look like a completely normal automated terminal session, but the commands and their apparent execution are obviously not really applied to the system, as they are only reproduced as a recording.
It is also important to note that the playback of the terminal session recording is completely controllable. You may double the playback speed by hitting the “+” button, slow it down with the “-” button, pause it with “0”, and resume it in normal speed with “1”.

Converting into a .gif

For reasons of convenience, many of us would like to convert the recorded session into a .gif file, and that is very easy to do. Here's how:
First, untar the downloaded “tty2gif.tar.bz2” by opening a terminal in the download location and entering the following command:
tar xvfj tty2gif.tar.bz2
Next, copy the resulting “tty2gif.py file onto the destination of the “ttyrecord” file (or whatever the name you've specified is), and then open a terminal on that destination and type the command:
python tty2gif.py typing ttyrecord
If you are getting errors in this step, check that you have installed the “python-opster” package. If errors persist, give the following two commands consecutively:
sudo apt-get install xdotool
export WINDOWID=$(xdotool getwindowfocus)
then repeat the “python tty2gif.py typing ttyrecord ” and you should now see a number of gif files that were created on the location of the “ttyrecord”
Recorded terminal session as gif file.
The next step is to unify all these gifs that correspond to individual terminal session actions into one final .gif file using the imagemagick utility. To do this, open a terminal on the destination and insert the following command:
convert -delay 25 -loop 0 *.gif example.gif
Convert to gif
You may name the resulting file as you like (I used “example.gif”), and you may change the delay and loop settings as needed. Here is the resulting file of this quick tutorial:
The terminal session as gif

10 Best Free Linux Terminal Recorders

$
0
0
http://www.linuxlinks.com/article/20160610023545812/TerminalRecorders.html

Most users fear the command line. However, it holds real power and versatility. Commands issued from a shell enable system administrators a quick and easy way to update, configure and repair a system. The benefits of the command line are not only confined to system administration. The ability to transverse the file system quickly, give more information about files and directories, automate tasks, bring together the power of multiple console tools in a single command line, and run shell scripts are just a few examples of how the command line can offer a potent, multifarious toolbox.
A screencast is a digital recording of computer screen output, often carrying audio narration. Screencasting software takes a series of screenshots of a running application, recording the user's actions, and creating a video file. This type of software was brought into prominence by the commercial Windows application Lotus ScreenCam in 1994. The vast majority of screencasting tools capture a graphical environment. However, here we will examine tools that capture the command line.
Screencasts have a wide variety of uses. This type of software is often deployed to describe software projects, demoing instructions (the user can cut and paste), report bugs, and for evaluating technical skills. Plain text screencasting lets you explain and perform commands at the same time, simultaneously offering a tutorial and showcase. Further, plain text screencasting uses less bandwidth than flash video, and provides a powerful educational tool. It also lets users share all their proficient terminal hacks.
As broadband has become mainstream and video-sharing websites are ten a penny, this has encouraged the development of a wide selection of free and open source screencasting tools. In the field of plain text screencasting, there are two web services that stand out. Playterm and Shelr both allow you to embed terminal recordings online.
To provide an insight into the quality of software that is available, we have compiled a list of 10 useful Linux plain text screencasting tools. All of these tools are released under a freely distributable license.
So let's explore the 10 screencasting tools at hand. For each application we have compiled its own portal page, a full description with an in-depth analysis of its features, a screenshot, together with links to relevant resources and reviews. Start recording activities today!
Terminal Recorders
ttystudioExcellent terminal-to-gif recorder
asciinemaRecord and share terminal sessions
ShelrBroadcast plain text screencasts
ShowtermTerminal record and upload utility
TermRecordTerminal session recorder with easy-to-share self-contained HTML output
ttyrecTerminal recorder, includes a playback tool
IPBTHigh-tec terminal player
tty2gifRecord scripts into both binary and gif formats
termrecSet of tools for recording and replaying tty sessions
scriptThe granddaddy of terminal recorders
Return to our complete collection of Group Tests, identifying the finest Linux software.

Guide to Install MongoDB 3.2 on CentOS 7.x and RHEL 7.x

$
0
0
http://www.linuxtechi.com/install-mongodb-3-2-on-centos-7and-rhel-7

MongoDB is a scalable, Open source, high performance and document oriented NoSQL database. It is developed and supported by 10gen. NoSQL stats that MongoDB doesn’t use Tables and rows.
MongoDB provide better performance as compared to other databases because it saves the data in JASON like documents along with dynamic schema.
In this article we will describe the installation steps of MongoDB 3.2 on CentOS 7.x and RHEL 7.x

Step:1 Configure MongoDB 3.2 yum Repository.

In both Operating system RHEL7.x and CentOS 7.x yum repositories are kept in ‘/etc/yum.repos.d/’ directory.  Create the mongodb repository file with the name “mongodb-org.repo”.
[root@mongodb ~]# cd /etc/yum.repos.d/
[root@mongodb yum.repos.d]# vi mongodb-org.repo
[mongodb-org]
name=MongoDB 3.2 Repository
baseurl=https://repo.mongodb.org/yum/redhat/$releasever/mongodb-org/3.2/x86_64/
gpgcheck=1
enabled=1
gpgkey=https://www.mongodb.org/static/pgp/server-3.2.asc

Step:2 Install MongoDB package using yum command.

To install MongoDB and its dependent packages use the below yum command.
[root@mongodb ~]# yum install mongodb-org -y
Above command will install the followings MongoDB Packages
Mongodb-org-package-component
Following files and directory will be created once the MongoDB packages are installed.
  • /etc/mongod.conf— Cofiguration file of MongoDB (By default localhost ip  (127.0.0.1) is bind IP and 27017 is the default port ).
  • /var/lib/mongo  — Data directory of MongoDB
  •  /var/log/mongodb/mongod.log  — Log file of MongoDB

Step:3 Start and Enable the Mongodb service.

Run the beneath commands to start and enable the mongodb service across the reboot.
[root@mongodb ~]# systemctl start mongod.service
[root@mongodb ~]# systemctl enable mongod.service
mongod.service is not a native service, redirecting to /sbin/chkconfig.
Executing /sbin/chkconfig mongod on
[root@mongodb ~]#
In Case OS firewall is enabled and running then open the MongoDB port ‘27017’ using below firewalld-cmd command.
[root@mongodb ~]# firewall-cmd --zone=public --add-port=27017/tcp --permanent
success
[root@mongodb ~]# firewall-cmd --reload
success
[root@mongodb ~]#

Step:4 Connect to MongoDB from the terminal.

Type the command ‘mongo’ from the terminal to connect MongoDB
[root@mongodb ~]# mongo
While connecting to MongoDB we may get below warning message
Warning-Message-while-connecting-mongdb
Use the below commands to resolve ‘transparent huge page error‘ :
[root@mongodb ~]# echo never > /sys/kernel/mm/transparent_hugepage/enabled 
[root@mongodb ~]# echo never > /sys/kernel/mm/transparent_hugepage/defrag
[root@mongodb ~]# systemctl restart mongod
[root@mongodb ~]#
To make above changes permanent, add the above lines in /etc/rc.local file and assign executable rights to /etc/rc.local file.
[root@mongodb ~]# cat /etc/rc.local
echo never > /sys/kernel/mm/transparent_hugepage/enabled;
echo never > /sys/kernel/mm/transparent_hugepage/defrag;
root@mongodb ~]# chmod +x /etc/rc.local
Use below steps to resolve Warning Error related to rlimits, exact error is shown above.
Add the below entry for mongd user in ‘/etc/security/limits.d/20-nproc.conf’ file.
[root@mongodb ~]# vi /etc/security/limits.d/20-nproc.conf
mongodsoft nproc 64000
Reboot the Server and then try to connect MongoDB using mongo command:
[root@mongodb ~]# mongo
MongoDB shell version: 3.2.7
connecting to: test
>
As you can see that we are able to connect mongodb without any warnings, So our installation is completed now.

Uninstall / Remove MongoDB

Run the beneath commands one after the another from the console to remove MongoDB completely.
[root@mongodb ~]# systemctl stop mongod
[root@mongodb ~]# yum erase $(rpm -qa | grep mongodb-org)
[root@mongodb ~]# rm -rf /var/log/mongodb
[root@mongodb ~]# rm -rf /var/lib/mongo
[root@mongodb ~]#
Reference:  https://docs.mongodb.com/manual/tutorial/install-mongodb-on-red-hat/

Linux Utility - Understand Linux Crontab Or Cron Expressions To Run Command At Specific Interval

$
0
0
http://www.linuxandubuntu.com/home/linux-utility-understand-linux-crontab-or-cron-expressions-to-run-command-at-specific-interval


linux crontab expressions
Linux Crontab helps you to run commands, apps or scripts at a custom specific interval. You can schedule the run at the required interval. Crontab runs in background as daemon and check crontab file at /etc/crontab and /etc/cron.*/ directories. These include cron.d/, cron.daily/,  cron.hourly/, cron.monthly/, cron.weekly/ directories. In this article, we'll discuss the cron expressions and how to configure your commands to run daily, weekly or every minute as per your requirement through Linux Crontab.

How To Use Crontab?

In Linux, every user has its own cron file which can be edited by using crontab command.

The section following this explains various fields for cron expression. Cron is pre-bundled in Linux and no need to separately install it. To open crontab file use command -
Open crontab file
NOTE: If you are opening crontab for the first time, it will prompt you to choose the editor before using. Choose editor of your preference.

When opened you will see few commented lines that explain the usage and cron example. One more thing, below is the screenshot of cron file in “Ubuntu”. I have customised my Ubuntu to look like Mac. So don't get confused that I am using Mac.
open cron file

​Linux Crontab Expressions

Let's understand that how we can use cron expressions to configure commands to run at specific time interval. It might look a little difficult but believe me it's easy.
The cron expressions are mainly divided into two parts :

  1. Date part : that defines at what interval or time the command has to be executed.
  2. Command: command to executed.
The expression takes the form -
Cron expressions

Cron Operators

Cron operators add flexibility in defining command timings.
* : Asterisk (*) is for every possible value, for example, * in minute would mean every minute
Example (Run everyday at 5 am)
,  : Comma specifies the list of values.
Example (Run everyday at 5 am, 7 am and 10 am)
- : dash specifies range of values.
Example (Run at 5,6,7 am daily)
/ :  Seperater

​       This is step operator use to specify for terms like every hour. For example to run command at every 3 hours you would use */3 in your expression
Example Run every 3 hours

Cron Expressions Usage

Let’s take some more examples to understand the usage of cron expressions.
Run backup script every 5 mins  
Run backup script every 5 hours
Run backup script every sunday at midnight

Special Crontab Strings

Besides operators, there are special strings defined by cron that are very easy to use.
Special Crontab strings

Syntax To Use Special Strings

@STRING Command
Run the backup script weekly
Run the backup script daily

Viewing Existing Cron Configurations

To list out user's existing cron configurations you can use command -
List existing cron

Generating Linux Crontab Expressions With Tool ​

Additionally, if you are still confused with Linux cron expressions and it's usage, there are online tools available that help you to build the cron expressions easily.

CronMaker : http://www.cronmaker.com/
Crontab generator: http://crontab-generator.org/

4 Unique Ways Uber, Twitter, PayPal, and Hubspot Use Apache Mesos

$
0
0
https://www.linux.com/news/4-unique-ways-uber-twitter-paypal-and-hubspot-use-apache-mesos

four burgers on a plate
You know the saying: fast, cheap, or good, pick two. Uber, Twitter, PayPal, and Hubspot show that you can have all three with Apache Mesos.
Apache Mesos is a cluster manager; it sits between the application layer and the operating system, and deploys and manages applications in large-scale clustered environments. But this dry description doesn't convey its vast scope for creative and ingenious solutions to large-scale problems.
-Uber uses it to run a cluster of geographically-diverse datacenters.
-Twitter built a system to precisely track and cost resource usage.
- PayPal is building a self-sustaining dynamically-sized cluster, in effect using Mesos to run itself.
- HubSpot uses Mesos to dynamically manage 200 Nginx load balancers.
These are all use cases that go far beyond simple clustering. Watch videos, below, of each company's use case, presented June 1-2 at MesosCon North America 2016. And see all 55+ recorded sessions for more from MesosCon North America.

Uber: Running Cassandra on Apache Mesos Across Multiple Datacenters

Dr. Abhishek Verma, Uber

Dr. Abhishek Verma, first author of the Google Borg Paper, describes using the Apache Cassandra database and Apache Mesos to build a fluid, efficient cluster of geographically diverse datacenters. The goals of this project are five nines reliability, low cost, and reducing hardware requirements. Mesos allows such flexible resource management that you can co-locate services on the same machine.
Mesos does not support multi-datacenter deployments, but Cassandra does. Cassandra has a mechanism called seeds. Seeds are special nodes that tell new nodes how the join the cluster. A seed node "talks" to other nodes in the Cassandra cluster to get the membership and topology information. Dr. Verma's team created a new custom seed provider, and this has its own URL. New nodes access this URL and gets the information they need to start up and join the cluster.
Dr. Verma explained "We are trying to move away from our in-house custom deployment system to everything running on Mesos. All our services, all our stateful frameworks, everything is going to run on top of Mesos. We can gain these efficiencies because we co-locate services on the same machine. If you have a CPU intensive service, you can co-locate it with a storage engine which is just requiring a lot of SSG space or a lot of memory.
"This can lead to 30 percent fewer machines as we explored in the Google Borg Paper. In this, what we did is we looked at a shared cluster and we looked at the number of machines in this shared cluster. Then it partitioned the workload into production workload and batch workload. We estimated if we just had one cluster, which was serving the production workload, and one which was just serving the batch workload, how many more machines would we need? It turned out that we would need almost 30 percent more machines in the median cell. We can save all of these machines if we co-locate all of these different services on the same machines." Watch the full talk, below.

Twitter: How We Built a Chargeback System for Twitter's Compute Platform

Micheal Benedict and Jeyappragash Jeyakeerthi, Twitter

Twitter's compute platform manages thousands of containers across thousands of hosts. But they had no way of knowing if containers were sized properly and using hardware efficiently, couldn't tell who owned which containers and services, and couldn't track resource use by container. Micheal Benedict and Jeyappragash Jeyakeerthi (JJ for short) built their Chargeback system on Mesos to answer these questions. Then they make this data available to users, and put a realistic dollar cost on it. This shows users that there is a real cost, and real money that is wasted when they schedule, for example, a 24-core job to do the work of a 4-core job.
Benedict describes their goals as "...to capture all the different resources, every infrastructure system provided. One of the first things we want to talk about is we have three big problems over here. The first one is called resource fluidity. What this essentially means is for example, Aurora Mesos has the notion of the three basic resources. You have cores, memory and disk and users get to define that when they're launching a job. What's important over here is to note that there's no notion of time. When you're actually doing something like Chargeback, you want to charge people for the resources they use over a period of time. This doesn't capture it. We launch a job, the job gets killed or it continues to run. One of the first things is we wanted to track the fluidity of these resources across time and we had to do that pretty much for every other infrastructure as well. We also wanted to support additional resources as they get added..."
"The next step is to actually put a unit price or a dollar next to these resources. When Aurora is offering cores as a resource to the customer, that I can acquire 1,000 cores, I need to actually put a dollar next to it so people get an understanding of what's the impact. This dollar needs to actually be as close to the real cost as possible and this is really where we invested a lot of our time in because there's always this notion of having funny money which really doesn't work. People are under the assumption, "It's just funny money. Why do I care?""

Paypal: Efficient Usage of Apache Mesos Using Container Hibernation

Kamalakannan Muralidharan, Paypal

One of the challenges of operating a Mesos cluster is efficiently allocating your resources. One approach is to schedule applications on demand: take down applications when they're not used, and bring them back up on demand. Set a timeout, and when the application is not used for that period of time send it into hibernation. Then when a use request comes in spin it back up. Integration with a software load balancer provides necessary capabilities such as events based on traffic pattern, and traffic hits.
In his MesosCon presentation, Kamalakannan Muralidharan discusses the flexibility and agility that is possible with Mesos: "Even though Mesos is good at handling a cluster, somebody has to provision and make it available for Mesos to use the cluster. We built a system which can automatically create a cluster and monitor the cluster, make sure that this capacity is there for applications to run. If it finds that it says less capacity, it scales up; if it finds there are not many applications running and capacity is underutilized, it will shrink the cluster. We build a complete, closed-loop system to manage Mesos and its Mesos' resources itself. After once the resource is given to Mesos, Mesos manages it for applications and application deployments."

HubSpot: Migrating 200+ Load Balancers into Apache Mesos

Stephen Salinas, HubSpot

HubSpot wanted a better way to manage their 200+ Nginx load balancers. They wanted more efficient use of resources, reliability, easier management, easier monitoring so they could know exactly what was happening anywhere at anytime, service discovery, failover, configuration validation, and very fast provisioning. Right, and why not some unicorns as well? But they did it with Mesos and other open source tools, including ZooKeeper and Docker.
Stephen Salinas discusses some of the benefits of their Mesos-based dynamic load-balancer system: "We condensed I think it was about 225 was the highest limit of that down to less than 10 servers, saving us about 24 grand a month in server costs, which was a pretty cool thing. Then on top of that, now that this deploys through our scheduler, it deploys like any other app would, so upgrading Nginx is the same as deploying a new build of an API, so we can leverage all those same deploy processes, putting blockers on deploys, rolling things back if they go bad, and I could do an Nginx upgrade in under a half an hour instead of going into every server, take it out, upgrade it, put it back in, taking hours and hours and hours at a time, so it's very fast and very easy to operate on this stuff.
"Then kind of the unseen benefit of this is it gave us a bit of a new view on things as to what we could and couldn't run in Mesos. Obviously there's challenges to each thing, but if something very, very static like a load balancer could run in Mesos, why not just everything? Why not cash servers? Why not, obviously people are looking at running SQL in Mesos. There's lots of things out there that can really benefit from everything that Mesos has to offer as long as you do it in the right way."

MesosCon North America

The Mesos slogan is Program against your datacenter like it's a single pool of resources. The project has excellent documentation, including how to get started testing Mesos.
The call for speaking proposals is open for MesosCon Europe. The Apache Mesos community wants to hear from you! Share your knowledge, best practices and ideas with the rest of the community. Submit your proposal now. The deadline to submit proposals is June 17, 2016.
mesoscon-video-cta-2016.jpg?itok=PVP-FqWv
Apache, Apache Mesos, and Mesos are either registered trademarks or trademarks of the Apache Software Foundation (ASF) in the United States and/or other countries. MesosCon is run in partnership with the ASF.
Viewing all 1413 articles
Browse latest View live


<script src="https://jsc.adskeeper.com/r/s/rssing.com.1596347.js" async> </script>