Quantcast
Channel: Sameh Attia
Viewing all 1417 articles
Browse latest View live

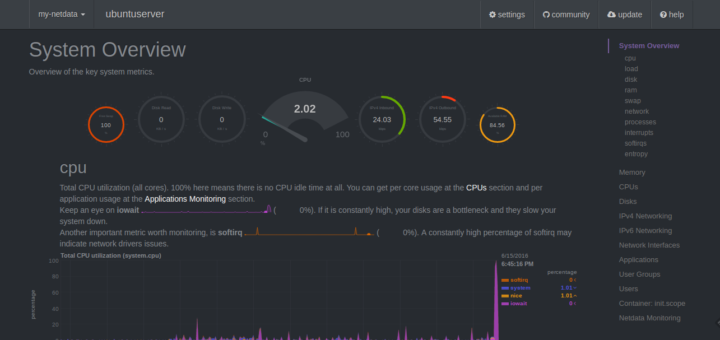
NetData : A Real-time performance monitoring tool for Linux

$
0
0
http://www.ostechnix.com/netdata-real-time-performance-monitoring-tool-linux

NetData

About NetData

NetData is a free, simple, yet useful utility that provides the real-time performance monitoring for your Linux systems, applications, SNMP devices, and visualize the result in a web browser with comprehensive detail. So, you can clearly get an idea of what is happening now, and what happened before in your Linux systems and applications. You don’t need to be an expert to deploy this tool in your Linux systems. NetData just works fine out of the box with zero configuration, and zero dependencies. Just install this utility and sit back, NetData will take care of the rest.
It has its own built-in webserver to display the result in graphical format. NetData is incredibly fast and efficient, and it will immediately start to analyze the performance of your system in no time after installing it. It is written using C programming language, so it is extremely light weight. It consumes less than 3% of a single core CPU usage and a 10-15MB of RAM. We can easily embed the charts with any existing web pages, and also it has a plugin API, so that you can monitor any application.
Here is the list of things that will be monitored by NetData utility in your Linux system.
  • CPU usage
  • RAM Usage
  • Swap memory usage
  • Kernel memory usage
  • Hard disks and its usage
  • Network interfaces
  • IPtables
  • Netfilter
  • DDoS protection
  • Processes
  • Applications
  • NFS server
  • Web server (Apache & Nginx)
  • Database servers (MySQL)
  • DHCP server
  • DNS server
  • Email server
  • Proxy server
  • Tomcat
  • PHP
  • SNP devices
  • And many more.
NetData will work on almost all Linux operating systems such as,
  • Arch Linux
  • Alpine Linux
  • CentOS
  • Fedora
  • Gentoo
  • PLD Linux
  • RedHat Enterprise Linux
  • SUSE
  • Ubuntu / Debian

Install NetData On Arch Linux

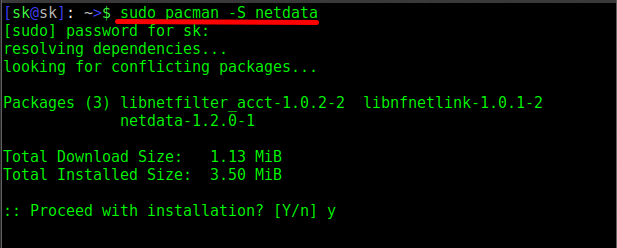
The latest version is available in the Arch Linux default repositories. So, we can install it with pacman using command:
sudo pacman -S netdata
Deepin Terminal_001
Install NetData in Arch Linux
At the end of installation, you will see the following message.
After the daemon has been started for the first time,
download the default config file from
http://127.0.0.1:19999/netdata.conf

Copy it to /etc/netdata/ and modify it.

Optional dependencies for netdata
nodejs: Webbox plugin
NetData installation completed
Finally, start NetData service using command:
sudo /usr/sbin/netdata

Install NetData on DEB or RPM based systems

NetData is not available in DEB based (Ubuntu / Debian) or RPM based (RHEL / CentOS / Fedora) systems. We need to install NetData using its repository.
First install the required dependencies:
On Ubuntu / Debian distros:
sudo apt-get install curl jq nodejs zlib1g-dev uuid-dev libmnl-dev gcc make git autoconf autogen automake pkg-config
On RHEL / CentOS / Fedora distros:
sudo yum install curl jq nodejs zlib-devel libuuid-devel libmnl-devel gcc make git autoconf autogen automake pkgconfig
After installing the required dependencies, install NetData on DEB or RPM based systems as shown below.
Git clone the NetData repository:
git clone https://github.com/firehol/netdata.git --depth=1
The above command will create a directory called ‘netdata’:
Cloning into 'netdata'...
remote: Counting objects: 279, done.
remote: Compressing objects: 100% (261/261), done.
remote: Total 279 (delta 11), reused 118 (delta 1), pack-reused 0
Receiving objects: 100% (279/279), 1.64 MiB | 246.00 KiB/s, done.
Resolving deltas: 100% (11/11), done.
Checking connectivity... done.
Change to the ‘netdata’ directory:
cd netdata/
Finally, install and start NetData using command:
sudo ./netdata-installer.sh
Sample output:
Welcome to netdata!
Nice to see you are giving it a try!

You are about to build and install netdata to your system.

It will be installed at these locations:

- the daemon at /usr/sbin/netdata
- config files at /etc/netdata
- web files at /usr/share/netdata
- plugins at /usr/libexec/netdata
- cache files at /var/cache/netdata
- db files at /var/lib/netdata
- log files at /var/log/netdata
- pid file at /var/run

This installer allows you to change the installation path.
Press Control-C and run the same command with --help for help.

Press ENTER to build and install netdata to your system > ## Press ENTER key
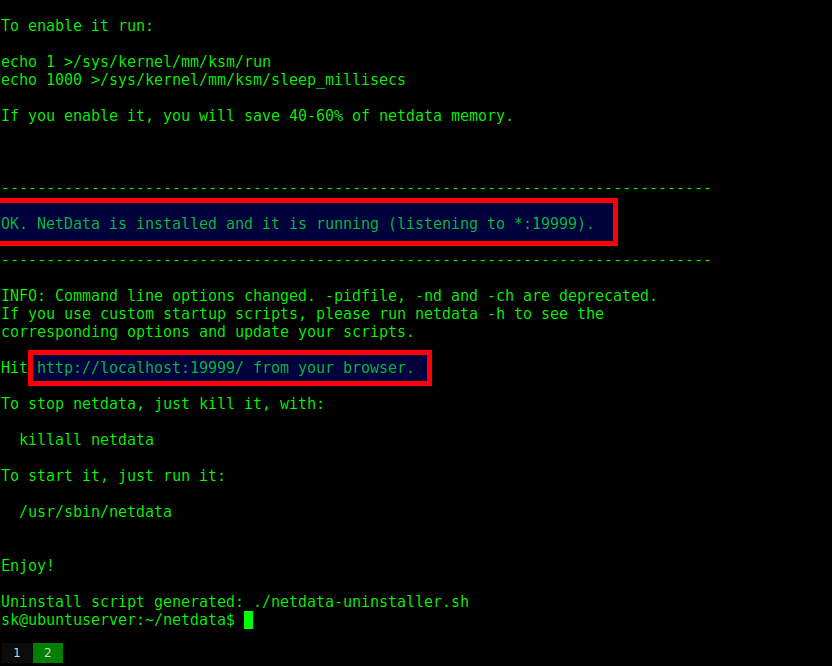
After installing NetData, you will see the following output at the end:
-------------------------------------------------------------------------------

OK. NetData is installed and it is running (listening to *:19999).

-------------------------------------------------------------------------------

INFO: Command line options changed. -pidfile, -nd and -ch are deprecated.
If you use custom startup scripts, please run netdata -h to see the
corresponding options and update your scripts.

Hit http://localhost:19999/ from your browser.

To stop netdata, just kill it, with:

killall netdata

To start it, just run it:

/usr/sbin/netdata


Enjoy!

Uninstall script generated: ./netdata-uninstaller.sh
Install NetData
Install NetData
NetData has been installed and started.

Allow NetData default port via Firewall or Router

If you system behind any firewall, and want to to access the NetData web interface from any remote systems on the network, you must allow the 19999 port through your firewall/router.
On Ubuntu / Debian:
sudo ufw allow 19999
On CentOS / RHEL / Fedora:
sudo firewall-cmd --permanent --add-port=19999/tcp
sudo firewall-cmd --reload

Access NetData via Web browser

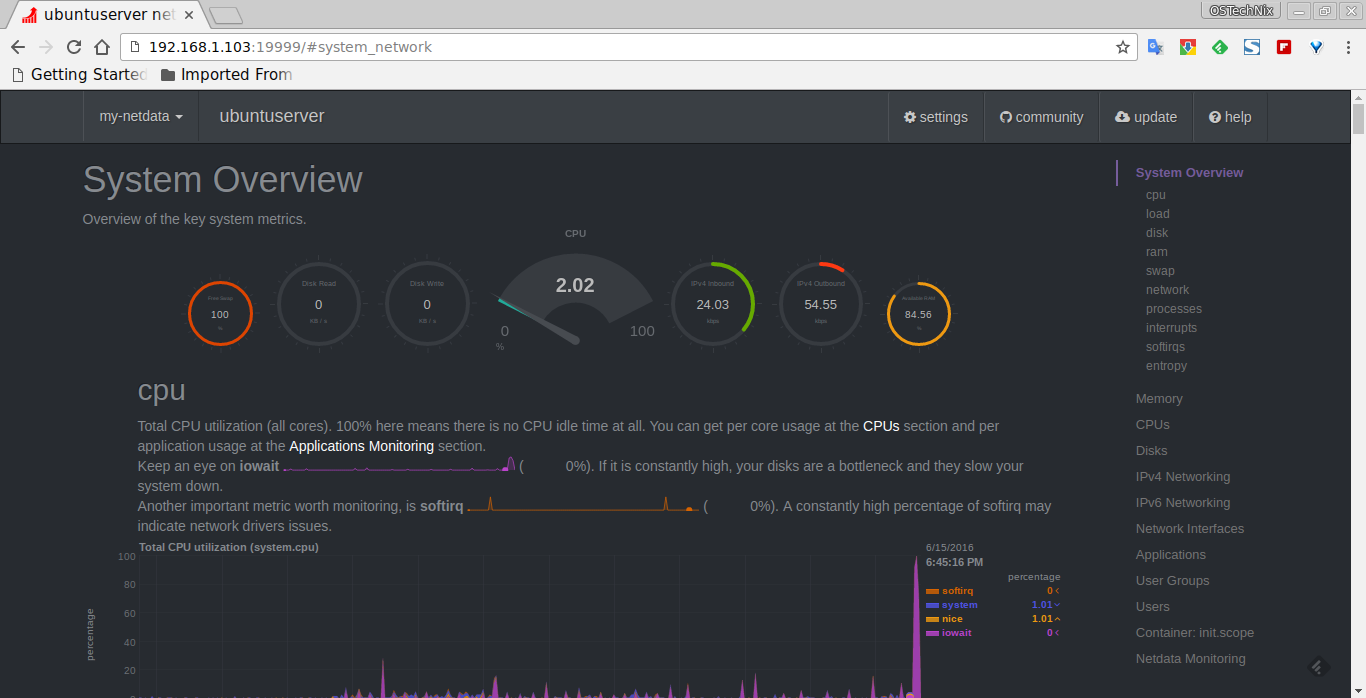
Open your web browser, and navigate to http://localhost:19999/. You should see a screen something like below.
NetData dashboard
NetData dashboard
Here, You will find the complete statistics of your Linux system in this page. Scroll down to view each section.
You can download and view NetData default configuration file at any time by simply navigating to http://localhost:19999/netdata.conf.
NetData configuration file

Starting / Stopping NetData

To start NetData, run:
sudo /usr/sbin/netdata
To stop netdata, just kill it, using command:
sudo killall netdata

Updating NetData

In Arch Linux, just run the following command to update NetData. If the updated version is available in the repository, it will be automatically installed.
sudo pacman -Syyu
In DEB or RPM based systems, just go to the directory where you have cloned it (In our case it’s netdata).
cd netdata
Pull the latest update using command:
git pull
Then, rebuild and update it using command:
sudo ./netdata-installer.sh

Uninstalling NetData

Go to the location where you have cloned NetData.
cd netdata
Then, uninstall it using command:
sudo ./netdata-uninstaller.sh --force
In Arch Linux, the following command will uninstall it.
sudo pacman -R netdata
That’s all for now. NetData is pretty simple in terms of installation and usage. You can monitor the performance of your local system or remote system in minutes without much hassle. As far as I tested NetData, it worked well as I expected. Give it a try, you won’t be disappointed.
Cheers!
Reference links:

How to get started with 3D printing in Blender

$
0
0
https://opensource.com/life/16/6/how-get-started-3d-printing-blender

Opensource.com 3D printed coin
Image by : 
opensource.com
Being a 3D artist used to mean that you were exclusively a digital artist—you worked in a virtual environment with intangible materials. The result of your work was destined to be seen only in print or on screens. Even in a virtual reality (VR) environment, the result is, at best, an illusionary representation of your three-dimensional work. 3D printing has changed that.
3D printing has given 3D artists the ability to bring their work into the real world where it can be seen, held, and used. Not only that, 3D printing also brought digital tools to people outside of the typical 3D art community. Traditional sculptors, jewelry designers, makers, and backyard tinkerers understand the incredible amount of freedom and power that 3D printing brings to their work.
Of course, 3D artists aren't always used to working in real-world units and the constraints of meatspace materials (which may or may not, in fact, be made of meat). Likewise, for our non-digital counterparts, powerful 3D art tools such as Blender can prove to be daunting and unfamiliar territory. Hopefully, this two-part article can help bridge that gap.

Getting started

There's not enough room in this article to walk you through all of the basics of getting started with Blender. There are great video tutorials and books (shameless plug) out there that are more thorough and better suited for that particular task. However, assuming you know your way around Blender a little bit, there are a few setup tasks you should go through when starting a project meant for 3D printing.

Use real-world units

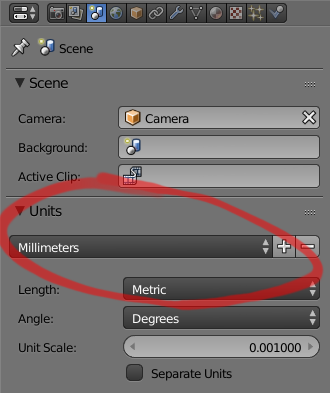
Your 3D model is destined for the real world. To that end, you need to use real-world units. By default, Blender doesn't use real-world units. Instead, it uses the nebulously sized Blender Unit. You change this value by going to the Units panel in Scene Settings. Most of the specifications for 3D printers (or commercial 3D printing services) are in metric units. For that reason, I recommend setting your units in Blender to use millimeters as a base.
Set your units to millimeters screenshot
Set your units to millimeters
Don't worry if you—ahem—happen to be in a part of the world that hasn't fully converted to the metric system. You can work in inches if you like. In fact, here's a little-known tip: Even if your base units are metric, you can still use notation for inches in your sizes. For example, if you type 1" or 1 in as the X dimension for the default cube, Blender will automatically convert that to 2.54cm for you if your base units are metric. The reverse is also true.
Blender can do imperial/metric conversions for you screenshot
Blender can do imperial/metric conversions for you.
If your primary purpose for using Blender is for 3D printing, you may want to save this as part of your default configuration (Shift + U or FileSave Startup File).

Create a boundary guide

Do you have a 3D printer of your own (or a generous buddy)? Are you going to use a commercial 3D printing service? In either case, knowing ahead of time where your 3D object is going to be printed and in what material is usually a good idea. This lets you know how much detail you can have and, more importantly, it lets you know the available volume you have to work within. Think about it like printing on paper: Are you working on a business card or a billboard? You want to know how much space you have available to work, and the amount of detail you can use in that space, and it's the same when printing in 3D.
If you know the specifications for your printer—or the place you're printing—you can use a cube as a simple guideline to show you how much space you have available. Let's say you're printing on an Ultimaker 2+. The specifications for the base model list the build volume as being 223mm x 223mm x 205mm.
Assuming you're working in Blender's default scene and you've already set it to use metric units, select the cube already in the scene in the 3D View. While still in the 3D View, go to the Properties region (you can toggle the region's visibility by pressing N). In the Transform panel, there are X, Y, and Z values under the label of Dimension. Enter the width, length, and height dimensions for those values. In our example, that would be 223mm, 223mm, and 205mm, respectively.
Set the dimensions for your reference cube screenshot
Set the dimensions for your reference cube
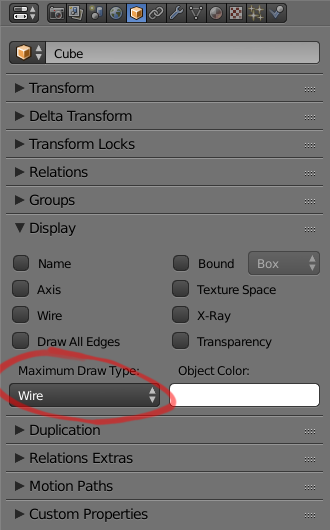
If you haven't adjusted the 3D View, it should appear that you're now inside the cube. Scroll your mouse wheel to zoom out far enough that you're back on the outside. Now, as nice as this cube is, it completely blocks your work area, so it's not great as a reference yet. Fortunately, you can fix that with a few small adjustments. First, go to Object Properties. At the bottom of the Display panel is a drop-down menu labeled Maximum Draw Type. By default, that's set to Textured. Change it to Wire. Now, regardless of what view mode you're using the 3D View, that cube will always show as a simple, unobtrusive wireframe.
Set the reference cube's draw type to Wire screenshot
Set the reference cube's draw type to Wire
There's one more nice little touch worth adding. While you're working on your 3D-printed object, you may accidentally select your reference cube. Worse, the change to the maximum draw type in the 3D View doesn't affect rendering. That means that if you do a test render to see what your finished object might look like, your reference cube is still there, visible as a solid cube, likely blocking your view. Fortunately, both of these little annoyances are easy to fix from the Outliner.
In the Outliner, find your reference cube. Again, assuming you're working from the default scene, it's probably named Cube. In fact, you should probably fix that. Double-click the cube's name and rename it to something that makes more sense, like reference_cube. (Lower case and underscore aren't necessary. Just an old habit of mine.)
Now, to fix those other issues, look to three icons on the far right of your reference cube's name. There's an eye, an arrow, and a camera. The eye icon controls visibility in the 3D View. You want to keep that enabled. The other two, however, control selectability in the 3D View and visibility during render. Disable both of those by left-clicking their icons. (Tip: You can do both in one go by left-clicking and dragging your mouse cursor over both. It's just like clicking each individually, but faster.)

Hide the camera, delete the light

This last little bit is just a personal preference of mine to try and de-clutter the work area a bit. Outside of possibly doing test renders to get a more realistic approximation of what your finished print looks like, you're not going to have a lot of use for the camera and lamp objects that are in the default scene. For the most part, they'll just be in your way. To that end, it's best to get them out of your way.
Now, you could just delete them both and let that be that. However, I like to keep the camera around just in case I do actually want to make a test render. So rather than delete the camera, I simply hide it from the 3D View. You can do that from the Outliner as described in the previous section, or you can select the camera object in the 3D View and press H to hide it. Then when you need it again, you can simply unhide it and put it in the best place to give you a nice render.
The lamp object, on the other hand, I would simply select and delete (X). I have a few of my own pre-built lighting rigs that I prefer over just a single point lamp. When I want those, I append them to the scene. Since this is for 3D printing, I'm not likely to be doing a lot of rendering anyway. Removing the light removes the temptation to waste time trying to make a pretty render.

On to making

Now you have a good base scene to start working on your 3D printing project. From here you can import another 3D model as a base or start working on a new one from scratch using Blender's excellent modeling and sculpting tools. The next part in this article will cover a few of the tools built into Blender that can help ensure you have the best results when you get to printing.

The safest way to remove old Kernels in Ubuntu

$
0
0
http://www.ostechnix.com/safest-way-remove-old-kernels-ubuntu

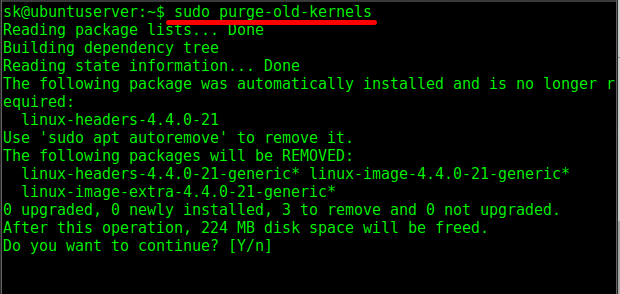
remove old kernels in ubuntu

Customized File Monitoring with Auditd

$
0
0
https://www.linux.com/learn/customized-file-monitoring-auditd

auditd
Learn how to customize auditd to monitor whatever you want.
In the previous article on auditd, I showed how to use aureport to check stuff monitored by the auditddaemon. And, I showed how you could, for example, check whether a user had experienced trouble logging in, which could be interpreted as a malicious attempt to access a system.
As I said before, aureport is part of a larger toolset that comes with auditd. Using auditdto monitor some preset events is already quite useful, but where it comes into its own is when you customize it to monitor whatever you want.

Customized Monitoring Rules

To push your rules into auditd on the fly you use auditctl. But, before you insert any of your own rules, let's check to see if any defaults are already in place. Become root (or use sudo) and try this:
auditctl -l
-a never,task
The -l option lists all current active rules and, if you see the -a never,task line shown above, none of the rules following it will log anything. This rule, which is often a default in new auditd installations, is telling the daemon to append (-a) a rule to the task list (as in the list of tasks the kernel is running -- don't worry about this just yet), which will stop auditd from ever recording anything.
Because we're not specifying which task, auditd assumes the rule applies to all of them. In plain English, this would read: "Never record anything from any of the tasks the kernel is running." And, because auditd gives precedence from top to bottom (i.e., the first rule takes precedence over the ones following it in case of a conflict), this means nothing will be recorded despite what any of the other rules say.
You don't want that, so the first thing to do is get rid of this rule. To delete all rules from a running auditd daemon, you can use:
auditctl -D
If you already have more than one rule and don't want to zap them all, you can also selectively delete only this rule with
auditctl -d never,task
Now the coast is clear, so I’ll show how to build your own first rule. The typical use for auditd is to have it monitor files or directories. For example: As a regular user, create a directory in your /home directory, say…
mkdir test_dir
Now become root and set up a watch on the directory you just made:
auditctl -w /home/[your_user_name]/test_dir/ -k test_watch
The -w option tells auditd to watch the test_dir/ directory for any changes. The -k option tells auditd to append the stringtest_watch(called a key) to the log entries it creates. The key can be anything you want, although it is a good idea to make it something memorable and related to what the rule does. As you will see, this will be useful to filter out unrelated records when you revise auditd's logs later on.
Now, as a regular user, do some stuff in test_dir/ -- make some subdirectories, create or copy some files, remove some files, or list the contents.
When you're done, take a look at what auditd logged with
ausearch -k test_watch
See the use of -k test_watch here? Even if you have a dozen more rules logging different things, by using a key string, you can tell ausearch to only list what you're interested in (Figure 1).

fig01_ausearch_output.png

ausearch output
Figure 1: Output of ausearch command.
Even with this filter, the amount of information ausearch throws at you is a bit overwhelming. However, you will also notice that the information is very structured. The output is actually made up of three records per event.
Each record contains some keyword/value pairs separated by a "=" sign; some of the values are strings, others are lists enclosed in parenthesis, and so on. You can read up on what each snippet of information means in the official manual, but the important thing to take away is that the structured nature of ausearch's output makes processing it using scripts relatively easy. In fact, aureport, the tool I showed in the previous article, does a very good job of sorting things out.
To prove it, let's pipe our ausearch output through aureport and see what's what:
ausearch -k test_watch | aureport -f -i

File Report
===============================================
# date time file syscall success exe auid event
===============================================
1. 05/06/16 13:04:54 sub_dir mkdir yes /usr/bin/mkdir paul 193
2. 05/06/16 13:04:54 /home/paul/test_dir/sub_dir getxattr no /usr/bin/baloo_file paul 194
3. 05/06/16 13:04:54 /home/paul/test_dir/sub_dir getxattr no /usr/bin/baloo_file paul 195
4. 05/06/16 13:04:54 /home/paul/test_dir/sub_dir getxattr no /usr/bin/baloo_file paul 196
5. 05/06/16 13:05:06 /home/paul/test_dir/testfile.txt getxattr no /usr/bin/baloo_file paul 198
.
.
.
This is starting to make sense! You can check who is doing what to which file and when.
One thing you can see in the listing above is that, because I am using the Plasma desktop, Baloo, KDE's indexing service, is cluttering the list with irrelevant results. That's because every time you create or destroy a file, Baloo has to come along and index the fact. This makes parsing what is going on and checking whether the user is up to no good, annoyingly hard. So, let's filter Baloo's actions out with a strategically placed grep:
ausearch -k test_watch | aureport -f -i | grep -v baloo

File Report
===============================================
# date time file syscall success exe auid event
===============================================
1. 05/06/16 13:04:54 sub_dir mkdir yes /usr/bin/mkdir paul 193
9. 05/06/16 13:05:06 testfile.txt open yes /usr/bin/touch paul 197
17. 05/06/16 13:05:29 ./be03316b71184fefba5cfbf59c21e6d5.jpg open yes /usr/bin/cp paul 210
18. 05/06/16 13:05:29 ./big_city.jpg open yes /usr/bin/cp paul 211
19. 05/06/16 13:05:29 ./blendertracking.jpg open yes /usr/bin/cp paul 212
20. 05/06/16 13:05:29 ./Cover27_Draft01.jpg open yes /usr/bin/cp paul 213
37. 05/06/16 13:05:50 blendertracking.jpg unlinkat yes /usr/bin/rm paul 330
38. 05/06/16 13:05:50 be03316b71184fefba5cfbf59c21e6d5.jpg unlinkat yes /usr/bin/rm paul 328
.
.
.
That's much better. You can now clearly see what the users have been up to. You can follow how they create some directories and files and copy others from elsewhere. You can also check what files are being removed, and so on.
When you have no more use for it, you can remove the above watch with
auditctl -W /home/[your_user]/test_dir/ -k test_watch

One File at a Time

Monitoring whole directories makes for a lot of logged data. Sometimes it is better to just monitor strategic individual files to make sure no one is tampering with them. A classic example is to use
auditctl -w /etc/passwd -p wa -k passwd_watch
to make sure nobody is messing with your passwd file.
The -p parameter tells auditd which permissions to monitor. The available permissions are:
  • r to monitor for read accesses to a file or a directory,
  • w to monitor for write accesses,
  • x to monitor for execute accesses,
  • and a to check for changes of the file's or directory's attributes.
Because there are legitimate reasons for an application to read from /etc/passwd, you're not going to monitor for that to avoid false positives. It is also a bit silly to monitor for the execution of a non-executable file; hence, we tell auditd to only monitor for changes to passwd's content (i.e., writes) and its attributes.
If you don't specify what permissions to monitor, auditd will assume it has to monitor all of them. That's why, when you were monitoring the test_dir/ directory in the first examples, even a simple ls command triggered auditd.

Permanent Rules

To make your rules permanent, you can include them into /etc/audit/audit.rulesor create a new rules file in the /etc/audit/rules.d/directory. If you have been experimenting with rules using auditctl and you are happy with your current set up, you could do:
echo "-D"> /etc/audit/rules.d/my.rules
auditctl -l >> /etc/audit/rules.d/my.rules
to dump your current rules into a rules file called my.rules and save yourself some typing. If you've been following this tutorial and used the example rules you saw above, my.rules would end up looking like this:
-D
-w /home/[your_user]/test_dir/ -k test_watch
-w /etc/passwd -p wa -k passwd_watch
To avoid interference and conflicts, move any pre-existing rules files in /etc/audit/ and /etc/audit/rules.dto backups:
mv /etc/audit/audit.rules /etc/audit/audit.rules.bak
mv /etc/audit/rules.d/audit.rules /etc/audit/rules.d/audit.rules.bak
Then, restart the daemon with
systemctl restart auditd.service
to have auditd pick up your rules straight away.
Now, every time your system is rebooted, auditd will start monitoring whatever you told it to.

There’s More

I had time to cover only a small portion of auditd’s capabilities here. But, as you can see, auditd is very powerful, and it can be used monitor much more than just files and directories, with an insane level of detail. I plan to visit the more advanced topics in a future article.

Modify/Edit/Re-pack ISO Files Using Mkisofs In Linux

$
0
0
http://linuxpitstop.com/edit-iso-files-using-mkisofs-in-linux

Mkisofs is a utility that creates an ISO 9660 image from files on disk. It is effectively a pre-mastering program to generate an ISO9660/JOLIET/HFS hybrid filesystem capable of generating the System Use Sharing Protocol records (SUSP) specified by the Rock Ridge Interchange Protocol. This is used to further describe the files in the iso9660 filesystem to a unix host, and provides information such as longer filenames, uid/gid, posix permissions, symbolic links, block and character devices. mkisofs takes a snapshot of a directory tree and generates a binary image that corresponds to an ISO9660 or HFS filesystem when it is written to a block device. Each specified pathspec describes the path of a directory tree to be copied into the ISO9660 filesystem; if multiple paths are specified, the files in all the paths are merged to form the image.
Now we will show you that how you can use this awesome command line utility to modify, edit and repack your ISO files in Linux.

Installing mkisofs

In order to install ‘mkisofs’ on your Linux server you can use below command to install it on your Debials or RHEL servers.
On Ubuntu:
# apt-get install mkisofs
On CentOS:
# yum install mkisofs
Using above command will install the ‘genisoimage’ and its required dependencies as shown in the image below.
installing mkisofs

Modify/Edit ISO image

By modifying the ISO image we can automatically partition the hard drives, install Linux, installed several add-on packages, created user accounts, and setup the networking.
First of all create a directory that will contain the modified image using below command.
# mkdir /tmp/centos_custom
In order to access and modify the contents of an ISO file, you can mount it as a device. Linux will treat it as a separate file system, and allow you to browse the files as you would normally browse the directory structure of your hard drive. The fastest way to mount an ISO image is via the command line.
Let’s Run the command below to mount the source ISO image locally to work on it.
 # cd /tmp/centos_custom/
 # mount -t iso9660 -o loop CentOS-7.0-1406-x86_64-DVD.iso /mnt/
Since the ISO is read-only we will need to copy the contents into another directory that we can modify and add what we want. Let’s extract the source ISO files into ‘/mnt’ directory using below commands and wait for while to complete the copy process.
# cd /mnt
# tar cf - . | (cd /tmp/centos_custom; tar xfp -)
extract source iso
Now you can place your custom files to the ISO tree. The ks.cfg file is what the install routine will use while loading the OS. If your custom config file was named like ‘ks-dev.cfg’, then when you boot off the CD, you will type something like the following command.
boot: linux text ks=cdrom:/ks-dev.cfg
Next, if you have additional packages that you want to install, you can copy them into the custom image directory. This way they will be included in the image when we create the new ISO. You can then put a postinstall script in place to install and configure those packages automatically at install time. As long as you do not exceed the capacity of a CD or DVD, then you can add as much as you want.

Repackage new ISO file

Once all of your modifications are complete, you just need to put it all together and create a new ISO image. After that run below command.
# /tmp/centos_custom
# mkisofs -o CentOS-7.0-1406-x86_64-DVD.iso -b isolinux/isolinux.bin -c isolinux/boot.cat -no-emul-boot -boot-load-size 4 -boot-info-table -J -R -V "CentOS 7.0 Custom ISO" .
This will takes a while to complete the process, after that you get the following completion notice containg the summary of used space and number of transaction.
creating new iso
You can use ‘mkisofs’ to create ISO images from any folder on your computer by using the follwoing command in your command line terminal.
# mkisofs -o kash.iso /home/kash/k_iso
The ‘-o’ switch lets you choose the name for your image like we used ‘kash.iso’, then specify the location where you want to store your iso image.
Once you’ve created an ISO image using command line tools, you can simply make it into a CD or DVD with your favorite burning application.
This ‘mkisofs’utility has a ton of option, you can get the list of its all available options using below command.
# mkisofs --help
mkisofs help

Conclusion

In this session we showed the commands which could be used to Modify,Edit or create an ISO9660 image with your custom scripts or packages in it. You can also use this to create your new home directory and send that image file to a share on a Windows computer for CD creation. Let’s get started with mkisofs and explore it more features to play with iso files. I hope you find this article much helpful, let’s share it with your friends and do not forget to share your comments and thoughts on it.

14 Practical examples of the rsync command

$
0
0
http://www.librebyte.net/en/gnulinux/14-practical-examples-of-the-rsync-command

Introduction

rsync
Rsync is a fast and versatile file synchronization tool that allows to copy and sync files locally and from rsync service or any device that supports remote shell (Rsync does not support synchronization between remote devices). Rsync offers a large number of options that control every aspect of its behaviour and permit very flexible specification of the set of files to be copied.
Rsync implements a very efficient transfer algorithm based on deltas which reduces the amount of data sent over the network due it sends only the differences between the source and the destination file.
Rsync is widely used for backups and mirroring.
Rsync finds the files that need to be transferred using a quick check algorithm (by default), looking for files that have changed in size or in last modified date.
Other features:
+ Allows you to copy links, devices (In GNU/Linux all devices are identified as special file under /dev DIR), owner, group and permissions
+ Exclude and exclude-from options similar to GNU tar
+ Exclude files in CVS style
+ Can use any transparent remote shell, including ssh or rsh
+ Does not require super privileges
+ Support pipelining to minimize transfer time
+ Supports anonymous authentication via rsync service (ideal for mirroring and backup)
Rsync can access the remote host using a remote shell mechanism or contacting directly the rsync service via TCP. If the source or destination contains a colon (:) after the host name then the remote shell will be used as the transport mechanism. If the source or destination contains a double colon (::) after the host name or if the Rsync protocol (rsync://) is used then Rsync will contact the rsync service directly.
If you only specify the origin Rsync will be similar to ls -l.
If both the origin and the destination are local paths then Rsync behaves like an improved copy (cp) command.

Synopsis

$ rsync [OPCIONES] SRC [DEST]
SRC and DEST can have this format:
user@host:path
if you do not specify user then Rsync will use the current user.

Examples

1. Transfer/Sync using wildcards

Transfer/Sync all files from the current DIR that match *.c pattern to the src DIR (relative to $HOME for current user) of the helios host. If some of the files to be transferred exists in the remote DIR then Rsync only sends the differences. The modification date is preserved.
$ rsync -t *.c helios:src/

2. Transfer/Sync in archive mode

Transfer/Sync all files from the src/bar DIR (relative to $HOME for current user) of the helios host to the local DIR: /data/tmp.
$ rsync -avz helios:src/bar /data/tmp
The option -a is a shortcut to:
  • -r: recursive transfer
  • -l: transfer/copy symlinks
  • -p: preserves permissions
  • -t: preserves the modification date of the file
  • -g: preserves the group that owns the file
  • -o: preserves the owner to which the file belongs
  • -D: transfer/copy devices and special files (for the root user only)

3. Transfer/Sync content under a DIR

If you specify a / at the end of src/bar instead of creating the DIR bar under /data/tmp the files (and dirs) under bar is copied. A slash at the end of the origin can be interpreted as "copy the contents of this directory" instead of "copy this directory"
$ rsync -avz helios:src/bar/ /data/tmp

4. Transfer/Sync certain files

Specify several files at the same time. Copy the files: fich1, fich2, fich3 and fich4 from helios to the local DIR /dest. All commands specified below are equivalent.
$ rsync -av helios:fich1 :fich2 :fich3 :fich4 /dest/
$ rsync - av helios:fich1 helios:fich2 helios:fich3 helios:fich4 /dest/
$ rsync - av helios:fich1 :fich2 helios:fich{3,4} /dest/
$ rsync - av helios:fich{1,2,3,4} /dest/

5. Transfer/Sync files with white spaces

To copy a file that contains white spaces, use the argument --protect-args (-s)
$ rsync -avs helios:'I am a fich with white space.txt' /dest/

6. Disable an option

To disable a particular option which is implicitly active in a previous option we prefix it a no, if in the example 2 we would like that the owner of the file is the user who receives the files on the destination server then execute.
$ rsync -avz --no-o root@helios:/root/src/bar /data/tmp
If you omit --no-o then all files copied under /data/tmp will be owned by root while if you specify it then all files will be owned by the current user.

7. Set specific permissions on files to transfer

To set specific permissions use the option --chmod for example if we want the following settings:
– Do not preserve the sticky bit for the owner and group
– Group has read and execute perms on DIR
– Group has read perm on the FICH
– World does not have any permissions on DIR and FICH
We execute
$ rsync -avz -chmod=ug-s,Dg=rx,Fg=r,o-rwx helios:src/bar /data/tmp

8. Mapping the owner and group to a specific user and group

$ rsync -avz --chown=root:librebyte /data/tmp helios:src/bar
The above command sets as owner root and group librebyte to the files sent to the remote server.
If the user who receives the files does not have permissions to change the owner and group then rsync will issue an error message.
The user and group that receives must exist or rsync throws an error message.
For greater control over user and group mapping use the options --usermap and --groupmap respectively. Do not use previous options together with --chown.

9. Using relative paths

Means that the specified path is completely sent to the remote server instead of the last part of the file name for example:
$ rsync -av /foo/bar/baz.c helios:/tmp/
The above command creates the file baz.c under the DIR tmp in the helios server while
$ rsync -avR /foo/bar/baz.c helios:/tmp/
creates the file /foo/bar/baz.c under the DIR tmp. As you will see the above command includes the option -R which specifies the use of relative paths, this option has its equivalent in the long form: --relative.
If you want to send only a part of the path then insert a ./, for example the following command will create the file /tmp/bar/baz.c note that DIR foo will be not created on the target.
$ rsync - avR /foo/./bar/baz.c helios:/tmp/ 

10. Backup

You can make backups by using the --backup option.
$ rsync -avz --delete --backup conf helios:conf
The above command only keeps 2 versions of files (the original and a copy) if you want to keep multiple copies then you must use the options --suffix and --backup-dir, for example the following command keeps several backup on “backup” DIR, the –suffix option adds to the name of the file the date in which the backup is made.
$ rsync - avz --delete --backup  --backup-dir =../backup --suffix=_ $(date +%Y-%m-%d.%H.%M) conf/ helios:conf/
The “backup” DIR will be created in the parent of conf DIR (it is possible to specify an absolute path).

11. Partial copies

If the connection is interrupted Rsync (by default) will eliminate any partial transfer, to change this behavior, use the options --partial or --partial-dir, it is recommended to use --partial-dir instead of --partial. Rsync will begin from where it was at the time that the connection was interrupted. Rsync will create/delete automatically the DIR specified by --partial-dir.
$ rsync -avz --partial-dir=../tmp-partial documents/ helios:mydoc
The tmp-partial DIR is created under mydoc DIR of the helios server (it is possible to specify an absolute path),--partial-dir has different behavior than --backup-dir option regarding the place where the specified DIR will be created if relative paths are established in both.

12. Transferring ACLs and extended attributes

-A and -X allow to synchronize extended attributes and ACLs (access control list) respectively. Keep in mind that the destination file system must support both options and be compatible with the source file system.
$ rsync -aAXvz ~/documents/ helios:~/documents/

13. Deleting extraneous files

The option --delete allows you to delete the files found in the destination but are not in the origin, this option is useful for mirroring. For example if we would like to mirror our websites:
$ rsync -avz --delete /var/www helios:/var/www

14. Filters

Rsync can include, exclude files to sync/transfer using the options:
*--cvs-exclude: is a shortcut to exclude files that usually are not synchronized or transferred (*.old *.bak *.BAK *.orig *.re j.of-* *.olb *.obj *.so *.exe *.o *.a *.Z *.elc *.ln core .svn / .git/ .hg/ .bzr/…).
*--exclude = PATTERN: exclude files that match with PATTERN.
*--exclude-from = FICH: read exclude patterns from FILE. Each pattern must be on a separate line, the lines that start with # or ; are considered comments.
*--include = PATTERN: don’t exclude files matching PATTERN.
*--include-from = FICH: read include patterns from FILE. Each pattern must be on a separate line, the lines that start with # or; they are considered to be comments.
*--files-from = FICH: allows you to specify an exact list of files to transfer, useful if you only want to transfer at the same time some FICH from different DIR.
*--filter= RULE : this is the most advanced, complex and flexible option. The above options are simplifications of --filter.
Some examples:
Exclude common files
$ rsync - avz --cvs-exclude documents/ helios:doc
It is possible to exclude specific files by creating a .cvsignore file under the DIR that you want to transfer also if you create a .cvsignore file under $HOME both rules will be mixed, .cvsignore patterns must be separated by a whitespace, and not by a line break. We have the following structure.
documents/Notes /
├── .git
│ ├── branches
│ ├── hooks
│ ├── info
│ ├── logs
│ ├── objects
│ └── refs
├── .gitignore
├── Internet
├── MultiMedia
├── Security
│ └── adminstradores_de_contrasenas
├── SO_Tipos_UNIX
│ └── Debian_-_Ubuntu
├── VIM
└── .zim
And we want to exclude the .gitignore and.zim DIR then we create .cvsignore file under Notes DIR with the following patterns:
.cvsignore .gitignore .zim
If we want to exclude all the hidden files it is enough to specify the following pattern
.*
Using –exclude and –exclude-from
We can obtain the same result before using the options –exclude and/or –exclude-from
$ rsync -avz --exclude='.zim'; --exclude='.git' --exclude-from='documents/exclude-list.txt'  documents helios:doc
The file exclude-list.txt:
*.exe
*.old
*.bak
*.BAK
*.orig
exclude-list.txt

Recommended reading

  • man rsync

Neofetch – Display your Linux system’s information

$
0
0
http://www.ostechnix.com/neofetch-display-linux-systems-information

neofetch
Hi guys! How are you doing? Today, I have come up with an interesting utility that displays the Linux distribution’s information in Terminal. Meet Neofetch, a simple, yet useful script that gathers information about your system and displays them in the Terminal, with an ascii image or your distribution’s logo, or any image of your choice right next to the output. You can customize which information is displayed, where it is displayed and when it is displayed. It supports Linux, BSD, Mac OS X, iOS, and Windows operating systems.
In this brief tutorial, Let us see how to display the Linux system’s information using Neofetch.

Install Neofetch

In Arch Linux:

Neofetch is available in AUR. So you can install it either using packer or yaourt. To install packer or yaourt, check the following links.
After installing packer or Yaourt, enter the following command to install Neofetch from the Terminal:
Using packer:
packer -S neofetch
Or,
packer -S neofetch-git
Using Yaourt:
yaourt -S neofetch
Or,
yaourt -S neofetch-git
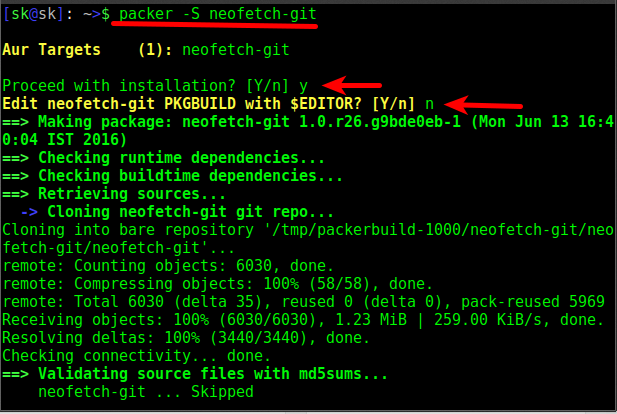
Sample output:
Press “y” when the installer asks to proceed with installation, and press ‘n’ when it asks you to edit neofetch PKGBUILD.
Deepin Terminal_002

In Ubuntu:

Add the following repository:
sudo add-apt-repository ppa:dawidd0811/neofetch
Update sources list:
sudo apt-get update
And, install Neofetch using command:
sudo apt-get install neofetch

In Debian:

Add third party neofetch repository:
echo "deb http://dl.bintray.com/dawidd6/neofetch jessie main" | sudo tee -a /etc/apt/sources.list
Add public key using command:
curl -L "https://bintray.com/user/downloadSubjectPublicKey?username=bintray" -o Release-neofetch.key && sudo apt-key add Release-neofetch.key && rm Release-neofetch.key
Update the sources list:
sudo apt-get update
Finally, install Neofetch using command:
sudo apt-get neofetch

In Fedora / CentOS / RHEL / Scientific Linux:

Install dnf-plugins-core first:
sudo dnf install dnf-plugins-core
Add and enable COPR repository that contains the Neofetch package.
sudo dnf copr enable konimex/neofetch
Then, install neofetch using command:
sudo dnf install neofetch

Neofetch basic usage

Neofetch is pretty easy and straightforward. Let us see some examples.
Open up your Terminal, and run the following command:
neofetch
Sample output:
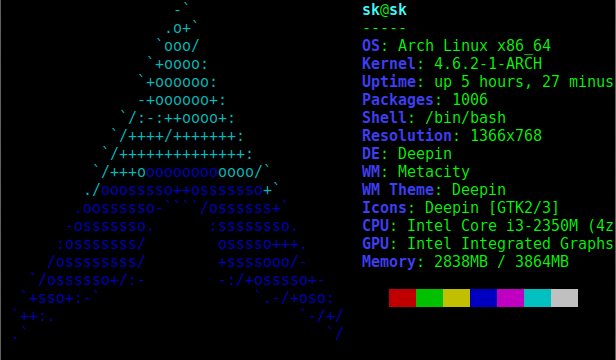
Deepin Terminal_003
As you in the above output, neofetch has displayed the following details about my Arch Linux system.
  • Name of operating system that I use
  • Kernel details
  • Shell details
  • Uptime
  • RAM size
  • List of installed packages
  • CPU information
  • GPU details
  • Display resolution
  • Desktop environment
  • Window manager
  • Theme details
Also, You can even take the screenshot of the above output and save it to the location of your choice. To do so, make sure you have installed ‘scrot’ tool.
In Arch Linux:
sudo pacman -S scrot
In Ubuntu and other DEB based systems:
sudo apt-get install scrot
In Fedora and other RPM distros:
sudo dnf install scrot
For example, I want to take the screenhsot of my system details generated by Neofetch, and save it in my home folder.
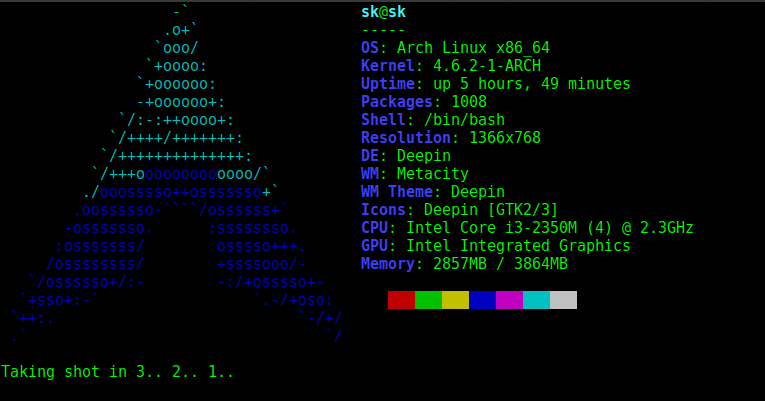
neofetch --scrot /home/sk/ostechnix.png
Sample output:
neofetch
As you see, the above command will take a screenshot of Neofetch’s output and save it in the /home/sk/ location. You can change the location of your choice.
Neofetch has plenty of other options too. You can sort the result only with OS details, or Up time.
To view all available options in Neofetch, run:
neofetch --help
Deepin Terminal_005
As far as I tested Neofetch, It worked perfectly in my Arch Linux system as I expected. It is a nice tool to easily and quickly the details of your system in few seconds. Give it a try you’ll find it useful.
That’s all for now. If you like this tutorial, please share it on your social networks and support OSTechNix.
Cheers!
Reference links:

An introduction to basic motion detection on Linux

$
0
0
https://www.howtoforge.com/tutorial/motion-detection-on-linux

Setting up a motion detection system on Linux is fairly easy and simple. All that we need is a webcam (or laptop), the “motion” package, and a few minutes to set everything up. The purpose for doing this may be private space surveillance, enhancement of personal security, or simply a fun project. Whatever the case, this quick guide is not intended to promote illegal activities such as unauthorized video recording of people and their activities. That said, please use the knowledge offered here with ethical conduct.

Setting Up Motion

The first thing that we need to do is to install the “motion” package. Given that you're using Ubuntu, this is done by opening a terminal and typing:
sudo apt-get install motion
After that, we can launch motion by opening a terminal and typing:
sudo motion
This will initiate motion detection with the default settings, and your webcam will start taking pictures and storing them in the designated location.
To set up motion, you will have to locate and edit motion's configuration file. This can be done by opening a terminal and typing “sudo nano /etc/motion/motion.conf ” or by opening a file manager session as the administrator (“sudo nautilus”), navigating to /etc/motion and opening motion.conf with a text editor. For example, you may change the size of the captured images as the default size is quite small (320x240), or change the trigger threshold. As I found the latter to be very sensitive, I figured out that I should change it by commending out the corresponding rows and changing the numerical value accordingly (raise it). If you want motion to be more sensitive to pixel changes, you may lower this value as needed.
Motion detection with - motion.
Now if the capturing generates too many images, you can set the framerate (located below the width/height settings) at a lower setting. This will tell motion how many times per second it is allowed to capture an image. Alternatively, you may use the minimum frame time to set a minimum time period (in seconds) between captures. The following screenshot shows the problem, as one single movement of my hand in front of the camera generated about 45 images.
Image capturing with motion.
If you don't need that many pictures generated by motion, you can set the utility to either capture only the first image that matches the trigger threshold, the one that has the biggest motion change, or the one where the action happens in the center of the capturing frame. You may enable any of these by navigating to the “Image File Output” section in the configuration file and replacing the word “on” after output_normal with the words “first”, “best”, or “center”.
Configuring motion.
From the same option, you can change to video mode by adding the “off” parameter after “output_normal”. The prerequisite for this to work is that you have “ffmpeg” installed in your system. If you have the popular tool install, you can even set up a camera capture a timelapse video, or even broadcast video live thanks to motion's in-built webserver (set options for this from the “Live Webcam Server” section).
Change video mode in motion - step 1.
Change video mode in motion - step 2.
Now, let's suppose that we want to make motion start with our system by default. This is easily done by opening a file manager session as the admin user, navigating to /etc/default and opening the file named “motion”. There, change the daemon setting by replacing “no” with “yes” and save the file.
Saved files.

Considerations

  1. If motion is not set up carefully and it captures too many images/videos at a high quality, it can quickly flood your storage devices or even servers in the case that it is set up to send the captured data online.
  2. If you want to use motion for security purposes, be sure to utilize something better than a webcam, as the low quality of webcams are bound to cause many false triggers.
  3. Some options offered by motion like the brightness auto-adjustment can be helpful when you're using a poorly featured camera.
  4. There's a fine line between frame rate and video/image quality and then bandwidth (if you care for it). Consider it before setting up motion, and take into account your camera's relevant capabilities as well.
  5. Multiple cameras must be assigned multiple dedicated configuration files, in addition to the standard motion.conf file which will only be limited to setting up the daemon and storage file paths. The default configuration file is only adequate when using a single image/video capturing device.

Conclusion

Motion may be lightweight and simple to get started with, but if you browse the configurations file carefully, you'll see that there are tons of different options that you may fiddle with. Motion can be added to the start up list so that it starts capturing with the computer power-up, it can be set to add the captures on an online database, work with multiple cameras, beep on activation, or even send notifications to your phone in the form of SMS or email as Motion can also execute custom external commands. If you want to do something specific with it, you may have to change the options multiple times before you end up having the results that you desire, but Motion is certainly worth your time and attention as it is very capable of doing almost everything if set up correctly.

Restore Critical Services Automagically With Monit

$
0
0
http://www.linux-server-security.com/linux_servers_howtos/linux_monitor_services_monit.html

When you work with computers things don’t always go quite as expected.
Imagine that your developers have spent months developing a new groundbreaking application, frequently battling against late nights, stressed out bosses and unrealistic targets.
As the battle-hardened Sysadmin you’ve done your job beautifully. The servers that you finished configuring some time ago have had shakedowns and smoke tests and by all accounts look pretty robust. You’ve got N+1 rattling around every nook and cranny of your network and server infrastructure and you’ve been all ready for the launch for over a month.
And, days before the launch, as the antepenultimate software deployment is pushed out onto the servers by the developers, you are faced with a very unwelcome horror. In the first instance the finger instance is pointed squarely at you. Why are your servers failing? Who specified them? Who said that they would be able to cope with demand? There aren’t even any customers using the service yet and your servers can’t deal with the load, what have you misconfigured?
After two minutes of stress and self doubt you realise that thankfully neither the hardware or your system config are creaking at the seams in any way shape or form. Instead there’s a serious application fault, the logs are full of errors, due to the developers’ coding. After gently exercising some of your persuasion techniques (who said soft skills aren’t important for Syadmins?) the coders concede that it’s their problem.
Sadly this doesn’t help much however since T-10 is imminent. You can hack together a shell script to act as a watchdog and refresh the application if an error is detected but there’s not much time to get that properly tested because there’s still a few other small jobs for you to complete too.
Step forward the mighty “Monit” (https://mmonit.com/monit/). By using Monit we can quickly get sophisticated watchdog-style functionality configured for our precious services and with lots of bells and whistles in addition. The Monit website even boasts that it’ll only take you fifteen minutes to get up and running.
Monit cleverly covers a few key areas. It can restart a service if it fails to respond and alert you that it has done so. This also means you can monitor against resource hogs or attacks. Monit refers to these scenarios as error conditions.
As you’d expect just like a faithful watchdog Monit also enjoys service checks, launched from the standard startup directories, such as “/etc/init.d”. Additionally however the magical Monit can also keep its eagle eyes on filesystems, directories and files. The key criteria for these monitored checks being the likes of timestamps changing, checksums or file sizes altering. Monit suggests that for security purposes you could keep an eye on “md5” or “sha1” checksums of those files which should never change and trigger an alarm if they do. Clever, huh? An automated file and directory integrity checker is readily available with little effort, along the lines of packages like Tripwire or AIDE (Advanced Intrusion Detection Environment).
That’s all quite localhost-orientated but you can also keep an eye on outbound network connections to specific remote hosts. The usual suspects, TCP, UDP and Unix Domain Sockets, are supported. You can also check against the more popular protocols such as HTTP and SMTP and custom craft your own rules to send any data and patiently wait for a response if it’s not a popular protocol.
Monit is pleased to also offer the ability to capture the exit codes of scripts and programs and react if they return an unwelcome code. And last but not least Monit can track your system’s CPU, Memory and Load without breaking a sweat.
In this article we’ll look at how Monit can help you to solve your system problems. Freeing up your night times for something that all Sysadmin’s love, sleep.

   Chiwawa


For such a diminutive little program there’s little doubt that Monit barks loudly with its feature-filled function list. Apparently the tiny footprint of an install is a remarkable 500kB.
Let’s get our hands dirtier and look at some of Monit’s features in action. There’s a nice install section in the FAQ which asks you to check if your system is supported before proceeding. There’s quite a list of systems on that page (https://mmonit.com/wiki/MMonit/SupportedPlatforms) including Linux (x86/x64/ARM), Mac OS X Leopard, FreeBSD 8.x or later, Solaris 11 and OpenBSD 5.5. Essentially POSIX (Portable Operating System Interface) compliant systems by all accounts.
If you’re using Debbie and Ian’s favourite distribution then you might be shocked to learn that you can install Monit as so:
# apt-get install monit
Our main config file, which we’ll look at in a little while, lives here: “/etc/monit/monitrc” (you might find it living at “/etc/monit.d/monitrc” on Red Hat derivatives). If you don’t use a single config file then you can split up your configs and place them in the “/etc/monit/conf.d/” directory instead. That may make sense if you’re juggling loads of complex configurations for many services. The Configuration Management tool, Puppet (https://puppetlabs.com/), does exactly this with its manifests for example to aid clarity. First things first however.
Why don’t we just dive straight in and look at some use cases? Sometimes it’s the easiest way to learn things; by getting a feel for a package’s preferred syntax. Monitoring the localhost’s system is probably a good place to start.
Monit gives us this (slightly amended) suggestion from its helpful website, which is brimming with examples incidentally, as shown in Listing One with comments to prevent eye-strain.
# Keep a beady eye on system functions
check system $HOST
    if loadavg (5min) > 3 then alert
    if loadavg (15min) > 1 then alert
    if memory usage > 80% for 4 cycles then alert
    if swap usage > 20% for 4 cycles then alert
    # Test the user part of CPU usage
    if cpu usage (user) > 80% for 2 cycles then alert
    # Test the system part of CPU usage
    if cpu usage (system) > 20% for 2 cycles then alert
    # Test the i/o wait part of CPU usage
    if cpu usage (wait) > 80% for 2 cycles then alert
    # Test CPU usage including user, system and wait
    # (CPU can be > 100% on multi-core systems)
    if cpu usage > 200% for 4 cycles then alert
Listing One: How to monitor our system functions with the malleable Monit
In order to break down Listing One let’s start from the top. Clearly the “$HOST” variable is already defined and refers to the host which Monit is running on. We run through load, RAM and swap space checks initially.
Then we move onto a set of comprehensive tests used to look out for “user”, “system” and “wait” measurements. These are finished off with overall system load and a reminder that it’s quite possible these days to run CPU load up past 100% on multi-core systems.
Let’s have a peek at the monitoring config for the world’s most popular (but legendary for being insecure) Domain Name Server software, BIND (Berkeley Internet Name Domain). The example that Monit offers is BIND running in a chroot for security reasons; as we can see in Listing Two.
check process named with pidfile /var/named/chroot/var/run/named/named.pid
   start program = "/etc/init.d/named start"
   stop program = "/etc/init.d/named stop"
   if failed host 127.0.0.1 port 53 type tcp protocol dns then alert
   if failed host 127.0.0.1 port 53 type udp protocol dns then alert
Listing Two: Monit keeping an eye on your DNS Server, BIND which is running in a chroot
The main thing that I love about Monit is the logical language which it uses for its config (combined with the numerous working examples offered to make learning so much quicker). As we can see in Listing Two you can check against a Process ID file (using the top line, which begins the hierarchy for the commands under that) and then simply offer its start and stop commands underneath. Further down let’s look at the very simple conditional statements used after that. The bottom two lines achieve the same thing but refer to TCP port and UDP port instances of BIND. We’ll examine the last line in a little more detail, not that it’s unclear already:
if failed host 127.0.0.1 port 53 type udp protocol dns then alert
We can listen to open ports on our local server (127.0.0.1) and quickly specify the action to take if it’s not working, i.e. trigger an “alert”. Look at a slightly different variant using the OpenSSH Server:
if failed port 22 protocol ssh then restart
As you can see the action is to restart the services and there’s no explicit mention of “localhost” (127.0.0.1).

   Bernersly


When monitoring port 80 and the all-pervasive “httpd” you are encouraged to create an empty file in your webspace which Monit can specifically check against. This cuts down on resources and there’s also a natty config setting on the Monit website to ignore these HTTP requests so that your logs don’t fill up. Let’s look at this now.
Assuming that you’re using Apache you can add these lines to the “httpd.conf” file in the logging section:
SetEnvIf        Request_URI "^\/monit\/file$" dontlog
CustomLog    logs/access.log common env=!dontlog
Again for use within the Monit config file you could use something along the lines of this example as seen in Listing Three (the guts of which are again available on the excellent Monit site):
check process apache with pidfile /opt/apache_misc/logs/httpd.pid
   group www
   start program = "/etc/init.d/apache start"
   stop  program = "/etc/init.d/apache stop"
   if failed host localhost port 80
        protocol HTTP request "/~binnie/monit/file" then restart
   if failed host 192.168.1.1 port 443 type TCPSSL
        certmd5 12-34-56-78-90-AB-CD-EF-12-34-56-78-90-AB-CD-EF
        protocol HTTP request http://localhost/~binnie/monit/file  then restart
   depends on apache_bin
   depends on apache_rc
Listing Three: Our Apache config for Monit which checks against an empty file and our SSL certificate’s “md5” checksum
Listing Three should hopefully make some sense now too. You can see the slight indent of the lines which follow after the “check process” line and any related config living underneath its umbrella.
The next lines start and stop the service. If you were using systemd then obviously you would replace those commands to something like this: “systemctl start apache.service”.
Getting slightly more sophisticated have a  look at this nice piece of command formatting. To my admittedly addled brain the language reads just like English:
check file syslogd_file with path /var/log/syslog
   if timestamp > 31 minutes then alert
Using the superb tool that is Monit we’re able to follow a specific file closely and check its timestamp. The site again gives us this excellent example. It’s more useful than you might think as examples go because it refers to a Syslog file. Syslog allows to you add a comment of sorts or a “-- MARK --” so that even when there’s no logs to add to your Syslog logfile you can tell that the ever-important logging daemon is still working correctly. Clearly adding a “-- MARK” will also boost the timestamp of that file too, which is what Monit is looking out for.
To achieve this, if you’re using the “rsyslog” daemon, you would need to open up the “/etc/rsyslog.conf” file. Then simply uncomment the line “#$ModLoad immark” to enable the “-- MARK --” functionality. Finally, preceding a quick “service rsyslog restart” or similar, inside that config file you set up how often the “-- MARK --” lines were written to the log as so:
$MarkMessagePeriod  1200
In our example the “-- MARK --” messages appear three times an hour as a result of the above entry.

   This is a Raid!


Another approach is monitoring the contents of specific files and using the “match” operator. Look at this example which deals with the monitoring of software RAID:
check file raid with path /proc/mdstat
   if match "\[.*_.*\]" then alert
In this case we’re inspecting what’s going on inside the “/proc/mdstat” file, which resides on the pseudo filesystem “/proc”, and hoping to match a specific expression.
Also, consider the syntax which follows below. We mentioned checking for exit codes as if you were shell scripting. Thankfully it’s much lighter work with Monit, again for checking that your software RAID is working via Nagios (https://www.nagios.org/), another popular monitoring tool which uses plugins:
check program raid with path "/usr/lib/nagios/plugins/check_raid"
   if status != 0 then alert
If we wanted to send out an alert when a file didn’t return the standard success code, “0”, then once more you could use the above “alert” syntax.
Let’s examine a slightly different approach for a single service now. How about if you’re worried that a particular file’s functionality gets broken for some reason and you need to check against its permissions?
Again starting to declare our config with the line containing “check”, and indenting the other lines underneath, you could do something like this for a Mail Server binary:
check file exim_bin with path /usr/sbin/exim
   group mail
   if failed checksum then unmonitor
   if failed permission 4755 then unmonitor
   if failed uid root then unmonitor
   if failed gid root then unmonitor
If the file’s checksum fails or permissions are screwy (including User ID and Group ID checks) then here if any of these fail their check Monit will no longer monitor them.
If you want to reference further back into your previously defined config then you’ll see why the above example from the comprehensive Wiki which declares the “check file” config should be referred to as “exim_bin”.
Look at this example of the “depends” in Listing Four. We can see how dependencies work in Monit, it’s intuitive I’m sure that you’ll agree.
check process policyd with pidfile /var/run/policyd.pid
   group mail
   start program = "/etc/init.d/policyd start"
   stop  program = "/etc/init.d/policyd stop"
   if failed port 10031 protocol postfix-policy then restart
   depends on policyd_bin
   depends on policyd_rc
   depends on cleanup_bin
Listing Four: Showing off how dependencies work with the magical Monit
Incidentally when “unmonitor” is triggered from within its config then Monit will also ignore and disable its monitoring for any dependencies which are picked up as “depends”.
You can additionally use config syntax such as this:
if failed host mail.binnie.tld port 993 type tcpssl sslauto protocol imap for 3 cycles then restart
If you imagine that you’ve had a few problems with your inbound mail daemon and need to check against any unusual behaviour then you can also check for errors within a select time period as above within three iterations.

   Mothership


You will want to chuck a few basic config commands into the main config file, namely “/etc/monit/monitrc” (a reminder it’s probably in a different location on Red Hat derivatives, please see above, near the introduction).
Now that we’ve explored the trickiest aspects of our config the rest is relatively straightforward. You will want to uncomment or explicitly change these settings in accordance with how your config file looks by default (version and distribution dependent). Look first at how to get Monit to run every three minutes:
set daemon 180
Also from within the config file you can get Monit to communicate with your Syslog server to and write logs to a sensible, central place, as so:
set logfile syslog facility log_daemon
You’ll almost certainly want to receive e-mails too and in which case you can use these lines:
set mail-format { from: alerts@binnie.tld }
set alert chris@binnie.tld
Clearly we’re configuring the “from” line in the e-mail with the first line, also known as the “sender address” in less technical circles. Two guesses what the second line does. Correct, that’s who receives the alerts.
You might optionally want to tell Monit which Mail Server to use with this following config entry for the host which Monit is running on if an SMTP service is present:
mailserver localhost
Or equally you could choose a remote Mail Server as follows:
mailserver smtp.binnie.tld
The well-considered Monit also lets us reformat the e-mails to our heart’s content. Have a look at the next section in Listing Five.
mail-format {
   from: alerts@binnie.tld
   subject: $SERVICE $EVENT at $DATE
   message: Monit $ACTION $SERVICE at $DATE on $HOST,
$HOST is having issues with its $SERVICE service.
}
Listing Five: Thanks to Monit’s flexibility we can alter how the e-mails are formatted to less offend our sensibilities

   In A Nuts Shell


If command lines are driving you nuts then you can also check out what Monit is doing through its nicely-constructed Web interface. The config file can be adjusted as follows to enable the interface:
set httpd port 3333 and
use address www.binnie.tld
This useful graphical aid can be served over either HTTP or HTTPS. You can see these adjustable settings here which would live under the “set httpd” line:
ssl enable
pemfile /usr/local/etc/monit.pem
Much more information on SSL and its options can be found here: https://mmonit.com/wiki/Monit/EnableSSLInMonit
In Figure One we can see an example of the built-in Web interface which is amongst a number of interesting screenshots from Monit’s website.


Figure One: The Web interface which the excellent Monit comes with, as found on its website here: https://mmonit.com/monit/©2001-2015 Tildeslash Ltd
There’s also some interactive functionality built into the GUI as you’d expect. Using the power of point-and-click you can stop monitoring your services and also check them manually, also known as validating a service.
The gift that keeps on giving, you can go one step further and produce some highly functional graphs using something called “Monit Graph”. Here’s a nice post offering you the config that you need to apparently get it working (be warned that this site was showing a DB error at times): http://dreamconception.com/tech/measure-your-server-performance-with-monit-and-monit-graph/
Figure Two: Monit can make pretty graphs too using Monit Graph, as found at http://dreamconception.com/tech/measure-your-server-performance-with-monit-and-monit-graph/© 2014 Dream Conception L.L.C
The website including the post which helps you get Monit Graph working dutifully points you to its GitHub page here:https://github.com/danschultzer/monit-graph
WIth a quick juggle of a “cron job”, making sure that PHP is present (and using “HTaccess” to protect the directory with a password if need be) you can be up and running very quickly apparently.
The features included with Monit Graph according to its GitHub page include:
  • Easy to manage and customize
  • Several different graphs (Google Charts) of memory, cpu, swap and alert activity
  • Data logging with XML files
  • Chunk rotation and size limitation
  • Multiple server setup
If you need shiny graphs to compliment your command line output, and let’s not forget that you can easily combine them with the highly functional Web interface, then Monit Graph is definitely for you. Figure Three shows you other functionality that the graphing is capable of.
Figure Three: A useful dashboard style summary from Monit Graph, found at https://github.com/danschultzer/monit-graph © 2014 Dream Conception L.L.C

   Keep In Touch


There’s a choice of Mailing lists to keep abreast of developments with Monit. There’s a general mailing list which can be found here:
Archives of which are located here: http://lists.nongnu.org/archive/html/monit-general/
Additionally there’s a useful list which deals with announcements:

   Smarty Pants


Just when you thought that there couldn’t possibly be more to this fantastic suite of monitoring tools, here’s another.
M/Monit (https://mmonit.com/) is another good-looking, highly functional product from the same company, Tildeslash Ltd, which acts as a centralised control panel of sorts.
Once you have Monit running on your individual boxes (using version 5.2 or higher) then you can then introduce a simpler way for keeping track of them all. If you’d like to check up on your systems from a smartphone then look no further. It also has a mobile version which supports iOS and Android phones.
It is funded for with a non-expiring “perpetual” licence or in other words a licence which just needs paid once. There are also paid-for support options which can be chosen as one-offs too if the need arises. The cost of owning such licences are relatively minuscule compared to other commercial products, as is M/Monit’s memory footprint. Would you believe it apparently runs super-efficiently using only 10MB of RAM and just 25MB of disk space? The docs say it can run on any POSIX system and also uses performant thread-pools and non-blocking IO too.

   If Failed...


Without a shadow of doubt there’s a massive number of scenarios which Monit can help with. Those pesky developers may never have the opportunity to point their fingers in your direction again.
In this article we’ve looked at networks, processes and filesystems, all of which the magic Monit can comprehensively assist with. Coupled with its graphical capabilities and M/Monit there’s little doubt that Monit can improve your monitoring capabilities without breaking a sweat.
Sadly it’s unlikely that you’ll be in a position to *automatically* point your finger at the developers when the next problem arises. At the very least however you can automagically restore services that have failed. And, most importantly you’ll be able to achieve that without being woken up in the middle of night, whilst catching up on your beauty sleep.

Linux Utilities - Linux File Sharing Over Network Computers Using scp And rsync

$
0
0
http://www.linuxandubuntu.com/home/linux-utilities-linux-file-sharing-over-network-computers-using-scp-and-rsync

Linux Utilities - Linux File Sharing Over Network Computers Using scp And rsync
In this article we shall discuss about two powerful Linux utilities that are used for sharing file/folder to network computers that are scp and rsync. scp allows you to simply copy directories or files from/to any remote destination whereas the rsync, besides simply copying files also acts as a synchronising tool that would synchronise the changes between source and destination. The discussion below is about their usage and various parameters that can be used along with to increase speed and security.

What Is SCP?

The SCP is a network protocol based on the BSD, RCP protocol. It supports file transfer over a network computers using Secure Shell (SSH). With SCP a client can send files to another client or server on the same network. It can also request or Download files from a server.

If user wants to share multiple files over a network computer then there are two ways to accomplish that. User can either specify each file in the command and then provide the destination path. The second method is that user can save all the files in one folder and can share the entire folder over the network computer. Both the methods have been mentioned below. You can use anyone you like.

Install OpenSSH Server In Linux

OpenSSH is required for doing Linux data transfer over network. I noticed that it's not already installed in some Linux distributions so in that case, the commands result in errors. So install OpenSSH server before you go ahead and share files using SCP.
Install OpenSSH Server

Syntax - How To Share Files Over A Network Computer?

SCP Syntax
Example - If you want to share a file name "myMovieList.txt" to a remote host(192.168.1.102), you can use the following command based on the above syntax.
SCP Linux File Sharing
To copy file from remote machine to your local machine
Copy file from remote machine to local machine
To copy multiple files, provide space separated list of files and at the last destination path
SCP - Copy multiple files

Using SCP Parameters For More File Sharing Options

You can use scp command with certain optional parameters that help you in faster copying and/or secure data transfer.

r : To copy directory you have to use parameter r to recursively copy the contents.

​The r command makes it very simple to transfer multiple files contained in a single folder. It's one of the best methods to do quick and secure Linux file sharing over network computers.
'r' Parameter to copy folder to a host computer
P : To send out file on machine with different port

​By default, scp shares file over network computers through port 22. In many cases, you would want to use another port then you can P parameter to use another port for folder sharing.
'P' Parameter to share files on host computer through a different port
c : Change Encryption algorithm

By default, scp uses Triple-DES cipher to encrypt data before transferring it. You can use other ciphers like blowfish (which has higher performance over default one).
'c' Change Encryption Algorithm
C : To transfer even faster you can use compression parameter that would compress the data while transferring and auto decompress it on the destination.
NOTE: No need to decompress the file on the destination.

What Is rsync?

​Rsync is helpful in sharing files annd folders and synchronising files and folders. Unlike SCP, rsync transfers only differences between source and destination files/folders. It uses compression and decompression by default and hence is faster than SCP. Once you get familiar with it, it'll save your a lot of time.

Install rsync In Linux

Install rsync in Linux

Syntax To Sync Folder Between Network Computers

Syntax
With rsync user can synchronize two folders existing over network computers. To transfer/sync folder from local to remote host, use the following command -
Sync folder using rsync
​[a and r params preserve timestamp, owner, links etc and recursively syncs the files respectively].

​List of optional parameters are:

-z : compress data.
-a : preserve links, owner, timestamp etc.
-r : recursive.
--progress: show progress while transferring.
--include and --exclude : include or exclude pattern or files.
Example

only rsync files/folders starting with S.

--delete : delete the directory if it doesn't exist at source but exists at the destination.
--max-size : max transfer size limit. [eg: --max-size='2000k']
--remove-source-files : remove files at source after sync
--bwlimit : limit bandwidth for transfer [--bwlimit=1000] (limit by 1000 bps)
If you are unsure of rsync command result, you can also do dry run with command : --dry-run.

Conclusion

Both the linux utilities are useful in sharing files over network computers. rsync being more efficient since it transfers only differences and compressed data by default. That's all for now. You can explore man pages for more. Do leave suggestions, comments or questions in the comment section below.

How To Configure Apache Mod_Expires To Cache Content Based on File Extensions

$
0
0
http://linuxpitstop.com/configure-apache-mod_expires-on-file-extensions

Caching is the need of the hour,  If your website loads slower than your competitor’s, you have almost lost the battle. Webmasters and system administrators use various techniques to improve the loading time of their sites,  Apache’s mod_expires module is also used for similar purposes. By properly configuring this module, you will be able to control the cache settings of your site in visitor’s browsers. “Cache-Control HTTP headers” are the ones that are responsible for caching your website(s) in browsers, mod_expires sets the expiry values on the backend on the actual server, so your visitor’s don’t have to wait for page load from server every time. If you don’t have this module configured on the server, then your visitors will have slow load time each time  they will try to visit your site.

How mod_expires is used?

There are certain methods to enable caching of your websites, some administrators specify a particular directory to cache, or some administrators cache the whole web directory, or more popular approach is to cache the web content based on file extensions. It all depends on your website that which type of caching mechanism is suitable for it. We will be reviewing how to enable browser based caching for certain file extensions like jpg, png, css etc. Most common scenario to use mod_expires is to enable it on web server and provide the list of file extensions and their expiry date.

Enable mod_expires on CentOS and Ubuntu

This module is already enabled on CentOS systems (provided your centos version is > 5 ) but it need to be enabled on Ubuntu systems. First, let’s see how to verify that mod_expires is enabled on CentOS.
Run following command on your CentOS system to see if Apache module mod_expires is enabled or not, It should show following output if enabled, otherwise you’ll see nothing in output.
httpd -M | grep expires
mod_expires
Another way to verify it is via httpd.conf file, open apache configuration file in your favorite text editor application (Vi/ViM, Nano etc) and search for following line.  If successfully found, then your Apache has  mod_expires enabled.
LoadModule expires_module modules/mod_expires.so
mod_expires
For Ubuntu system, we need to use a2enmod utility to enable Apache modules, simply run following command to enable expires module on Ubuntu.
a2enmod expires
Once done, we need to restart apache for this change to take effect.
/etc/init.d/apache2 restart

Configure File’s Caching in mod_expire

Alright, we are done with the installation of this module, lets configure it to enable caching for our specified file extenions. For the sake of demonstration, we will be enabling caching for following file type.
.jpg, .png, .css, js
Firs of all create a new file named “expire.conf” inside /etc/httpd/conf.d/ directory.
cd /etc/httpd/conf.d/
touch expire.conf
Open this newly created file in text editor and populate it as follows.

ExpiresActive on

ExpiresByType image/jpg “access plus 60 days”
ExpiresByType image/png “access plus 60 days”
ExpiresByType image/js “access plus 60 days”
ExpiresByType image/jpeg “access plus 60 days”
ExpiresByType text/css “access plus 1 days”
mod_expire setting
“ExpiresActive on” will enable this module, the rest are the file extensions followed by their expiry time. If user want to load these files without using caching, he/she will need to clear their browser cache, otherwise cache will expiry after the specified amount of time and new cache will be created accordingly.
Restart apache web server for the changes to take effect.
service httpd restart
or if you are using CentOS 7 /RHEL 7 ;
systemctl restart httpd
Congratulations! You have successfully configured browser caching for your websites.
Special Scenario :  If you are hosting multiple websites on your system and don’t want this caching to apply to all sites, then you will need to use .htaccess file for the individual sites to place this code there. “.htaccess” is used to override apache configuration on every website’s level.

Conclusion

Hope you find this article useful; Apache caching can be achieved by using various modules, but mod_expires is specially useful for enable browser caching of your sites. After enabling this module, you should be seeing noticeable improvements in your website’s loading time.

Proofreading for illusions with grep and AWK

$
0
0
http://www.thelinuxrain.com/articles/proofreading-for-illusions-with-grep-and-awk

Lexical illusions are very hard to find when proofreading. The most common lexical illusion is a duplicated word, as in this well-known example:
A lexical illusion:
many people are not aware that the
the brain will automatically ignore
a second instance of the word 'the'
when it starts a new line.
1
But if you let grep and AWK do the proofreading — problem solved!

Duplications on one line: grep

Word duplications are sometimes just as easily overlooked when they're on a single line, as in this example:
The Liberal Party has taken the old line so beloved of
economic think tanks since the 1980s of cutting company
taxes and and assisting innovation, while the ALP's approach
involves an emphasis on on education spending and concerns
over inequality that is increasingly becoming the new standard.
2
A good way to find the dupes is with this grep code, which I found here:
grep -onE '(\b.+) \1\b'
3
The grep options used are '-o', which returns only the looked-for string, rather than the whole line; '-n', which gives the number of the line with the looked-for string; and '-E', which allows grep to use nifty things like backreferences.
The looked-for string is a regular expression. The bit in brackets is word boundary (\b) followed by 1 or more appearances (+) of any character (.). This is followed by a space, then a backreference (\1) representing the bit in brackets, and closing with another word boundary. If that last '\b' wasn't in the regex, grep would return non-duplications like 'on one occasion'.

Duplications across successive lines: AWK

Here's an AWK command that finds line pairs in which the last word of the first line is also the first word of the second line. It relies on the fact that AWK recognises words as separate fields, because they're separated by whitespace, and that's the default field separator for AWK.
awk '$1==a {print b"\n"$0; a=""; b=""} {a=$NF; b=$0}'
4
AWK reads the text line by line, and the command begins with a pattern-action statement: if the first field (word) equals the variable 'a', AWK does the action in brackets, namely print... But wait! No variable 'a' has been defined yet, so that action can't happen on the first line. AWK moves to the second action, which is to set the variable 'a' equal to the contents of the last field/word ($NF) in the first line, and the variable 'b' to the contents of the whole first line ($0).
Next, AWK reads the second line. If the first word in this line is the same as the last word in the last line, AWK prints the last line (as stored in 'b'), followed by a newline, followed by the whole current line. It then 'empties' the two variables by setting them equal to the empty string '""'. Whether the first word equals the last word or not, AWK also does the second action, namely fill the two variables with the last word in the current line and the whole current line, ready for a test of the third line. If no line pairs pass the test, AWK doesn't print any lines.
We can make this command slightly cooler by allowing for the possibility that there are lexical illusions on successive lines, as here:
A lexical illusion:
many people are not aware that the
the brain will automatically ignore
ignore a second instance of the word 'the'
when it starts a new line.

awk '$1==a {print b"\n"$0"\n"; a=""; b=""} {a=$NF; b=$0}'
5
The command now adds a blank line after each two-line match, so that successive illusion-pairs appear separately in the output. Note that AWK will ignore spaces at the beginnings and ends of lines, since they're separators, not fields:
6

About the Author

Bob Mesibov is Tasmanian, retired and a keen Linux tinkerer.

How to build projects using the Raspberry Pi camera

$
0
0
https://opensource.com/life/15/6/raspberry-pi-camera-projects

author photos with filters
The Raspberry Pi camera module is a great accessory for the Pi—it's great quality, and can capture still photos and record video in full HD (1080p). The original 5-megapixel camera module was released in 2013, and a new 8-megapixel version was released in April this year. Both versions are compatible with all Raspberry Pi models. There are also two variations—a regular visible light camera, and an infra-red camera—both available for US$ 25.
The camera module is high spec and much better quality than a basic USB webcam. Its feature-packed firmware fully utilizes the power of the VideoCore GPU in the Raspberry Pi SoC, allowing recording 1080p video at 30fps, 720p at 60fps, and VGA resolution (640x480) at 90fps—perfect for slow-motion playback.

Get started

First, with the Pi switched off, you'll need to connect the camera module to the Raspberry Pi's camera port, then start up the Pi and ensure the software is enabled. Locate the camera port on your Raspberry Pi and connect the camera:
Dave Jones, CC BY-SA
Ensure the camera software is enabled in the Raspberry Pi Configuration tool:
screenshot
Test your camera by opening a terminal window and entering raspistill -k. This will show you a camera preview on the monitor. If you're connected via SSH or VNC, this will be shown on the Pi's monitor, not yours. Press Ctrl + C to exit the preview.

Python

Although you can control the camera using the command-line interface raspistill, using the Python picamera module is much easier and allows you to change the camera controls dynamically in real time—ideal for projects.
Open the Python 3 editor, IDLE, create a new file and type the following code:
from picamera import PiCamera
from time import sleep

camera = PiCamera()

camera.start_preview()
sleep(3)
camera.capture('/home/pi/Desktop/image.jpg')
camera.stop_preview()
Now run the code and it should show the preview for three seconds before capturing a photo. The photo will be saved on your desktop, and you should see an icon with a thumbnail appear right away. Double-click the icon on your desktop to see the picture.
You can manipulate the camera object in various ways. You can alter the brightness and contrast with values between 0 and 100:  camera.brightness = 70 camera.contrast = 40 You can add text to the image with:  camera.
annotate_text = “Hello world"
You can alter the image effect with:
camera.image_effect = “colorswap"
Also try out effects, such as sketch, negative, and emboss. A list of effects is provided in camera.
IMAGE_EFFECTS, which you can loop over and makes a great demo:
camera.start_preview()
for effect in camera.IMAGE_EFFECTS:
camera.image_effect = effect
camera.annotate_text = effect
sleep(5)
camera.stop_preview()
There are many more attributes you can alter, such as resolution, zoom, ISO, white-balance modes, and exposure modes. See the picamera documentation for more details.

Video

Recording video is just as easy—simply use the methods start_recording() and stop_recording():
camera.start_preview()
camera.start_recording('/home/pi/video.h264')
sleep(10)
camera.stop_recording()
camera.stop_preview()
Then play back using omxplayer. Note the video may play back at a higher frame rate than was recorded.

Infrared

The Raspberry Pi infrared camera (Pi NoIR) was made especially because people were buying the regular camera and taking it apart to remove the infrared filter—with varying success—so the Foundation decided to produce a special camera without the infrared filter. The API works exactly the same, and in visible light, pictures will appear mostly normal, but they can also see infrared light, allowing capturing and recording at night.
Pi camera
This is great for wildlife cameras, such as the Naturebytes kit, projects like the infrared bird box, and various security camera projects. The IR camera has even been used to monitor penguins in Antarctica.
Also the camera can be used to monitor the health of green plants.

Pi Zero

When the $5 Pi Zero was announced last year, it did not feature a camera connector due to its bare bones minimalist nature; however, last month a new version of the Zero was announced, which added a camera port.
The connector is smaller than the regular one. In fact, the same connector is used on the compute module, but a cable can be used to connect a camera. Both spins—visible and infrared—and both versions (V1 and V2) work with the new Pi Zero.

More ideas

There's plenty more to read up on what you can do with the camera module, and why not tie in with some GPIO for more physical computing projects?

How to effectively clear your bash history

$
0
0
http://www.techrepublic.com/article/how-to-effectively-clear-your-bash-history

If you're serious about security on your Linux machines, you might want to clear the bash history. Learn how to do this more effectively than with just a single command.
 
Image: Jack Wallen
On your Linux machines, a history of your bash commands is retained. This is great when you need to repeat a command or can't remember exactly how you executed a command in a previous session. However, this can also be seen as a security issue. What if someone gains access to your machine, opens a terminal window, and checks through your bash history to see what commands you've run?
Bash has a handy way to clear the history: issue the command history -c. There's a slight problem with that approach. Let me explain.

First off, your bash history is retained in the file ~/.bash_history. When you have a terminal open, and you issue a command, it writes the command to the history file. So issuing history -c will clear the history from that file. The problem comes about when you have multiple terminal windows open. Say you have two terminal windows open and you issue history -c from the first one and close that window. You then move to the second terminal window, and you type the exit command to close that window. Because you had a second bash window open, even after running the history -c command in the first, that history will be retained. In other words, the history -c command only works when it is issued from the last remaining terminal window.
How do you get around that? You empty the .bash_history file either on a per-instance basis or by using a crontab job to do it regularly. If security is a serious matter for you, consider setting up the crontab job. Here's how.
SEE:Linux Foundation launches badge program to boost open source security (ZDNet)

Clearing bash history on a regular basis

Before I show how to set up the crontab job for this, know that the ~/.bash_history file can be cleared with the command:
cat /dev/null > ~/.bash_history
That will empty out the contents of the file, but keep the file in place.
Let's say you want to clear the .bash_history file for user olivia (who administers your Linux server) at 11:00 p.m. every day. You would create a cron job under the olivia account. To do that, log in as the user olivia, open a terminal window, and issue the command crontab -e. When the crontab editor opens, enter the following:
00 23 * * * cat /dev/null > ~/.bash_history
Save that file and cron will start clearing out olivia's history at 11:00 p.m. every day.

A surefire method

This is a surefire method of clearing out your bash history. Don't always rely on the history -c command, because you never know when a second (or a third) terminal is still open, ready to keep that history retained.
 

How To Install Btrfs Tools And Manage BTRFS Operations

$
0
0
http://linuxpitstop.com/install-btrfs-tools-on-ubuntu-linux-to-manage-btrfs-operations

Hello everybody, today we are going to show you installation of Btrfs tools and its Operation. Btrfs is a new copy on write (CoW) filesystem for Linux aimed at implementing advanced features while focusing on fault tolerance, repair and easy administration. Jointly developed at multiple companies, Btrfs is licensed under the GPL and open for contribution from anyone. Considering the rapid development of Btrfs at the moment, Btrfs is currently considered experimental. But according to the wiki maintained by the btrfs community, many of the current developers and testers of Btrfs run it as their primary file system with very few “unrecoverable” problems. Thus, Linux distributions tend to ship with Btrfs as an option but not as the default. Btrfs is not a successor to the default Ext4 file system used in most Linux distributions, but it can be expected to replace Ext4 in the future.
Now we will be going to install the latest version of brtfs-tools on Ubuntu Linux based server.

Prerequisites

Before installing the Btrfs on your linux system, make sure that you are using the latest version of kernel as it has been included in the mainline kernel. After that you are required to install some packages that are are necessary and helps in the installation of Btrfs tools.
Let’s run the below command to install build tools on your Linux system.
# apt-get install git install asciidoc xmlto --no-install-recommends
installing build tools
Now run the command below to install some more libraries for your system and press ‘y’ to continue.
# apt-get install uuid-dev libattr1-dev zlib1g-dev libacl1-dev e2fslibs-dev libblkid-dev liblzo2-dev
required btrfs libs

Downloading Brtfs-tools

To download the latest stable version of brtfs-tools run the the following git command in your command line terminal.
# git clone git://git.kernel.org/pub/scm/linux/kernel/git/kdave/btrfs-progs.git
download btrfs-toosl

Build Btrf-tools

Run the following command for preparing your btrf-tools to build for compilation after changing directory to the downloaded package as shown.
# cd btrfs-progs/
# ./autogen.sh
After generating the build you will be asked to type ‘./configure’ and ‘make’ to compile. Just flow the below commands one by one.
# ./configure
make
compiling btrfs-tools

Installing Btrfs-Tools

Once the btrfs-tools compilation process completes, we can install it by using ‘make install’ command as shown below.
# make install
After installation, run below command to verify the installed version of btrfs-tools on your system.
# btrfs version
Installing btrfs-tools

Managing Btrfs Operations

BTRFS aims to provide a modern answer for making storage more flexible and efficient. Now we are going to show you some of the useful operations of Btrfs. It stores data in chunks across all of the block devices on the system. The total storage across these devices is shown in the standard output of df -h.
Raw data and filesystem metadata are stored in one or many chunks, typically 1 GiB in size. When RAID is configured, these chunks are replicated instead of individual files.

Btrfs Filesystem creation

‘mkfs.btrfs’ can accept more than one device on the command line using different options to control the raid configuration for data (-d) and metadata (-m). Once you have added another disk to your system and you wish to mount it using btrfs, then run below command to create its system.
# mkfs.btrfs /dev/sdb
creating btrfs
Once you have create a filesystem, you can mount your new btrfs device using below command.
# mount /dev/sdb /mnt

Btrfs Device scanning

btrfs device scan is used to scan all of the block devices under /dev and probe for Btrfs volumes. This is required after loading the btrfs module if you’re running with more than one device in a filesystem.
Let’s run below command to scan all devices.
#btrfs device scan
To scan a single device use below command.
#btrfs device scan /dev/sdb
You can use below command to print information about all of the btrfs filesystems on the machine.
# btrfs filesystem show

Adding New devices

New physical disks can be added to an existing btrfs filesystem. The first step is to have the new block device mounted on the machine like have already done this. Afterwards, let btrfs know about the new device and re-balance the file system. The key step here is re-balancing, which will move the data and metadata across both block devices.
So, first run below command to add new devices to a mounted filesystem.
#btrfs device add /dev/sdb /mnt
Then use below command to balance (restripe) the allocated extents across all of the existing devices. For example, with an existing filesystem mounted at /mnt, you can add the device /dev/sdb to it.
# btrfs filesystem balance /mnt
new device
Run the following command that prints very useful information that you can use to debug and check how the BTRFS volume has been created.
# btrfs filesystem df /mnt
Data, single: total=1.00GiB, used=320.00KiB
System, DUP: total=32.00MiB, used=16.00KiB
Metadata, DUP: total=128.00MiB, used=112.00KiB
GlobalReserve, single: total=16.00MiB, used=0.00B
Adding in /etc/fstab
If you don’t have an initrd, or your initrd doesn’t perform a btrfs device scan, you can still mount your volume btrfs filesystem by passing your devices in the filesystem explicitly to the mount command by adding below entry in your ‘/etc/fstab’ file.
# vim /etc/fstab
/dev/sdb /mnt btrfs 0 0
A common practice in system administration is to leave some head space, instead of using the whole capacity of a storage pool (just in case). With btrfs one can easily shrink and expand the volumes.
Let’s shrink the volume a bit (about 25%) using below command.
# btrfs filesystem resize -1g /mnt
To grow the volume run below command.
# btrfs filesystem resize +150m /mnt
This is the opposite operation, you can make a BTRFS grow to reach a particular size (e.g. 150 more megabytes) as in above command. You can also take an “all you can eat” approach via the max option, meaning all of the possible space will be used for the volume with below command.
 #btrfs filesystem resize max /mnt

Removing devices

Use below command to remove devices online. It redistributes the any extents in use on the device being removed to the other devices in the filesystem.
#btrfs device delete /dev/sdb /mnt

Conclusion

Btrfs is intended to address the lack of pooling, snapshots, checksums, and integral multi-device spanning in Linux file systems. These features are being crucial as the use of Linux scales upward into larger storage configurations. Btrfs is designed to be a multipurpose filesystem, scaling well on very large block devices. There are alot of its other operational usages that you can use. So, don’t wait and let’s get started with btrfs and I hope you find this quite better than other Linux file systems.

4 tips for GIMP beginners

$
0
0
https://opensource.com/life/16/6/tricks-gimp-beginners

Getting started with GIMP
Image by : 
opensource.com
Everybody is a beginner sometime. And for new users to GIMP, the GNU Image Manipulation Program, starting out with a new interface can be daunting, especially when you downloaded it just because you wanted to make a few simple modifications like cropping or resizing an image. Fortunately, there are lots of resources out there to help you get started.
As a GIMP user for over a decade, I still think of myself a largely being a beginner. I'm not a graphic designer, but I'm constantly finding myself in situations where I need to make small adjustments and modifications to files I have in hand to fit a specific need. Make this image fit a different space. Use this icon but make it fit with a different color palette. Make something that looks like another image but change the text, without having the original. Create a mockup that a real designer can use to turn into a completed layout.
In addition to folks like me who need to be able to do a passable job with print and web design, there are plenty of amateur photographers out there in the world just looking to retouch and enhance their collection of captured memories.
And while there are ton of lists out there of what various users think are the latest and greatest tricks for GIMP, whether it's adding beveled edges or glowing text or a motion blur or some other cool tip, knowing how to use a program isn't just a collection of one off recipes. It's about knowing some foundations, where to look for things, and how to learn more. So with that in mind, here are the top five things I wish I had known when I first started using GIMP.

How to make GIMP more like Photoshop

There's definitely some debate out there as to whether this is a good idea or not. If you're starting off as a fresh user, as opposed to a Photoshop convert, there's probably no need to take this approach. But if you're used to the particular look and feel of Photoshop, or a similar photo editing program, GIMP's interface may feel foreign. Photography Riley Brandt offers some tips for switching the GIMP interface up to be more Photoshop-like.
Beware, however, using GIMPshop.com, which installs adware along with your GIMP software packages. You're better off doing the configuration itself. GIMPshop itself was once a legitimate open source project, and though no longer actively maintained, the old files can still be found on SourceForge.

Where to find tutorials

There are literally countless tutorials out there for expanding your working knowledge of GIMP software. Rather than linking to individual tutorials, here are a few of my favorite places to find them:
  • The official tutorials section of GIMP.org;
  • GIMP Magazine, a free publication featuring articles on photography and digital art;
  • And finally, since GIMP is visually oriented, I can't recommend enough checking out video tutorials on YouTube. Nothing quite beats seeing something done.

How to automate things

For many users, photo editing isn't so much about getting one image perfect as it is making a lot of small changes to a bunch of different images. While there are certainly command line tools like ImageMagick that can help you out in this regard, GIMP itself is a very scriptable program. GIMP supports macros, written in Python, that makes it easy to perform the same series of operations over and over again without having to go through long tedious steps in the graphical interface. These can also be repeated, automatically, as appropriate for your workflow.
GIMP also comes with a batch mode, that allows edits to be run automatically from the command line, making it easy to integrated GIMP into scripts, and there are plugins out there that make batch processing easy for the command line-adverse.

Where to ask questions and get help

GIMP has a large user community. For those who are used to more traditional approaches to free and open source software community, GIMP hosts their own IRC server at irc.gimp.org which containers a number of channels where questions are welcome, and there is also a users'mailing list where you can find discussions.
In addition, there are communities for GIMP users in many other places across the Internet, including a healthy subreddit, many tagged questions in the Graphic Design section of StackExchange, many other unofficial places for discussion like GIMP Forums and GIMP Chat, as well as social media channels like the Google Plus GIMP users group.

Of course, thinking back, there are tons of other things I wish I knew as well. What do you wish someone had told you on day one?

25 Practical examples of the find command

$
0
0
http://www.librebyte.net/en/gnulinux/25-practical-examples-of-the-find-command

find is a utility that allows to search files (regular file, directory, symbolic link…) through a hierarchy of directories, it is powerful and feature-rich.
The find command allows you to find files by:
  • Name (match with a text or regular expression)
  • Symbolic links
  • Dates
  • Size
  • Type: regular file, directory, symbolic link, socket,…
  • User and group
  • Access permission
  • Number of directory level
  • Or some combination of the above
Once we found what we are looking for we can:
  • View or edit
  • Store
  • Delete / rename
  • Change permissions
  • Grouping and more
In this article we will show how to use find through examples

Basic search

1. Find all regular files

$ find Symfony -type f
Symfony/web/.htaccess
Symfony/web/app.php
Symfony/web/app_dev.php
Symfony/web/robots.txt
...

2. Find all directories

$ find Symfony -type d
Symfony/
Symfony/web
Symfony/web/bundles
Symfony/web/bundles/webprofiler
...

3. Search based on the name of the files or directories

$ find Symfony -name '*config*';
Symfony/app/config
Symfony/app/config/config_prod.yml
Symfony/app/config/config.yml
...

4. Search based on the name (case insensitivity)

$ find Symfony -iname '*config*';
...
Symfony/.../Loader/ConfigurationLoader.php
Symfony/.../ConfigurationResource.php
...
Symfony/app/config
Symfony/app/config/config_prod.yml
Symfony/app/config/config.yml
...

Search based on the size of the files

5. Find all files with size equal to 300MB

$ find . -size 300M

6. Find files with size greater than 300MB

$ find . -size +300M

7. Find files with size less than 300MB

$ find . -size -300M

8. Find all files with size greater or equal to 270MB and less than 300MB

$ find . -size +270M -size -300M

9. Find empty directories and files

$ find . -empty

Search based on dates

GNU/Linux stores the last date of the following operations:
OperationMeaningfind option
accesswhen it reads the contents of a file-atime,-amin
modificationchanging the contents of a file-mtime,-mmin
change of statusmodifies the file name or its attributes (perms, owner, ...)-ctime,-cmin
To know the above dates use the stat command, for example:
$ stat index.php
...
Access: 2016-06-0222:53:22.813885684 -0500
Modify: 2016-05-08 12:12:12.971073193 -0500
Change: 2016-05-08 12:12:12.971073193 -0500

10. Find the files that were accessed less than 15 days ago

$ find . -atime -15

11. Find the files that were modified over 7 days ago

$ find . -mtime +7

12. Find the files which change its status in a period between 2 and 6 minutes ago

$ find . -cmin +2 -cmin -6

Search based on owner and group

13. Find files whose owner is sedlav

$ find . -user sedlav -type f

14. Find the files that belong to the group flossblog

$ find . -group flossblog -type f

find allows you to find files using the numeric identifier of the owner and group, the advantage of using this method is that it allows you to specify ranges.

15. Find files whose owner has a uid between 500 and 1000 (excluding 500 and 1000)

$ find . -uid +500 -uid -1000 -type f

Sometimes it is necessary to find all the orphaned files for example if we have evidence of some unusual behavior from our server or workstation can start finding all the files that do not belong to any user or group

16. Find the files that do not belong to any user

$ find . -nouser

17. Find the files that do not belong to any group

$ find . -nogroup

Search based on the permissions of the files

find allows you to find files for which the current user has read permissions (-readable), writing (-writeable) and execution (-executable) or files that have a certain mode

18. Find all files that can be read by the current user

$ find . -readable

19. Find all files that can be modified by the current user

$ find . -writable

20. Find all files that the current user can execute

$ find . -executable

Find files that have a certain mode

-perm PMODE
  • PMODE may be octal or symbolic
  • PMODE can be prefixed with: / or -
  • If PMODE is not prefixed with / or - then the permissions on the file should be exactly match PMODE
  • If PMODE is prefixed with - then will match if the permissions of the file contains PMODE
  • If PMODE is prefixed with with / then will match if any of the bits set to PMODE are present in the file permissions (Symbolic is not allowed)
PermOctalSymbolic
Read4r
Write2w
Execute1x
Examples:
21. Find all files whose owner and group have read and write permissions and and the rest of the world read permission
$ find -perm 664

22. Find all files whose owner and group have permissions for reading and writing, and the rest of the world read permission
Note - before the mode, therefore here also match the files that have the following permissions: 777, 666, 776
$ find . -perm -664

23. Find all the files that can be modified by any user
$ find . -perm /222

Advanced search

24. Search based on regular expressions down one level

Find all directories under project DIR down to a single-level (non-recursive search), that are not empty, not ending in a digit, old backups, bkp or contain the words backup, copy, new back followed by a hyphen, underscore or dot.
$ PATTERN='.*/((.*([0-9]|old|ba?c?ku?ps?))|(..*)|(copy|new|backup|back|)[-_.].*)$';
$ find project -maxdepth 1 -mindepth 1 -regextype posix-egrep ! -iregex $PATTERN ! -empty -type d

25. Combining find, xargs and grep

This is one of my favourite combinations due I can perform a lot of custom searches. For example, if I want to search the word ireg in all php files of my project then I would do:
$ find project -name '*.php' -type f -print0 | xargs -0grep -l ireg

Further reading

  • man find
  • info find

Traffic Misdirection With Redir

$
0
0
http://www.linux-server-security.com/linux_servers_howtos/linux_redir_commands.html

There are times when, despite your best efforts, you have little choice but to put a quick workaround in place. Reconfiguring network-border firewalls or moving services between machines is simply not an option because the network’s topology is long established and definitely shouldn’t be messed about with.
Picture the scene. You’ve lost an inbound Mail Server due to some unusual issue with the application which will probably take more than the few minutes than you have spare to fix. In their wisdom the architects of your Mail Server infrastructure didn’t separate the Web-based interface from the backend daemons which listen out for the incoming e-mail and both services reside on the server with a failed IMAP Server (Internet Message Access Protocol) which collects inbound mail for your many temperamental users.
This leaves you in a tricky position. Fundamentally you need both the services up and available. Thankfully there’s a cold-swap IMAP Server with up-to-date user configuration available but sadly you can’t move the IP Address from the E-mail Web Interface over to that box without breaking the interface’s connectivity with other services.
To save the day you ultimately rely on a smattering of lateral thinking. After all it’s only a TCP port receiving the inbound e-mail and luckily for you the Web Interface can refer to other servers so that users can access their e-mails. Step forward the excellent “redir” daemon.
This clever little daemon has the ability to listen out for inbound traffic on a particular port on a host and then forward that traffic onwards somewhere else. I should warn you in advance that it might struggle with some forms of encryption which require certificates being presented to it but otherwise I’ve had some excellent results from the redir utility. In this article we’ll look at how redirecting traffic might be able to help you out of a tight spot and additionally possible alternatives to the miniscule redir utility.

   Installation


You probably won’t be entirely surprised to read that it’s as easy as running this command on Debian derivatives:
# apt-get install redir
On Red Hat derivatives you will likely need to download it from here: http://pkgs.repoforge.org/redir/
Then you simply use “rpm -i ” where “version” is the download which you choose. For example you could do something like this:
# rpm -iredir-2.2.1-1.2.el6.rf.x86_64.rpm
Now that we have a working binary let’s look at how the useful redir utility works; thankfully it’s very straightforward indeed. Let’s begin by considering the non-encrypted version of IMAP (simply because I don’t want to promise too much with services encrypted by SSL or TLS). Have a think about the inbound e-mail server listening on TCP port 143 and what would be needed should you wish to forward traffic from that port to another IP Address first of all. This is how you could achieve that with the excellent redir utility:
# redir --laddr=10.10.10.1 --lport=143 --caddr=10.10.10.2 --cport=143
In that example we can see our broken IMAP Server (who has IP Address “10.10.10.1”) running on local port 143 (set as “--lport=”) having traffic forwarded to our backup IMAP Server (with IP Address “10.10.10.2”) to the same TCP port number.
To run redir as a daemon in the background you’re possibly safest to add an ampersand as we do in this example where instead of forwarding traffic to a remote server we simply adjust the port numbers on our local box.
# redir --laddr=10.10.10.1 --lport=143 --laddr=10.10.10.1 --cport=1234 &
You might also explore the “daemonize” command to assist. I should say that I have had mixed results from this in the past however. If you want to experiment then there’s a man page here: http://linux.die.net/man/1/daemonize
You can also use the “screen” command to open up a session and leave the command running in the background. There’s a nicely written doc on the excellent “screen” utility here from the slick Arch Linux: https://wiki.archlinux.org/index.php/GNU_Screen
The above config example scenario is an excellent way of catching visitors to a service whose clients aren’t aware of a port number change too. Say for example you have a clever daemon which can listen out for both encrypted traffic (which would usually go to TCP port 993 on IMAP for the sake of argument) and unencrypted traffic (usually TCP port 143). You could redirect traffic destined for TCP port 143 to TCP port 993 for a short period of time while you tell your users to update their software. That way you might be able to close another port on your firewall and keep things simpler.
Another life-saving use of the magical redir utility is when a DNS or IP Address changes take place.
Consider that you have a busy website listening on TCP port 80 and TCP port 443. All hell breaks loose with your ISP and you’re told that you have ten days to migrate to a new set of IP Addresses. Usually this wouldn’t be too bad but the ISP in question has set your DNS TTL expiry time (Time To Live) to a whopping seven days. This means that you need to make the move quickly to provision for the cached DNS queries which go past seven days and beyond. Thankfully the very slick redir tool can come to the rescue.
Having bound a new IP Address to a machine you simply point back at the old server IP Address using redir on your HTTP and HTTPS ports.
Then you change your DNS to reflect the new IP Address as soon as possible. The extra three days of grace should be enough to catch the majority of out-of-date DNS answers but even if it isn’t you could simply use the superb redir in the opposite direction if you ISP let you run something on the old IP Address. That way any stray DNS responses which arrive at your old server are simply forwarded to your new server. In theory (I’ve managed this in the past with a government website) you should have zero downtime throughout and if you drop any DNS queries to your new IP Address the percentage will be so negligible your users probably won’t be affected.
In case that you’re not aware the DNS caching would only affect users who had visited in the seven days prior to the change of IP Address. In other words any new users to the website would simply have the new IP Address served to them by DNS Servers, without any issue whatsoever.

   Voting By Proxy


It would be remiss not to mention that, of course IPtables also has a powerful grip on traffic hitting your boxes too. We can deploy the mighty IPtables to allow for a client to unwittingly push traffic via a conduit so that a large network can filter which websites its users are allowed to access for example.
There’s a slightly outdated document on the excellent TLDP (The Linux Documentation Project) website here: http://tldp.org/HOWTO/TransparentProxy-6.html
Incidentally Transparent Proxies are also known as Intercepting Proxies or Inline Proxies for reasons that we’ve just covered, in case it causes confusion.
With the super-natty redir tool we can create a Transparent Proxy as so:
# redir --transproxy 10.10.10.10 80 4567
In this example we are simplyforwardingall traffic destined for TCP port 80 to TCP port 4567 so that the Proxy Server can filter using its rules.
There’s also a potentially useful option called “--connect” which will allow HTTP proxies with the CONNECT functionality.
To use this option add the IP Address and port of the proxy (using these options “--caddr” and “--cport” respectively).

   Shaping


I’ve expressed my reservations about the usually-very-able redir utility handling encrypted traffic because of certificates sometimes messing things up. The same applies with some other two-way communication protocols or those which open up another port such as sFTP (Secure File Transfer Protocol) or SCP (Secure Copy Protocol).
However with some experimentation if you put the redir utility to good use and you’re concerned with how much bandwidth might be forwarded then the clever redir utility can also help. Again you might have mixed results.
You can alter how much bandwidth is allowed through your redirection with this option--max_bandwidth”.
The manual in question does warn that the algorithm employed is however a basic one and can’t be expected to be entirely accurate all the time. Think of these algorithms working by their considering a period of a few seconds, the recorded throughput rate and the ceiling which you’ve set it at. When it comes to throttling and shaping bandwidth it’s not actually as easy to get a hundred percent accurate as you might first think. Even shaping with the powerful “tc” Linux tool, combined with a suitable “qdisc” for the job in hand, is prone to errors sometimes, especially when working with very low capacities of throughput, despite the fact it works on an industrial scale.

 My Network Is Down


The Traffic Control tool, “tc”, which I’ve just mentioned is also capable of simulating somewhat unusual network conditions. For example if you wanted to simulate packets being delayed in transit (you might want to test this with Pings) then you can use this “tc” command:
# tc qdisc add dev eth0 root netem delay 250ms
Append another value to the end of that command (such as “50ms”) and you then get a plus or minus variation in the delay.
You can also simulate packet loss with a command like this:
# tc qdisc change dev eth0 root netem loss 10%
This should drop ten percent of packets randomly all going well. If it doesn’t work for you then the manual can be found here: http://linux.die.net/man/8/tc and real life examples here: http://www.admin-magazine.com/Archive/2012/10
I mention the fantastic “tc” at this juncture because you might want to deploy similar settings using the versatile redir utility. It won’t offer you the packet loss functionality however it will add a random delay which might be enough to make users look at their settings and then fix their client-side config without removing all access to their service.
One option which the redir tool supports is called--random_wait”. Apparently redir will randomly multiply whatever setting you put after that option by either zero, one or two milliseconds before sending packets out. Note that this option can be used with another (the “--bufsize” option). The manual explains that it doesn’t deal directly with packets for its random delays but instead defines them as so:
“A "packet" is a block of data read in one time by redir. A "packet" size is always less than the bufsize (see also --bufsize).”
By default the buffer size is 4,096 bytes; experiment as you wish if you want to alter the throughput speeds experienced by your redirected traffic.

   IPtables Local


You can of course also use the mighty IPtables (the kernel-based firewall, Netfilter) to alter how your traffic is manipulated as it arrives at your server. Let’s consider a local port redirection and then we can have a quick a look receiving traffic to a port on one server and dutifully forwarding it onwards to another IP Address.
Here are two examples for locally redirecting.
#iptables -A PREROUTING -t nat -i eth0 -p tcp --dport 25 -j REDIRECT --to-port 2500

# iptables -A PREROUTING -t nat -i eth0 -p tcp --dport 80 -j REDIRECT --to-port 443
Here we use the “PREROUTING” functionality on IPtables. The first command redirects incoming traffic for SMTP to port 2500 and the second command intercepts HTTP port traffic and forwards it onto the SSL/TLS port. The syntax isn’t too hard to follow thankfully.
If you get lost then you can easily look up any NAT (Network Address Translation) rules by using this command:
# iptables -nvL -t nat
Should you feel your blood pressure rising, get caught out and break something horribly then just flush the problematic rules away like this:
# iptables -F; iptables -t nat -F
Adding these “-F” commands to a Bash Alias is sometimes a good idea so you can recover quickly.

   IPtables Remote


What about palming off traffic to another machine by using IPtables, along the same lines that we saw with the redir utility?
Needless to say you should know what you’re doing (and experiment on a test machine ideally before trying these in production). To start us off we need to enable forwarding on our local machine (“forwarding” essentially equals “routing” to all intents and purposes, allowing traffic to move between network interfaces on a local machine). We can achieve that with this command:
# sysctl net.ipv4.ip_forward=1
If you remove the “sysctl” part and add the remainder of that command (“net.ipv4.ip_forward=1”) to the foot of the file “/etc/sysctl.conf” then that new config will survive a reboot.
Next we simply declare our rule, let’s use TCP port 80 again as our example:
# iptables -t nat -A PREROUTING -p tcp --dport 80 -j DNAT --to-destination 10.10.10.123:80
Finally we add this line to enable masquerading:
# iptables -t nat -A POSTROUTING -j MASQUERADE
As you would expect the “-p” switch allows us to change the protocol setting from “tcp” to “udp” or “icmp”. IPtables apparently supports all of these protocols should you have the need to expand that list:
tcp, udp, udplite, icmp, esp, ah, sctp or  all

   Berners-Lee


Of course there needn’t be a reliance on tools that are, admittedly, relatively complex on occasion when other alternatives will suffice.
Since we’ve looked at a common redirect (which is required fairly frequently in my experience), namely those of Web-based services and TCP ports 80 and 443, we will briefly look at how redirects are handled internally using the world’s most popular Web Server, Apache’s httpd.
Once tested a little these rules are relatively intuitive. Here is an example of what a simple redirect would look like. You can see below that we send all inbound traffic to the HTTP port onwards to the HTTPS port:
RewriteCond %{HTTPS} !=on
In the above example if the traffic which hits this rule isn’t already using HTTPS (encrypted with SSL or TLS in other words) then the condition will assume it is unencrypted HTTP traffic and continue onwards to the next rule beneath it. The exclamation and equals sign, “!=”, meaning not-equal-to.
Imagine that you might for example want all traffic except that which is being sent by one IP Address to a new location. Note the slightly obscure exclamation mark before the IP Address “10.10.10.10” which acts as a negatory condition again, if met. You could add a whole subnet here easily too.
RewriteCond %{REMOTE_ADDR} !10.10.10.10
RewriteRule .* http://www.chrisbinnie.tld/newer_page.html [L]
This picks up all the external traffic to your Virtual Host which Apache is dutifully listening out for traffic to. If you’re curious the “[L]” flag at the end of the second line means that “mod_rewrite”, the Apache module responsible for performing the redirects, stops at that “last” command. There are a mountain of flags which the super-slick Apache can use to process its rules, for Apache 2.4 have a look here: http://httpd.apache.org/docs/2.4/rewrite/flags.html
So that “nginx” Web Server users don’t feel left out let’s have a quick look at one of its examples too. The mighty nginx has gained massive traction amongst the Web Server market, if you’re interested in one of the reasons this highly performant piece of software took such a large bite out of Apache’s market share then look up the “c10k” problem using your favourite online search device.
A simple nginx example of forwarding TCP port 80 traffic to an encrypted connection would look something like this:
if ($host = 'www.chrisbinnie.tld' ) {
            rewrite  ^/(.*)$  https://secure.chrisbinnie.tld/$1  permanent;
     }
That’s a welcome, short piece of config hopefully you agree and it also includes a look at how nginx can employ “if” statements, which is highly useful at times, and more familiar to programmers than Apache config might be.
Incidentally you need to place that config inside your “server { }” tag. There are different options to this config; I’ve seen other syntax used in nginx so if it doesn’t work then you might need to look online so that your version’s needs are met or other config isn’t breaking things. This following example is how you might alter the above to catch multiple Domain Names for instance:
server {
 listen 80;
 server_name chrisbinnie.tld www.chris.tld;
 rewrite ^ $scheme://www.chrisbinnie.tld$request_uri permanent;
...
}
Here we are simply grabbing what you might consider as malformed HTTP traffic (it’s not really malformed, users have just typed the wrong Domain Names and URLs into the Address Bar of their Browsers) and we are then forwarding it onto “www.chrisbinnie.tld” so that our precious brand remains intact.

Ensuring Containers Are Always Running with Docker’s Restart Policy

$
0
0
https://blog.codeship.com/ensuring-containers-are-always-running-with-dockers-restart-policy

Getting a notification that Docker containers are down in production is one of the worst ways to spend your night. In today’s article, we’ll discuss how to use Docker’s restart policy to automatically restart containers and avoid those late-night notifications.

What Happens When an Application Crashes?

Before we get started with Docker’s restart policy, let’s understand a bit more about how Docker behaves when an application crashes. To facilitate this, we’ll create a Docker container that executes a simple bash script named crash.sh.
#/bin/bash
sleep30
exit1
The above script is simple; when started, it will sleep for 30 seconds, and then it will exit with an exit code of 1 indicating an error.

Building and running a custom container

In order to run this script within a container, we’ll need to build a custom Docker container which includes the crash.sh script. In order to build a custom container, we first need to create a simple Dockerfile.
$ vi Dockerfile
The Dockerfile will contain the following three lines:
FROM ubuntu:14.04
ADD crash.sh /
CMD /bin/bash/crash.sh
The above Dockerfile will build a container based on the latest ubuntu:14.04 image. It will also add the crash.sh script into the / directory of the container. The final line tells Docker to execute the crash.sh script when the container is started.
With the Dockerfile defined, we can now build our custom container using the docker build command.
$ sudo docker build -t testing_restarts ./
Sending build context to Docker daemon 3.072 kB
Step 1: FROM ubuntu:14.04
---> e36c55082fa6
Step 2: ADD crash.sh /
---> eb6057d904ef
Removing intermediate container 5199db00ba76
Step 3: CMD /bin/bash/crash.sh
---> Running in 01e6f5e12c3f
---> 0e2f4ac52f19
Removing intermediate container 01e6f5e12c3f
Successfully built 0e2f4ac52f19
This build command created a Docker image with a tagged name of testing_restarts. We can now start a container using the testing_restarts image by executing docker run.
$ sudo docker run -d --name testing_restarts testing_restarts
a35bb16634a029039c8b34dddba41854e9a5b95222d32e3ca5624787c4c8914a
From the above, it appears that Docker was able to start a container named testing_restarts. Let’s check the status of that container by running docker ps.
$ sudo docker ps
CONTAINER ID IMAGE COMMAND CREATED STATUS PORTS
The docker ps command doesn’t show any running containers. The reason for this is because docker ps by default only shows running containers. Let’s take a look at running and non-running containers by using the -a flag.
$ sudo docker ps-a
CONTAINER ID IMAGE COMMAND CREATED STATUS PORTS NAMES
a35bb16634a0 testing_restarts "/bin/sh -c '/bin/bas"9 minutes ago Exited (1)8 minutes ago
With the docker ps results, we can see that when an application within a Docker container exits, that container is also stopped. This means that, by default, if an application that is running within a container crashes, the container stops and that container will remain stopped until someone or something restarts it.

Changing Docker’s Default Behavior

It’s possible to automatically restart crashed containers by specifying a restart policy when initiating the container. To understand restart policies better, let’s see what happens when we use the always restart policy with this same container.
$ sudo docker run -d --name testing_restarts --restart always testing_restarts
8320e96172e4403cf6527df538fb7054accf3a55513deb12bb6a5535177c1f19
In the above command, we specified that Docker should apply the always restart policy to this container via the --restart flag. Let’s see what effect this has on our container by executing a docker ps again.
$ sudo docker ps
CONTAINER ID IMAGE COMMAND CREATED STATUS PORTS NAMES
8320e96172e4 testing_restarts "/bin/sh -c '/bin/bas" About a minute ago Up 21 seconds
This time we can see that the container is up and running but only for 21 seconds. If we run docker ps again, we will see something interesting.
$ sudo docker ps
CONTAINER ID IMAGE COMMAND CREATED STATUS PORTS NAMES
8320e96172e4 testing_restarts "/bin/sh -c '/bin/bas" About a minute ago Up 19 seconds
The second run shows the container has only been up for 19 seconds. This means that even though our application (crash.sh) continues to exit with an error, Docker is continuously restarting the container every time it exits.
Now that we understand how restart policies can be used to change Docker’s default behavior, let’s take a look at what restart policies Docker has available.

Docker’s Restart Policy(ies)

Docker currently has four restart policies:
  • no
  • on-failure
  • unless-stopped
  • always
The no policy is the default restart policy and simply does not restart a container under any circumstance.

Restarting on failure but stopping on success

The on-failure policy is a bit interesting as it allows you to tell Docker to restart a container if the exit code indicates error but not if the exit code indicates success. You can also specify a maximum number of times Docker will automatically restart the container.
Let’s try this restart policy out with our testing_restarts container and set a limit of 5 restarts.
$ sudo docker run -d --name testing_restarts --restart on-failure:5 testing_restarts
85ff2f096bac9965a9b8cffbb73c1642bf7b64a2173bbd145961231861b95819
If we run docker ps within a minute of launching the container, we will see that the container is running and has been recently started.
$ sudo docker ps
CONTAINER ID IMAGE COMMAND CREATED STATUS PORTS NAMES
85ff2f096bac testing_restarts "/bin/sh -c '/bin/bas" About a minute ago Up 8 seconds
The same will not be true, however, if we run the docker ps command 3 minutes after launching the container.
$ sudo docker ps-a
CONTAINER ID IMAGE COMMAND CREATED STATUS PORTS NAMES
85ff2f096bac testing_restarts "/bin/sh -c '/bin/bas"3 minutes ago Exited (1)20 seconds ago
We can see from the above that after 3 minutes the container is stopped. This is due to the fact that the container has been restarted more than our max-retries setting.

With success

The benefit of on-failures is that when an application exits with a successful exit code, the container will not be restarted. Let’s see this in action by making a quick minor change to the crash.sh script.
$ vi crash.sh
The change will be to set the exit code to 0.
#/bin/bash
sleep30
exit0
By setting the script to exit with a 0 exit code, we will be removing the error indicator from the script. Meaning as far as Docker can tell, this script will execute successfully every time.
With the script changed, we will need to rebuild the container before we can run it again.
$ sudo docker build -t testing_restarts ./
Sending build context to Docker daemon 3.072 kB
Step 1: FROM ubuntu:14.04
---> e36c55082fa6
Step 2: ADD crash.sh /
---> a4e7e4ad968f
Removing intermediate container 88115fe05456
Step 3: CMD /bin/bash/crash.sh
---> Running in fc8bbaffd9b9
---> 8aaa3d99f432
Removing intermediate container fc8bbaffd9b9
Successfully built 8aaa3d99f432
With the container image rebuilt, let’s launch this container again with the same on-failures and max-retries settings.
$ sudo docker run -d --name testing_restarts --restart on-failure:5 testing_restarts
f0052e0c509dfc1c1b112c3b3717c23bc66db980f222144ca1c9a6b51cabdc19
This time, when we perform a docker ps -a execution, we should see some different results.
$ sudo docker ps-a
CONTAINER ID IMAGE COMMAND CREATED STATUS PORTS NAMES
f0052e0c509d testing_restarts "/bin/sh -c '/bin/bas"41 seconds ago Exited (0)11 seconds ago
Since the crash.sh script exited with a successful exit code (0), Docker understood this as a success and did not restart the container.

Always restart the container

If we wanted the container to be restarted regardless of the exit code, we have a couple of restart policies we could use:
  • always
  • unless-stopped
The always restart policy tells Docker to restart the container under every circumstance. We experimented with the always restart policy earlier, but let’s see what happens when we restart the current container with the always restart policy.
$ sudo docker run -d --name testing_restarts --restart always testing_restarts
676f12c9cd4cac7d3dd84d8b70734119ef956b3e5100b2449197c2352f3c4a55
If we wait for a few minutes and run docker ps -a again, we should see that the container has been restarted even with the exit code showing success.
$ sudo docker ps-a
CONTAINER ID IMAGE COMMAND CREATED STATUS PORTS NAMES
9afad0ccd068 testing_restarts "/bin/sh -c '/bin/bas"4 minutes ago Up 22 seconds
What’s great about the always restart policy is that even if our Docker host was to crash on boot, the Docker service will restart our container. Let’s see this in action to fully appreciate why this is useful.
$ sudoreboot
By default or even with on-failures, our container would not be running on reboot. Which, depending on what task the container performs, may be problematic.
$ sudo docker ps-a
CONTAINER ID IMAGE COMMAND CREATED STATUS PORTS NAMES
676f12c9cd4c testing_restarts "/bin/sh -c '/bin/bas"9 minutes ago Up 2 seconds
With the always restart policy, that is not the case. The always restart policy will always restart the container. This is true even if the container has been stopped before the reboot. Let’s look at that scenario in action.
$ sudo docker stop testing_restarts
testing_restarts
$ sudoreboot
Before rebooting our system, we simply stopped the container. This means the container is still there, just not running. Once the system is back up after our reboot however, the container will be running.
$ sudo docker ps
CONTAINER ID IMAGE COMMAND CREATED STATUS PORTS NAMES
676f12c9cd4c testing_restarts "/bin/sh -c '/bin/bas"11 minutes ago Up 24 seconds
The reason our container is running after a reboot is because of the always policy. Whenever the Docker service is restarted, containers using the always policy will be restarted regardless of whether they were running or now.
The problem is that restarting a container that has been previously stopped after a reboot can be a bit problematic. What if our container was stopped for a valid reason, or worse, what if the container is out of date?
The solution for this is the unless-stopped restart policy.

Only stop when Docker is stopped

The unless-stopped restart policy behaves the same as always with one exception. When a container is stopped and the server is rebooted or the Docker service is restarted, the container will not be restarted.
Let’s see this in action by starting the container with the unless-stopped policy and repeating our last example.
$ sudo docker run -d --name testing_restarts --restart unless-stopped testing_restarts
fec5be52b9559b4f6421b10fe41c9c1dc3a16ff838c25d74238c5892f2b0b36
With the container running, let’s stop it and reboot the system again.
$ sudo docker stop testing_restarts
testing_restarts
$ sudoreboot
This time when the system restarts, we should see the container is in a stopped state.
$ sudo docker ps-a
CONTAINER ID IMAGE COMMAND CREATED STATUS PORTS NAMES
fec5be52b955 testing_restarts "/bin/sh -c '/bin/bas"2 minutes ago Exited (137) About a minute ago
One important item with unless-stopped is that if the container was running before the reboot, the container would be restarted once the system restarted. We can see this in action by restarting our container and rebooting the system again.
$ sudo docker start testing_restarts
testing_restarts
$ sudoreboot
After this reboot, the container should be running.
$ sudo docker ps-a
CONTAINER ID IMAGE COMMAND CREATED STATUS PORTS NAMES
fec5be52b955 testing_restarts "/bin/sh -c '/bin/bas"5 minutes ago Up 13 seconds testing_restarts
The difference between always and unless-stopped may be small, but in some environments this small difference may be a critical decision.

Selecting the Best Restart Policy

When selecting the best restart policy, it’s important to keep in mind what type of workload the container is performing.
A Redis instance, for example, may be a critical component in your environment which should have an always or unless-stopped policy. On the other hand, a batch-processing application may need to be restarted until the process successfully completes. In this case, it would make sense to use the on-failures policy.
Either way, with Docker’s restart policy you can now rest assured that next time a Docker host mysteriously reboots at 3 a.m., your containers will be restarted.

How to Use Incron to Monitor Important Files and Folders

$
0
0
https://www.linux.com/learn/how-use-incron-monitor-important-files-and-folders

incron
Incron can let you know when files or folder have been modified.
I’ve seen it happen: a Linux server is taken over by a rootkit and no one was the wiser...at least not until some errant behavior occurred or something outside of the company reported an oddity. After some serious digging, you find out the rootkit has modified a few files or directories and the damage has been done.
What if you knew of a tool that could monitor files for change and then report the changes within /var/log/syslog or take some action when a file was modified? There is such a tool.
Incron is similar to cron, but instead of running a command based on time, it can trigger commands when a file/directory event occurs (e.g., a modification to a file or to a file’s permissions). This makes it an outstanding tool to use for monitoring folders like /etc/apache2 or /usr/bin.
I’ll walk you through the process of installing and using Incron to monitor such a directory, so that you can always keep tabs on those crucial files and folders.

Installation

I’ll be installing Incron on the Ubuntu 16.04 platform. With one quick command, you can have the tool ready to go. Here’s how:
  1. Open up a terminal window
  2. Issue the command sudo apt-get install incron
  3. Type your sudo password and hit Enter
  4. Typey when/if prompted
  5. Allow the installation to complete

Initial Setup

Incron is similar to cron, in that you’ll use the incrontab command to create jobs for watching files/folders. Unlike cron, however, you must first specify who can actually use the tool (smart thinking by the developers). To set this up, you must add users to the /etc/incron.allow file. Say you want to enable the root user to use Incron. For this, you would open up /etc/incron.allow and add the following line:
root
List all of the users you want to give access to Incron, one user per line, in this file. Close the file and those users can now execute the incrontab command without error.

Incrontab Configuration

As you may have surmised, using incrontab is similar to using crontab. You would edit your incrontab file with the command incrontab -e. This command will open up the incrontab file for editing. How you use Incron now starts to veer away slightly from Cron. let’s see how.
The format of the incrontab looks like:
Let’s break that down.
  • — This is the path to the directory you want to watch. Do note the Incron is not capable of watching subdirectories. Only files within the path will be monitored. If you need subdirectories monitored, you must give them their own entry.
  • — This is one of several options:
    • IN_ACCESS File was accessed (read)
    • IN_ATTRIBMetadata changed (permissions, timestamps, extended attributes, etc.)
    • IN_CLOSE_WRITEFile opened for writing was closed
    • IN_CLOSE_NOWRITE File not opened for writing was closed
    • IN_CREATE File/directory created in watched directory
    • IN_DELETE File/directory deleted from watched directory
    • IN_DELETE_SELF Watched file/directory was itself deleted
    • IN_MODIFYFile was modified
    • IN_MOVE_SELF Watched file/directory was itself moved
    • IN_MOVED_FROMFile moved out of watched directory
    • IN_MOVED_TOFile moved into watched directory
    • IN_OPENFile was opened
  • — This is the command that will run should an event be triggered. In place of a command, you can always use wildcards. The wildcards will report basic information in syslog. The available wildcards are:
    • $$ Prints a dollar sign
    • $@  Add the watched filesystem path
    • $#   Add the event-related file name
    • $%  Add the event flags (textually)
    • $&  Add the  event flags (numerically)

Usage

Let’s set up a simple incrontab, using wildcards, and see how this works. First, let’s assume we’ve added the user olivia into the incron.allow file. We’ll create the folder /home/olivia/TEST and then run the command incrontab -e as user olivia. With the editor open, add the following line:
/home/olivia/TEST IN_MODIFY echo "$$ $@ $# $% $&"
Save the file and do the following:
  1. Open up a second terminal window and issue the command tail -f /var/log/syslog
  2. In the first terminal window, create the file /home/olivia/TEST/test
  3. Add some text to the file and save it
If you check the tail running on /var/log/syslog, you should see entries as shown in Figure 1.

incron_a.png

Incron
Figure 1: Incron watching the /home/olivia/TEST folder.
Although that clearly indicates to you that the contents of the TEST folder were modified, we can make this a bit more useful. Say, for example, you want to have your web server automatically shut down if the contents of /etc/apache2/apache2.conf are modified (it’s drastic, but illustrates the tool perfectly). For this, you would need to edit the root user’s Incrontab file.
Here’s what you would want to do. Open up a terminal window and issue the command sudo su. Enter your sudo password and then issue the command incrontab -e. With the Incrontab editor open, add the following:
/etc/apache2/apache2.conf IN_MODIFY /usr/sbin/service apache2 stop
Save and close the file. You can test this by opening the /etc/apache2/apache2.conf file and making some minor change. Save the edited file and your web server should immediately stop.
You could also have Incron watch multiple folders/files and employ the same action. Suppose you want to watch both the /etc/apache2/apache2.conf file and the /var/www/html/index.html file for changes. You could create two incrontab entries like so:
/etc/apache2/apache2.conf IN_MODIFY /usr/sbin/service apache2 stop

/var/www/html/index.html IN_MODIFY /usr/sbin/service apache2 stop
Should either file be modified, the web server will stop.
This, of course, is only a simple example of how you can make use of Incron. Get creative and see just how far you can bend the will of Incron to meet your needs. This is Linux, after all...it is ready be used in ways other platforms only dream of.
Viewing all 1417 articles
Browse latest View live


<script src="https://jsc.adskeeper.com/r/s/rssing.com.1596347.js" async> </script>