Quantcast
Channel: Sameh Attia
Viewing all 1413 articles
Browse latest View live

Linux lsblk Command Tutorial for Beginners (8 Examples)

$
0
0
https://www.howtoforge.com/linux-lsblk-command

In Linux, block devices are special files that refer to or represent a device (which could be anything from a hard drive to a USB drive). So naturally, there are command line tools that help you with your block devices-related work. Once such utility is lsblk.
In this tutorial, we will discuss this command using some easy to understand examples. But before we do that, it's worth mentioning that all examples mentioned here have been tested on an Ubuntu 18.04 LTS machine.

Linux lsblk command

The lsblk command in Linux lists block devices. Following is its syntax:
lsblk [options] [device...]
And here's how the tool's man page explains it:
       lsblk  lists  information  about  all  available or the specified block
       devices.  The lsblk command reads the sysfs filesystem and udev  db  to
       gather  information.  If  the udev db is not available or lsblk is com?
       piled without udev support than it tries  to  read  LABELs,  UUIDs  and
       filesystem  types  from the block device. In this case root permissions
       are necessary.

       The command prints all block devices (except RAM disks) in a  tree-like
       format  by  default.   Use  lsblk --help to get a list of all available
       columns.

       The default output, as well as the default  output  from  options  like
       --fs  and  --topology, is subject to change.  So whenever possible, you
       should avoid using default outputs in your scripts.  Always  explicitly
       define  expected columns by using --output columns-list in environments
       where a stable output is required.

       Note that lsblk might be executed in time when udev does not  have  all
       information  about recently added or modified devices yet. In this case
       it is recommended to use udevadm settle  before  lsblk  to  synchronize
       with udev
Following are some Q&A-styled examples that should give you a better idea on how lsblk works.

Q1. How to use lsblk command?

Basic usage is fairly simple - just execute 'lsblk' sans any option.
lsblk
Following is the output this command produced on my system:
How to use lsblk command
The first column lists device names, followed by corresponding major and minor device numbers, whether or not the device is removable (1 in case it is), size of the device, whether or not the device is read only, type of device (disk, partition, etc), and finally the device's mount point (if available).

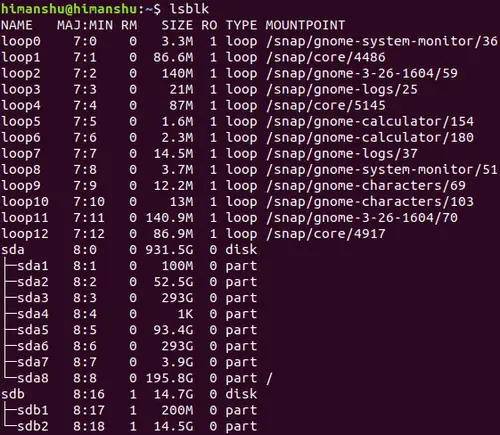
Q2. How to make lsblk display empty devices as well?

By default, the lsblk command only displays non-empty devices. However, you can force the tool to display empty devices as well. For this, use the -a command line option.
lsblk -a
For example in my case, the above command produced the following output:
How to make lsblk display empty devices as well
The 'loop 13' row is the new addition in this case.

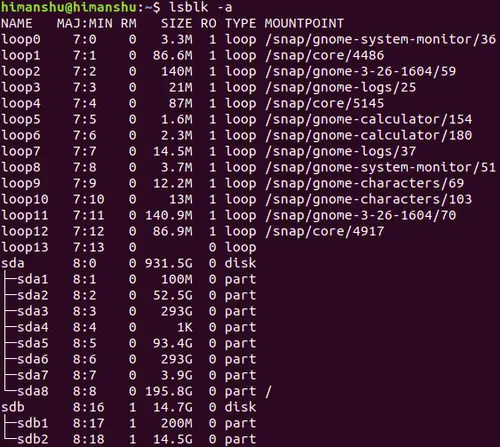
Q3. How to make lsblk print size info in bytes?

By default, lsblk prints size information in human readable form. While this good, there are times when you may need size in bytes. What's good is that there's an option (-b) that does this.
lsblk -b
Following is an example output:
How to make lsblk print size info in bytes
So you can see the 'Size' column now contains entries in bytes.

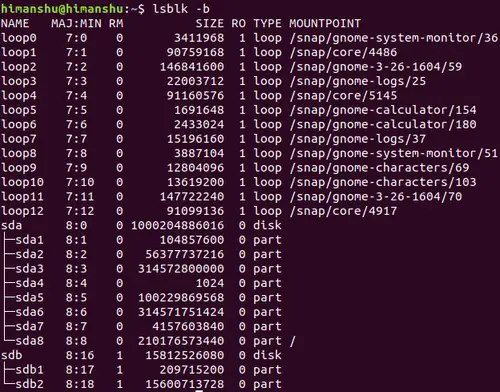
Q4. How to make lsblk print zone model for each device?

This you can do using the -z command line option.
lsblk -z
For example, here's the output the aforementioned command produced on my system:
NAME   ZONED
loop0  none
loop1  none
loop2  none
loop3  none
loop4  none
loop5  none
loop6  none
loop7  none
loop8  none
loop9  none
loop10 none
loop11 none
loop12 none
sda    none
??sda1 none
??sda2 none
??sda3 none
??sda4 none
??sda5 none
??sda6 none
??sda7 none
??sda8 none
sdb    none
??sdb1 none
??sdb2 none

Q5. How to make lsblk skip entries for slaves?

For this, you need to use the -d command line option, which tells lsblk to not print information related to holder devices  or  slaves.
lsblk -d
Here's an example output:
NAME   MAJ:MIN RM   SIZE RO TYPE MOUNTPOINT
loop0    7:0    0   3.3M  1 loop /snap/gnome-system-monitor/36
loop1    7:1    0  86.6M  1 loop /snap/core/4486
loop2    7:2    0   140M  1 loop /snap/gnome-3-26-1604/59
loop3    7:3    0    21M  1 loop /snap/gnome-logs/25
loop4    7:4    0    87M  1 loop /snap/core/5145
loop5    7:5    0   1.6M  1 loop /snap/gnome-calculator/154
loop6    7:6    0   2.3M  1 loop /snap/gnome-calculator/180
loop7    7:7    0  14.5M  1 loop /snap/gnome-logs/37
loop8    7:8    0   3.7M  1 loop /snap/gnome-system-monitor/51
loop9    7:9    0  12.2M  1 loop /snap/gnome-characters/69
loop10   7:10   0    13M  1 loop /snap/gnome-characters/103
loop11   7:11   0 140.9M  1 loop /snap/gnome-3-26-1604/70
loop12   7:12   0  86.9M  1 loop /snap/core/4917
sda      8:0    0 931.5G  0 disk
sdb      8:16   1  14.7G  0 disk
If you compare with output produced in previous cases, you can see no slave entries are produced in output in this case.

Q6. How to make lsblk use ascii characters for tree formatting?

By default, the type of tree formatting lsblk uses may not be user friendly in many cases. For example, copy-pasting it may cause formatting issues. So if you want, you can force the tool to use ascii characters for tree formatting, something which you can do using the -i command line option.
lsblk -i
Here's an example output:
NAME   MAJ:MIN RM   SIZE RO TYPE MOUNTPOINT
loop0    7:0    0   3.3M  1 loop /snap/gnome-system-monitor/36
loop1    7:1    0  86.6M  1 loop /snap/core/4486
loop2    7:2    0   140M  1 loop /snap/gnome-3-26-1604/59
loop3    7:3    0    21M  1 loop /snap/gnome-logs/25
loop4    7:4    0    87M  1 loop /snap/core/5145
loop5    7:5    0   1.6M  1 loop /snap/gnome-calculator/154
loop6    7:6    0   2.3M  1 loop /snap/gnome-calculator/180
loop7    7:7    0  14.5M  1 loop /snap/gnome-logs/37
loop8    7:8    0   3.7M  1 loop /snap/gnome-system-monitor/51
loop9    7:9    0  12.2M  1 loop /snap/gnome-characters/69
loop10   7:10   0    13M  1 loop /snap/gnome-characters/103
loop11   7:11   0 140.9M  1 loop /snap/gnome-3-26-1604/70
loop12   7:12   0  86.9M  1 loop /snap/core/4917
sda      8:0    0 931.5G  0 disk
|-sda1   8:1    0   100M  0 part
|-sda2   8:2    0  52.5G  0 part
|-sda3   8:3    0   293G  0 part
|-sda4   8:4    0     1K  0 part
|-sda5   8:5    0  93.4G  0 part
|-sda6   8:6    0   293G  0 part
|-sda7   8:7    0   3.9G  0 part
`-sda8   8:8    0 195.8G  0 part /
sdb      8:16   1  14.7G  0 disk
|-sdb1   8:17   1   200M  0 part
`-sdb2   8:18   1  14.5G  0 part
So you can see the output (see sda entries) now contains ASCII characters in tree formatting.

Q7. How to make lsblk display info about device owner, group, and mode?

This can be achieved using the -m command line option.
lsblk -m
Here's the output the aforementioned command produced in my case:
How to make lsblk display info about device owner, group, and mode

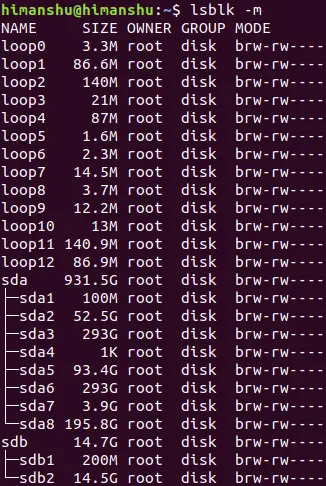
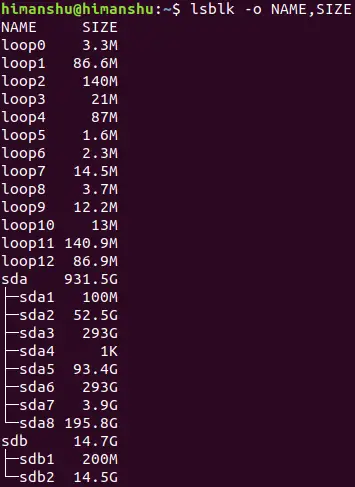
Q8. How to make lsblk output select columns?

If you want, you can also direct lsblk to output only select columns, something which you can do using the -o command line option (which requires you to pass a comma separated list of columns that you want to display).
For example:
lsblk -o NAME,SIZE
The aforementioned command produced the following output:
How to make lsblk output select columns

Conclusion

If your Linux work involves accessing information related to block devices, then lsblk is a must know command for you. Here, in this tutorial, we have discussed several command line option this tool offers. To know more about lsblk, head to its man page.

Understanding the State of Container Networking

$
0
0
http://www.enterprisenetworkingplanet.com/datacenter/understanding-the-state-of-container-networking.html

Containers have revolutionized the way applications are developed and deployed, but what about the network?

By Sean Michael Kerner | Posted Sep 4, 2018
 
Container networking is a fast moving space with lots of different pieces. In a session at the Open Source Summit, Frederick Kautz, principal software engineer at Red Hat outlined the state of container networking today and where it is headed in the future.


Containers have become increasingly popular in recent years, particularly the use of Docker containers, but what exactly are containers?

Kautz explained the containers make use of the Linux kernel's ability to allow for multiple isolated user space areas. The isolation features are enabled by two core elements cGroups and Namespaces. Control Groups (cGroups) limit and isolate the resource usage of process groups, while namespaces partition key kernel structures for process, hostname, users and network functions.

Container Networking Types


While there are different container technologies and orchestration systems, when it comes to networking, Kautz said there are really just four core networking primitives:

Bridge
Bridge mode is when networking is hooked into a specific bridge and everyone that is on the bridge will get the messages.

Host
Kautz explained that Host mode is basically where the container uses the same networking space as the host. As such, whatever IP address the host has, those addresses are then shared with the containers.

Overlay
In an Overlay networking approach, a virtual networking model sits on top of the underlay and the physical networking hardware.

Underlay
The Underlay approach makes use of core fabric and hardware network.

To make matters somewhat more confusing Kautz said that multiple container networking models are often used together, for example a bridge together with an overlay.

Network Connections

Additionally, container networking models can benefit from MACVLAN and IPVLANs which tie containers to specific mac or IP addresses, for additional isolation

 Kautz added that SR-IOV is a hardware mechanism that ties a physical Network Interface Card (NIC) to containers providing direct access.
Container Networking

SDNs

On top of the different container networking models are different approaches for Software Defined Networking. For the management plane, there are functionally two core approaches tat this point, the Container Networking Interface (CNI) which is what is used by Kubernetes and the libnetwork interface that is used by Docker.

Kautz noted that with Docker recently announcing support for Kubernetes, it's likely that CNI support will be following as well.

Among the different technologies for container networking today are:

Contiv - backed by Cisco and provides a VXLNA overlay model

Flannel/Calico - backed by Tigera provides an overlay network between each hosted and allocates a separate subnet per host.

Weave - backed by Weaveworks, uses standard port number for containers

Contrail - backed by Juniper networks and open sourced as the TungstenFabric project, provides policy support and gateway services.

OpenDaylight - open source effort that integrates with OpenStack Kuryr

OVN - open source effort that creates logical switches and routers.

Upcoming Efforts


While there are already multiple production grade solutions for container networking, the technology continues to evolve. Among the newer approach is using eBPF (extended Berkeley Packet Filter) for networking control, which is used by the Cilium open source project.

Additionally there is an effort to use shared memory, rather than physical NICs to help enable networking. Kautz also highlighted the emerging area of service mesh technology, in particular the Istio project, which is backed by Google. With a service mesh, networking is offloaded to the mesh, which provides load balancing, failure recovery and service discovery among other capabilities.

Organizations today typically choose a single SDN approach that will connect into a Kubernetes CNI, but that could change in the future thanks to the Multus CNI effort. With Multus CNI multiple CNI plugins can be used, enabling multiple SDN technologies to run in a Kubernetes cluster.

Sean Michael Kerner is a senior editor at EnterpriseNetworkingPlanet and InternetNews.com. Follow him on Twitter @TechJournalist.

Turn your vim editor into a productivity powerhouse

$
0
0
https://opensource.com/article/18/9/vi-editor-productivity-powerhouse

These 20+ useful commands will enhance your experience using the vim editor.

a checklist for a team
Image by : 
opensource.com
x

Get the newsletter

Join the 85,000 open source advocates who receive our giveaway alerts and article roundups.
Editor's note: The headline and article originally referred to the "vi editor." It has been updated to the correct name of the editor: "vim."
A versatile and powerful editor, vim includes a rich set of potent commands that make it a popular choice for many users. This article specifically looks at commands that are not enabled by default in vim but are nevertheless useful. The commands recommended here are expected to be set in a vim configuration file. Though it is possible to enable commands individually from each vim session, the purpose of this article is to create a highly productive environment out of the box.

Before you begin

The commands or configurations discussed here go into the vim startup configuration file, vimrc, located in the user home directory. Follow the instructions below to set the commands in vimrc:
(Note: The vimrc file is also used for system-wide configurations in Linux, such as /etc/vimrc or /etc/vim/vimrc. In this article, we'll consider only user-specific vimrc, present in user home folder.)
In Linux:
  • Open the file with vi $HOME/.vimrc
  • Type or copy/paste the commands in the cheat sheet at the end of this article
  • Save and close (:wq)
In Windows:
  • First, install gvim
  • Open gvim
  • Click Edit --> Startup settings, which opens the _vimrc file
  • Type or copy/paste the commands in the cheat sheet at the end of this article
  • Click File --> Save
Let's delve into the individual vi productivity commands. These commands are classified into the following categories:
  1. Indentation & Tabs
  2. Display & Format
  3. Search
  4. Browse & Scroll
  5. Spell
  6. Miscellaneous

1. Indentation & Tabs

To automatically align the indentation of a line in a file:
set autoindent
Smart Indent uses the code syntax and style to align:
set smartindent
Tip: vim is language-aware and provides a default setting that works efficiently based on the programming language used in your file. There are many default configuration commands, including axs cindent, cinoptions, indentexpr, etc., which are not explained here. syn is a helpful command that shows or sets the file syntax.
To set the number of spaces to display for a tab:
set tabstop=4
To set the number of spaces to display for a “shift operation” (such as ‘>>’ or ‘<<’):
set shiftwidth=4
If you prefer to use spaces instead of tabs, this option inserts spaces when the Tab key is pressed. This may cause problems for languages such as Python that rely on tabs instead of spaces. In such cases, you may set this option based on the file type (see autocmd).
set expandtab

2. Display & Format

To show line numbers:
set number
To wrap text when it crosses the maximum line width:
set textwidth=80
To wrap text based on a number of columns from the right side:
set wrapmargin=2
To identify open and close brace positions when you traverse through the file:
set showmatch

3. Search

To highlight the searched term in a file:
set hlsearch
To perform incremental searches as you type:
set incsearch
To search ignoring case (many users prefer not to use this command; set it only if you think it will be useful):
set ignorecase
To search without considering ignorecase when both ignorecase and smartcase are set and the search pattern contains uppercase:
set smartcase
For example, if the file contains: test
Test
When both ignorecase and smartcase are set, a search for “test” finds and highlights both:
test
Test
A search for “Test” highlights or finds only the second line:
test
Test

4. Browse & Scroll

For a better visual experience, you may prefer to have the cursor somewhere in the middle rather than on the first line. The following option sets the cursor position to the 5th row.
set scrolloff=5
Example:
The first image is with scrolloff=0 and the second image is with scrolloff=5.                                                                                                                                                                       
Tip: set sidescrolloff is useful if you also set nowrap.
To display a permanent status bar at the bottom of the vim screen showing the filename, row number, column number, etc.:
set laststatus=2

5. Spell

vim has a built-in spell-checker that is quite useful for text editing as well as coding. vim recognizes the file type and checks the spelling of comments only in code. Use the following command to turn on spell-check for the English language:
set spell spelllang=en_us

6. Miscellaneous

Disable creating backup file: When this option is on, vim creates a backup of the previous edit. If you do not want this feature, disable it as shown below. Backup files are named with a tilde (~) at the end of the filename.
set nobackup
Disable creating a swap file: When this option is on, vim creates a swap file that exists until you start editing the file. Swapfile is used to recover a file in the event of a crash or a use conflict. Swap files are hidden files that begin with . and end with .swp.
set noswapfile
Suppose you need to edit multiple files in the same vim session and switch between them. An annoying feature that's not readily apparent is that the working directory is the one from which you opened the first file. Often it is useful to automatically switch the working directory to that of the file being edited. To enable this option:
set autochdir
vim maintains an undo history that lets you undo changes. By default, this history is active only until the file is closed. vim includes a nifty feature that maintains the undo history even after the file is closed, which means you may undo your changes even after the file is saved, closed, and reopened. The undo file is a hidden file saved with the .un~ extension.
set undofile
To set audible alert bells (which sound a warning if you try to scroll beyond the end of a line):
set errorbells
If you prefer, you may set visual alert bells:
set visualbell

Bonus

vim provides long-format as well as short-format commands. Either format can be used to set or unset the configuration.
Long format for the autoindent command:
set autoindent
Short format for the autoindent command:
set ai
To see the current configuration setting of a command without changing its current value, use ? at the end:
set autoindent?
To unset or turn off a command, most commands take no as a prefix:
set noautoindent
It is possible to set a command for one file but not for the global configuration. To do this, open the file and type :, followed by the set command. This configuration is effective only for the current file editing session.
For help on a command:
:help autoindent
Note: The commands listed here were tested on Linux with Vim version 7.4 (2013 Aug 10) and Windows with Vim 8.0 (2016 Sep 12).
These useful commands are sure to enhance your vim experience. Which other commands do you recommend?

Cheat sheet

Copy/paste this list of commands in your vimrc file:


" Indentation & Tabs


set autoindent


set smartindent


set tabstop=4


set shiftwidth=4


set expandtab


set smarttab


" Display & format


set number


set textwidth=80


set wrapmargin=2


set showmatch


" Search


set hlsearch


set incsearch


set ignorecase


set smartcase


" Browse & Scroll


set scrolloff=5


set laststatus=2


" Spell


set spell spelllang=en_us


" Miscellaneous


set nobackup


set noswapfile


set autochdir


set undofile


set visualbell


set errorbells


6 open source tools for making your own VPN

$
0
0
https://opensource.com/article/18/8/open-source-tools-vpn

Want to try your hand at building your own VPN but aren’t sure where to start?

scrabble letters used to spell "VPN"
Image credits : 
x

Get the newsletter

Join the 85,000 open source advocates who receive our giveaway alerts and article roundups.
If you want to try your hand at building your own VPN but aren’t sure where to start, you’ve come to the right place. I’ll compare six of the best free and open source tools to set up and use a VPN on your own server. These VPNs work whether you want to set up a site-to-site VPN for your business or just create a remote access proxy to unblock websites and hide your internet traffic from ISPs.
Which is best depends on your needs and limitations, so take into consideration your own technical expertise, environment, and what you want to achieve with your VPN. In particular, consider the following factors:
  • VPN protocol
  • Number of clients and types of devices
  • Server distro compatibility
  • Technical expertise required

Algo

Algo was designed from the bottom up to create VPNs for corporate travelers who need a secure proxy to the internet. It “includes only the minimal software you need,” meaning you sacrifice extensibility for simplicity. Algo is based on StrongSwan but cuts out all the things that you don’t need, which has the added benefit of removing security holes that a novice might otherwise not notice.
As an added bonus, it even blocks ads! Algo supports only the IKEv2 protocol and Wireguard. Because IKEv2 support is built into most devices these days, it doesn’t require a client app like OpenVPN. Algo can be deployed using Ansible on Ubuntu (the preferred option), Windows, RedHat, CentOS, and FreeBSD. Setup is automated using Ansible, which configures the server based on your answers to a short set of questions. It’s also very easy to tear down and re-deploy on demand.
Algo is probably the easiest and fastest VPN to set up and deploy on this list. It’s extremely tidy and well thought out. If you don’t need any of the more advanced features offered by other tools and just need a secure proxy, it’s a great option. Note that Algo explicitly states it’s not meant for geo-unblocking or evading censorship, and was primarily designed for confidentiality.

Streisand

Streisand can be installed on any Ubuntu 16.04 server using a single command; the process takes about 10 minutes. It supports L2TP, OpenConnect, OpenSSH, OpenVPN, Shadowsocks, Stunnel, Tor bridge, and WireGuard. Depending on which protocol you choose, you may need to install a client app.
In many ways, Streisand is similar to Algo, but it offers more protocols and customization. This takes a bit more effort to manage and secure but is also more flexible. Note Streisand does not support IKEv2. I would say Streisand is more effective for bypassing censorship in places like China and Turkey due to its versatility, but Algo is easier and faster to set up.
The setup is automated using Ansible, so there’s not much technical expertise required. You can easily add more users by sending them custom-generated connection instructions, which include an embedded copy of the server’s SSL certificate.
Tearing down Streisand is a quick and painless process, and you can re-deploy on demand.

OpenVPN

OpenVPN requires both client and server applications to set up VPN connections using the protocol of the same name. OpenVPN can be tweaked and customized to fit your needs, but it also requires the most technical expertise of the tools covered here. Both remote access and site-to-site configurations are supported; the former is what you’ll need if you plan on using your VPN as a proxy to the internet. Because client apps are required to use OpenVPN on most devices, the end user must keep them updated.
Server-side, you can opt to deploy in the cloud or on your Linux server. Compatible distros include CentOS, Ubuntu, Debian, and openSUSE. Client apps are available for Windows, MacOS, iOS, and Android, and there are unofficial apps for other devices. Enterprises can opt to set up an OpenVPN Access Server, but that’s probably overkill for individuals, who will want the Community Edition.
OpenVPN is relatively easy to configure with static key encryption, but it isn’t all that secure. Instead, I recommend setting it up with easy-rsa, a key management package you can use to set up a public key infrastructure. This allows you to connect multiple devices at a time and protect them with perfect forward secrecy, among other benefits. OpenVPN uses SSL/TLS for encryption, and you can specify DNS servers in your configuration.
OpenVPN can traverse firewalls and NAT firewalls, which means you can use it to bypass gateways and firewalls that might otherwise block the connection. It supports both TCP and UDP transports.

StrongSwan

You might have come across a few different VPN tools with “Swan” in the name. FreeS/WAN, OpenSwan, LibreSwan, and strongSwan are all forks of the same project, and the lattermost is my personal favorite. Server-side, strongSwan runs on Linux 2.6, 3.x, and 4x kernels, Android, FreeBSD, macOS, iOS, and Windows.
StrongSwan uses the IKEv2 protocol and IPSec. Compared to OpenVPN, IKEv2 connects much faster while offering comparable speed and security. This is useful if you prefer a protocol that doesn’t require installing an additional app on the client, as most newer devices manufactured today natively support IKEv2, including Windows, MacOS, iOS, and Android.
StrongSwan is not particularly easy to use, and despite decent documentation, it uses a different vocabulary than most other tools, which can be confusing. Its modular design makes it great for enterprises, but that also means it’s not the most streamlined. It’s certainly not as straightforward as Algo or Streisand.
Access control can be based on group memberships using X.509 attribute certificates, a feature unique to strongSwan. It supports EAP authentication methods for integration into other environments like Windows Active Directory. StrongSwan can traverse NAT firewalls.

SoftEther

SoftEther started out as a project by a graduate student at the University of Tsukuba in Japan. SoftEther VPN Server and VPN Bridge run on Windows, Linux, OSX, FreeBSD, and Solaris, while the client app works on Windows, Linux, and MacOS. VPN Bridge is mainly for enterprises that need to set up site-to-site VPNs, so individual users will just need the server and client programs to set up remote access.
SoftEther supports the OpenVPN, L2TP, SSTP, and EtherIP protocols, but its own SoftEther protocol claims to be able to be immunized against deep packet inspection thanks to “Ethernet over HTTPS” camouflage. SoftEther also makes a few tweaks to reduce latency and increase throughput. Additionally, SoftEther includes a clone function that allows you to easily transition from OpenVPN to SoftEther.
SoftEther can traverse NAT firewalls and bypass firewalls. On restricted networks that permit only ICMP and DNS packets, you can utilize SoftEther’s VPN over ICMP or VPN over DNS options to penetrate the firewall. SoftEther works with both IPv4 and IPv6.
SoftEther is easier to set up than OpenVPN and strongSwan but is a bit more complicated than Streisand and Algo.

WireGuard

WireGuard is the newest tool on this list; it's so new that it’s not even finished yet. That being said, it offers a fast and easy way to deploy a VPN. It aims to improve on IPSec by making it simpler and leaner like SSH.
Like OpenVPN, WireGuard is both a protocol and a software tool used to deploy a VPN that uses said protocol. A key feature is “crypto key routing,” which associates public keys with a list of IP addresses allowed inside the tunnel.
WireGuard is available for Ubuntu, Debian, Fedora, CentOS, MacOS, Windows, and Android. WireGuard works on both IPv4 and IPv6.
WireGuard is much lighter than most other VPN protocols, and it transmits packets only when data needs to be sent.
The developers say WireGuard should not yet be trusted because it hasn’t been fully audited yet, but you’re welcome to give it a spin. It could be the next big thing!

Homemade VPN vs. commercial VPN

Making your own VPN adds a layer of privacy and security to your internet connection, but if you’re the only one using it, then it would be relatively easy for a well-equipped third party, such as a government agency, to trace activity back to you.
Furthermore, if you plan to use your VPN to unblock geo-locked content, a homemade VPN may not be the best option. Since you’ll only be connecting from a single IP address, your VPN server is fairly easy to block.
Good commercial VPNs don’t have these issues. With a provider like ExpressVPN, you share the server’s IP address with dozens or even hundreds of other users, making it nigh-impossible to track a single user’s activity. You also get a huge range of hundreds or thousands of servers to choose from, so if one has been blacklisted, you can just switch to another.
The tradeoff of a commercial VPN, however, is that you must trust the provider not to snoop on your internet traffic. Be sure to choose a reputable provider with a clear no-logs policy.

Linux Kernel Vs. Mac Kernel

$
0
0
http://www.linuxandubuntu.com/home/difference-between-linux-kernel-mac-kernel

Difference Between Linux Kernel & Mac Kernel
Both the Linux kernel and the macOS kernel are UNIX-based. Some people say that macOS is "linux", some say that both are compatible due to similarities between commands and file system hierarchy. Today I want to show a little of both, showing the differences and similarities between Linux Kernel & Mac kernel like I mentioned in previous Linux kernel articles.

Kernel of macOS

In 1985, Steve Jobs left Apple due to a disagreement with CEO John Sculley and Apple's board of directors. He then founded a new computer company called NeXT. Jobs wanted a new computer (with a new operating system) to be released quickly. To save time, the NeXT team used the Carnegie Mellon Mach kernel and parts of the BSD code base to create theNeXTSTEP operating system.
NeXTSTEP desktop operating system
NeXT has never become a financial success, in part due to Jobs's habit of spending money as if he were still at Apple. Meanwhile, Apple tried unsuccessfully to update its operating system on several occasions, even partnering with IBM. In 1997, Apple bought NeXT for $429 million. As part of the deal, Steve Jobs returned to Apple and NeXTSTEP became the foundation of macOS and iOS.

Linux kernel

Unlike the macOS kernel, Linux was not created as part of a commercial enterprise. Instead, it was created in 1991 by computer student Linus Torvalds. Originally, the kernel was written according to the specifications of Linus's computer because he wanted to take advantage of his new 80386 processor. Linus posted the code for his new kernel on the web in August 1991. Soon, he was receiving code and resource suggestions Worldwide. The following year, Orest Zborowski ported the X Windows System to Linux, giving it the ability to support a graphical user interface.

MacOS kernel resources

The macOS kernel is officially known as XNU. The acronym stands for "XNU is Not Unix." According to Apple's official Github page, XNU is "a hybrid kernel that combines the Mach kernel developed at Carnegie Mellon University with FreeBSD and C++ components for the drivers." The BSD subsystem part of the code is "normally implemented as userspace servers in microkernel systems". The Mach part is responsible for low-level work such as multitasking, protected memory, virtual memory management, kernel debugging support, and console I/O.
macos kernel resources
Map of MacOS: the heart of everything is called Darwin; and within it, we have separate system utilities and the XNU kernel, which is composed in parts by the Mach kernel and by the BSD kernel.

Unlike Linux, this kernel is split into what they call the hybrid kernel, allowing one part of it to stop for maintenance, while another continues to work. In several debates this also opened the question of the fact that a hybrid kernel is more stable; if one of its parts stops, the other can start it again.

Linux kernel resources

While the macOS kernel combines the capabilities of a microkernel with Mach and a monolithic kernel like BSD, Linux is just a monolithic kernel. A monolithic kernel is responsible for managing CPU, memory, inter-process communication, device drivers, file system, and system service calls. That is, it does everything without subdivisions.

Obviously, this has already garnered much discussion even with Linus himself and other developers, who claim that a monolithic kernel is more susceptible to errors besides being slower; but Linux is the opposite of this every year, and can be optimized as a hybrid kernel. In addition, with the help ofRedHat, the kernel now includes a Live Patch that allows real-time maintenance with no reboot required.

Differences between MacOS Kernel (XNU) and Linux

  1. The MacOS kernel (XNU) has existed for longer than Linux and was based on a combination of two even older code bases. This weighs in favor, for stability and history.
  2. On the other hand, Linux is newer, written from scratch and used on many other devices; so much that it is present in all 500 best among the best supercomputers and in the recently inaugurated North American supercomputer.

​In the system scope, we do not have a package manager via the command line in the macOS terminal.
The installation of the packages in .pkg format - such as BSD - is via this command line, if not through the GUI:
$ sudo installer -pkg /path/to/package.pkg -target /
NOTE: MacOS .pkg is totally different from BSD .pkg!
Do not think that macOS supports BSD programs and vice versa. It does not support and does not install.
You can have a command equivalent to apt in macOS, under 2 options: InstallingHomebreworMacPorts. In the end, you will have the following syntax:
$ brew install PACKAGE
$ port install PACKAGE
Remember that not all programs/packages available for Linux or BSD will be in MacOS Ports.

Compatibility

In terms of compatibility, there is not much to say; the Darwin core and the Linux kernel are as distinct as comparing the Windows NT kernel with the BSD kernel. Drivers written for Linux do not run on macOS and vice versa. They must be compiled beforehand; Curiously, Linux has a series of macOS daemons, including the CUPS print server!

What we have in common compatibility are, in fact, terminal tools like GNU Utils packages or Busybox, so we have not only BASH but also gcc, rm, dd, top, nano, vim, etc. And this is intrinsic to all UNIX-based applications. In addition, we have the filesystem folders architecture, common folders common to root in/, / lib, / var, / etc, / dev, and so on.

Conclusion

MacOS and Linux have their similarities and differences, just like BSD compared to Linux. But because they are based on UNIX, they share patterns that make them familiar to the environment. Those who use Linux and migrate pro macOS or vice versa will be familiar with a number of commands and features. The most striking difference would be the graphical interface, whose problem would be a matter of personal adaptation.

File Timestamps in Linux: atime, mtime, ctime Explained

$
0
0
https://linuxhandbook.com/file-timestamps

Let’s see what are the various kinds of file timestamps in Linux, how to see the timestamps for a file and how to change the timestamps.
In Linux, every file has some timestamps that provide some crucial analytics about when the file or its attributes were modified or changed. Let’s see these timestamps in detail.

What are Linux timestamps?

File timestamps in Linux
Any file in Linux has typically these three timestamps:
  • atime – access time
  • mtime – modify time
  • ctime – change time

atime

atime stands for access time. This timestamp tells you when was the last time the file was accessed. By access, it means if you used cat, vim, less or some other tool to read or display the content of the file.

mtime

mtime stands for modify time. This timestamp tells you when was the last time the file was modified. By modify, it means if the contents of a file were changed by editing the file.

ctime

ctime stands for status change time. This timestamp tells you when was the last time the property and metadata of the file were changed. The metadata includes file permissions, ownership, name and location of the file.

How to see the timestamps of a file?

You can use the stat command to see all the timestamps of a file. Using stat command is very simple. You just need to provide the filename with it.
stat 
The output will be like this:
stat abhi.txt 
File: abhi.txt
Size: 0 Blocks: 0 IO Block: 4096 regular empty file
Device: 10305h/66309d Inode: 11936465 Links: 1
Access: (0644/-rw-r--r--) Uid: ( 1000/abhishek)   Gid: ( 1000/abhishek)
Access: 2018-08-30 12:19:54.262153704 +0530
Modify: 2018-08-30 12:19:54.262153704 +0530
Change: 2018-08-30 12:19:54.262153704 +0530
Birth: -
You can see all three timestamps (access, modify and change) time in the above output. All three timestamps are the same here because I just created this empty file with touch command.
Now let’s modify these timestamps.
If I use the less command to read the file, it will change only the access time because the content and metadata of the file remain the same.
$ less abhi.txt 
$ stat abhi.txt
File: abhi.txt
Size: 0 Blocks: 0 IO Block: 4096 regular empty file
Device: 10305h/66309d Inode: 11936465 Links: 1
Access: (0644/-rw-r--r--) Uid: ( 1000/abhishek)   Gid: ( 1000/abhishek)
Access: 2018-08-30 12:25:13.794471295 +0530
Modify: 2018-08-30 12:19:54.262153704 +0530
Change: 2018-08-30 12:19:54.262153704 +0530
Birth: -
Now let’s change the modify time. I’ll use cat command to add new text to this file. This will prevent the change in access time.
$ cat >> abhi.txt 
demo text
^C
$ stat abhi.txt
File: abhi.txt
Size: 10 Blocks: 8 IO Block: 4096 regular file
Device: 10305h/66309d Inode: 11936465 Links: 1
Access: (0644/-rw-r--r--) Uid: ( 1000/abhishek) Gid: ( 1000/abhishek)
Access: 2018-08-30 12:25:13.794471295 +0530
Modify: 2018-08-30 12:32:34.751320967 +0530
Change: 2018-08-30 12:32:34.751320967 +0530
Birth: -
Did you notice something weird? You modified the file and expected the mtime to be changed but it also changed the ctime.
Remember, ctime is always changed with mtime. It’s because while mtime is under the control of user, ctime is controlled by the system. It represents when the last time the data blocks or metadata of a file was changed. If you modify the file, the data blocks change and thus ctime is changed.
You can change ctime alone by modifying file permissions using chmod or chgrp commands but you cannot modify mtime without modifying ctime.
You can also not change ctime in the past by normal means. It is a kind of security feature because it tells you the last time the file was changed. Even if someone modifies mtime and set it in the past for malicious purposes, ctime will indicate the actual time when the mtime was changed.
Remember: ctime will always be modified by mtime change.

What are the usage of file timestamps?

It helps a lot in analyzing. There could be a number of situations where you need to refer to the timestamps of a file. For example, you can see if a file was modified recently or not when it was supposed to be modified.
One of my favorite use was to locate log files of an application with mtime. Run the application and just go into the parent directory of the application and search for the files that have been modified in last few minutes.
I already showed you above that it can also help in analyzing if someone accessed the files or modified it maliciously. Timestamps play an important role in such situations.

How to know when a file was originally created?

Did you notice the last line of stat command output? It says ‘Birth’. You may guess that this represents the timestmap when the file was ‘born’ (or created to be more precise).
Actually, there is one more timestamp called creation time (cr). Not all filesystems support this timestamp. Ext4 is one of the popular Linux filesystems and though it supports the creation timestamp, the stat command at present is not able to show it. Maybe the future versions of stat command will show the creation timestamp in the Birth section.

How to Kill a Process in Linux

$
0
0
https://linuxize.com/post/how-to-kill-a-process-in-linux

Have you ever faced the situation where you launched an application and suddenly while you are using the application it becomes unresponsive and unexpectedly crashes. You try to start the application again, but nothing happens because the original application process never truly shut down completely.
Well it has happened to all of us at some point, hasn’t it? The solution is to terminate or kill the application process. But how?
Luckily, there are several utilities in linux that allows us to the kill errant processes.
In this tutorial we will show you how to use kill and killall utilities to terminate a process in Linux. The main difference between these two tools is that killall terminates running processes based on name, while the kill terminates processes based on Process ID number (PID).
Regular users can kill their own processes, but not those that belong to other users, while the root user can kill all processes.
kill and killall can send a specified signal to a specified processes or process groups. When used without a signal both tools will send -15 (-TERM).
The most commonly used signals are:
  • 1 (-HUP): to restart a process.
  • 9 (-KILL): to kill a process.
  • 15 (-TERM): to gracefully stop a process.
Signals can be specified in three different ways:
  • using number (e.g., -1)
  • with the “SIG” prefix (e.g., -SIGHUP)
  • without the “SIG” prefix (e.g., -HUP).
Use the -l option to list all available signals:
kill -l  # or killall -l
Copy
The steps outlined below will work on all Linux distributions.
Advertisement

Killing processes with the kill command

In order to terminate a process with the kill command, first we need to find the process PID. We can do this through several different commands such as top, ps, pidof and pgrep.
Let’s say our Firefox browser has become unresponsive and we need to kill the Firefox process. To find the process PID we can use the pidof command:
pidof firefox
Copy
The command above will print all Firefox processes:
2551 2514 1963 1856 1771
Copy
Once we know the Firefox processes PIDs we can kill all of them with:
kill -9 2551 2514 1963 1856 1771
Copy

Killing processes with the killall command

The killall command terminates all programs that match a specified name.
Using the same scenario as before, we can kill the Firefox process by typing:
killall -9 firefox
Copy
The killall command accepts several options such as specifying processes running as user, using regular expresion and killing processes younger or older than specified time. You can get a list of all options by typing killall (without any arguments).
For example if we want to terminate all processes running as a user sara we would run the following command:
killall -u sara
Copy

Conclusion

In this tutorial, you learned how to stop unresponsive programs using the kill and killall tools.

How To View A Particular Package Installed/Updated/Upgraded/Removed/Erased Date On Linux

$
0
0
https://www.2daygeek.com/how-to-view-a-particular-package-installed-updated-upgraded-removed-erased-date-on-linux

I can damn sure installing, updating and removing packages in Linux system is one of the routine activity for Linux administrator, also they need to push a security updates to Linux system when it requires.
For this whole activity, package manager is playing the major role and we can’t perform all these action without a package manager.
If you would like to know when the package has installed or updated or erased then you are in the right page to get the information.
In this tutorial you will be learning about the package activity such as installed date, package updated date, package erased date, package removed date, and who had performed that action.
All the package managers are doing the same work but their functionality is different compared with others. We had already written all of these in the past. If you would like to check these then go to the corresponding URL which is listed below.
All the package managers are allowing us to install a new package, update a existing packages, remove un-wanted packages, erase obsolete packages, etc.,
Below are the famous package managers for Linux.

How To View Package Installed/Updated/Erased Date In CentOS/RHEL Systems

RHEL and CentOS systems are using YUM package manager hence we can use the yum.log file and yum history command to get this information.
YUM stands for Yellowdog Updater, Modified is an open-source command-line front-end package-management utility for RPM based systems such as Red Hat Enterprise Linux (RHEL) and CentOS.
Yum is the primary tool for getting, installing, deleting, querying, and managing RPM packages from distribution repositories, as well as other third-party repositories.
If you would like to check the package installed date, just run the following command format and change the package that you want to check. Here we are going to check the htop package installed date.
# grep -i installed /var/log/yum.log | grep htop
May 03 08:40:22 Installed: htop-1.0.3-1.el6.x86_64
To view package updated date, just run the following command format.
# grep -i updated /var/log/yum.log | grep java
May 08 08:13:15 Updated: 1:java-1.8.0-openjdk-headless-1.8.0.171-3.b10.el6_9.x86_64
May 08 08:13:15 Updated: 1:java-1.8.0-openjdk-1.8.0.171-3.b10.el6_9.x86_64
To view package removed/erased date, just run the following command format.
# grep -i erased: /var/log/yum.log | grep epel-release
May 17 17:38:41 Erased: epel-release
If you would like to see all together in the single output, just run the following command format.
# grep "java" /var/log/yum.log
Apr 19 03:47:53 Installed: tzdata-java-2018d-1.el6.noarch
Apr 19 03:48:00 Installed: 1:java-1.8.0-openjdk-headless-1.8.0.161-3.b14.el6_9.x86_64
Apr 19 03:48:00 Installed: 1:java-1.8.0-openjdk-1.8.0.161-3.b14.el6_9.x86_64
May 08 08:13:15 Updated: 1:java-1.8.0-openjdk-headless-1.8.0.171-3.b10.el6_9.x86_64
May 08 08:13:15 Updated: 1:java-1.8.0-openjdk-1.8.0.171-3.b10.el6_9.x86_64

How To View Package Installed Date In CentOS/RHEL Systems

Alternatively we can check the package latest installed date using rpm command.
RPM stands for RPM Package Manager formerly known as Red Hat Package Manager is a powerful package management system for Red Hat Enterprise Linux (RHEL) as well as other Linux distribution such as Fedora, CentOS, and openSUSE. RPM maintains a database of installed packages and their files, so you can invoke powerful queries and verification’s on your system.
To view the latest installed date of package, just run the following rpm command format.
# rpm -qi nano | grep "Install Date"
Install Date: Fri 03 Mar 2017 08:57:47 AM EST Build Host: c5b2.bsys.dev.centos.org
Alternatively use rpm with qi option to view the latest installed date of package.
# rpm -qa --last | grep htop
htop-1.0.3-1.el6.x86_64 Thu 03 May 2018 08:40:22 AM EDT
Alternatively use rpm with q option alone to view the latest installed date of package.
# rpm -q epel-release --last
epel-release-6-8.noarch Fri 18 May 2018 10:33:06 AM EDT

How To View Package Installed/Updated/Erased Date In CentOS/RHEL Systems

Also we can check the package installed or updated or removed or erased date using
yum history command.
Use yum history command, if you want to list what are the packages that has installed/updated/erased in the particular date.
# yum history
Loaded plugins: fastestmirror, security
ID | Login user | Date and time | Action(s) | Altered
-------------------------------------------------------------------------------
27 | root | 2018-07-22 00:19 | Install | 1
26 | root | 2018-07-20 00:24 | Install | 1
25 | root | 2018-05-18 10:35 | Install | 1
24 | root | 2018-05-18 10:33 | Install | 1
23 | root | 2018-05-17 17:38 | Erase | 3
22 | root | 2018-05-10 04:12 | Install | 1
21 | root | 2018-05-09 05:25 | Erase | 2
20 | root | 2018-05-09 05:24 | Install | 2
19 | root | 2018-05-09 05:19 | Install | 1
18 | root | 2018-05-09 05:08 | Install | 2
17 | root | 2018-05-09 05:05 | Erase | 1
16 | root | 2018-05-08 08:18 | Install | 3
15 | root | 2018-05-08 08:17 | Install | 8
14 | root | 2018-05-08 08:13 | Update | 2
13 | root | 2018-05-08 08:12 | Install | 4
12 | root | 2018-05-08 08:12 | Install | 2
11 | root | 2018-05-03 08:44 | Install | 2
10 | root | 2018-05-03 08:40 | Install | 1
9 | root | 2018-04-26 12:30 | Install | 30
8 | root | 2018-04-26 08:11 | Install | 69
To view detailed information, just use the corresponding yum transaction ID.
# yum history info 27
Loaded plugins: fastestmirror, security
Transaction ID : 27
Begin time : Sun Jul 22 00:19:51 2018
Begin rpmdb : 574:7545d911e1217a575a723f63b02dd71262f9ccbb
End time : 00:19:52 2018 (1 seconds)
End rpmdb : 575:0861abf520414edea27be5a28796827ff65d155a
User : root
Return-Code : Success
Command Line : localinstall oracleasm-support-2.1.8-1.el6.x86_64.rpm
Transaction performed with:
Installed rpm-4.8.0-55.el6.x86_64 @anaconda-CentOS-201605220104.x86_64/6.8
Installed yum-3.2.29-81.el6.centos.noarch @base
Installed yum-metadata-parser-1.1.2-16.el6.x86_64 @anaconda-CentOS-201605220104.x86_64/6.8
Installed yum-plugin-fastestmirror-1.1.30-40.el6.noarch @base
Packages Altered:
Install oracleasm-support-2.1.8-1.el6.x86_64 @/oracleasm-support-2.1.8-1.el6.x86_64
history info

How To View Package Installed/Updated/Upgraded/Erased Date In Ubuntu/Debian/LinuxMint Systems

Debian based systems are using APT and APT-GET package manager hence we can use the history.log and dpkg.log file to get this information.
If you would like to check the package installed date, just run the following command format and change the package that you want to check.
$ grep -A 2 "Install: nano" /var/log/apt/history.log
Install: nano:amd64 (2.8.6-3)
End-Date: 2018-08-09 09:12:05
If you would like to check who has performed the package installation, just run the following command format.
$ grep -A 3 "apt install nano" /var/log/apt/history.log*
/var/log/apt/history.log:Commandline: apt install nano
/var/log/apt/history.log-Requested-By: daygeek (1000)
/var/log/apt/history.log-Install: nano:amd64 (2.8.6-3)
/var/log/apt/history.log-End-Date: 2018-08-09 09:12:05
To view package removed/erased date, just run the following command format.
$ grep -A 2 "Remove: nano" /var/log/apt/history.log
Remove: nano:amd64 (2.8.6-3)
End-Date: 2018-08-09 08:58:34

How To View Package Installed/Updated/Upgraded/Erased Date In Ubuntu/Debian/LinuxMint Systems

Alternatively we can check the package latest installed date using dpkg command.
DPKG stands for Debian Package is a tool to install, build, remove and manage Debian packages, but unlike other package management systems, it cannot automatically download and install packages or their dependencies.
$ grep -i "install\|installed\|half-installed" /var/log/dpkg.log | grep firefox
2018-07-18 10:25:46 status half-installed firefox:amd64 60.0.2+build1-0ubuntu0.17.10.1
2018-07-18 10:25:53 status half-installed firefox:amd64 60.0.2+build1-0ubuntu0.17.10.1
2018-07-18 10:25:54 status installedfirefox:amd64 61.0.1+build1-0ubuntu0.17.10.1
2018-07-18 10:29:25 status half-installed firefox-locale-en:amd64 60.0.2+build1-0ubuntu0.17.10.1
2018-07-18 10:29:25 status installed firefox-locale-en:amd64 61.0.1+build1-0ubuntu0.17.10.1
To view package upgraded/updated date, just run the following command format.
$ zgrep "upgrade" /var/log/dpkg.log* | grep mutter
/var/log/dpkg.log.8.gz:2017-12-05 16:06:42 upgrade gir1.2-mutter-1:amd64 3.26.1-2ubuntu1 3.26.2-0ubuntu0.1
/var/log/dpkg.log.8.gz:2017-12-05 16:06:43 upgrade mutter-common:all 3.26.1-2ubuntu1 3.26.2-0ubuntu0.1
/var/log/dpkg.log.8.gz:2017-12-05 16:06:44 upgrade libmutter-1-0:amd64 3.26.1-2ubuntu1 3.26.2-0ubuntu0.1
/var/log/dpkg.log.8.gz:2017-12-05 16:06:44 upgrademutter:amd64 3.26.1-2ubuntu1 3.26.2-0ubuntu0.1
To view package removed/erased date, just run the following command format.
$ zgrep -i "remove" /var/log/dpkg.log* | grep nano
/var/log/dpkg.log:2018-08-09 08:58:32 removenano:amd64 2.8.6-3

How To View Package Installed/Updated/Upgraded/Erased Date In suse/openSUSE Systems

susu and openSUSE systems are using zypper package manager hence we can use the zypper history.log file to get this information.
If you would like to check the package installed date, just run the following command format and change the package that you want to check.
# grep "install" /var/log/zypp/history | grep nano
2018-08-09 10:54:01|command|root@linux-7whv.suse|'zypper''install''nano'|
2018-08-09 10:54:02|install|nano|2.4.2-5.3|x86_64|root@linux-7whv.suse|download.opensuse.org-oss|d91c91b06b26f689bada77d5a09031f4473912a4|
2018-08-09 10:54:02|install|nano-lang|2.4.2-5.3|noarch||download.opensuse.org-oss|57093a090d6187378592416896532f0e8ebee471|
To view package removed/erased date, just run the following command format.
# grep "remove" /var/log/zypp/history | grep nano
2018-08-09 10:54:37|command|root@linux-7whv.suse|'zypper''remove''nano'|
2018-08-09 10:54:37|remove |nano-lang|2.4.2-5.3|noarch||
2018-08-09 10:54:38|remove |nano|2.4.2-5.3|x86_64|root@linux-7whv.suse|
You might see the results with multiple output with the same package, in this case you need to note down the latest installed date since it’s keeping all the details
about the package.
To view package upgraded/updated date, just run the following command format.
# grep "install" /var/log/zypp/history | grep java
2017-10-31 14:28:02|install|timezone-java|2017c-0.39.7.2|noarch||download.opensuse.org-oss_1|8cf2af9a90f096ec4e793f273950514b1c0c5bad2ff975eaa7ff10b325365736|
2017-10-31 14:32:03|install|javapackages-tools|2.0.1-12.3.1|x86_64||download.opensuse.org-oss_1|4f703fbf1fe68c86985535f7b0c176f6644eded924da81828fc0d8f0986887a8|
# 2017-10-31 14:33:12 java-1_8_0-openjdk-headless-1.8.0.144-10.15.2.x86_64.rpm installed ok
2017-10-31 14:33:12|install|java-1_8_0-openjdk-headless|1.8.0.144-10.15.2|x86_64||download.opensuse.org-oss_1|21ec7c68894fd53b03158b94570b4529b23f5c6531f88870e60d7aa2881b2d85|
2017-10-31 14:33:35|install|libjavascriptcoregtk-4_0-18|2.12.5-1.6|x86_64||openSUSE-42.2-0|4edefc705bb97a30dd30d79afe3efdd8e0b9d800|
2017-10-31 14:33:36|install|libjavascriptcoregtk-1_0-0|2.4.11-2.10|x86_64||openSUSE-42.2-0|45863597bdef961af2d8403d5952a1a99c3b127d|
# 2017-10-31 14:41:36 java-1_7_0-openjdk-headless-1.7.0.141-42.3.1.x86_64.rpm installed ok
2017-10-31 14:41:36|install|java-1_7_0-openjdk-headless|1.7.0.141-42.3.1|x86_64||download.opensuse.org-oss_1|1f0d97f6a0d2afa62c7145388f6b44f0e9c93c76a1c2e06f1f549b5958ed0a29|
2017-10-31 14:42:28|install|java-1_8_0-openjdk|1.8.0.144-10.15.2|x86_64||download.opensuse.org-oss_1|365471dce54474ce167fc8b236d7f690888734bd44af7ccae32d6e1469e64707|
# 2017-10-31 14:44:26 java-1_8_0-openjdk-plugin-1.6.1-2.35.x86_64.rpm installed ok
2017-10-31 14:44:26|install|java-1_8_0-openjdk-plugin|1.6.1-2.35|x86_64||openSUSE-42.2-0|f6486d25ddd255a518b17f43140fe4992760e6c4|
2017-10-31 14:45:40|install|java-1_7_0-openjdk|1.7.0.141-42.3.1|x86_64||download.opensuse.org-oss_1|f6bbc1ca6245dcee1ae3763bcdc9f2c0d0fc1a0ff6c1d0dfd9f0ee92bb492204|
# 2017-10-31 14:56:44 java-1_7_0-openjdk-plugin-1.6.2-3.3.3.x86_64.rpm installed ok
# update-alternatives: warning: forcing reinstallation of alternative /usr/lib64/java-1_8_0-openjdk-plugin/lib/IcedTeaPlugin.so because link group javaplugin is broken
2017-10-31 14:56:44|install|java-1_7_0-openjdk-plugin|1.6.2-3.3.3|x86_64||download.opensuse.org-oss_1|1689d87b05e7c4d757c1295fbdc1b5644d2071688bcb4540e12fd00f7d758fcf|
2018-08-09 11:03:05|install|java-1_8_0-openjdk-headless|1.8.0.151-10.18.2|x86_64|root@linux-7whv.suse|download.opensuse.org-oss_1|95fe5a29b816db759dec1950cc83b5ecf0c23b6b31ca4a0eabd05cf9cdfb0532|
2018-08-09 11:03:05|install|java-1_8_0-openjdk|1.8.0.151-10.18.2|x86_64||download.opensuse.org-oss_1|8c167c4185275dd7ff48e44db6666f0050c9cacc4fab83be69c75acb3edaffd5|

How To View Package Installed/Updated/Upgraded/Erased Date In Arch Linux Systems

Arch Linux based systems are using pacman package manager hence we can use the pacman history.log file to get this information.
If you would like to check the package installed date, just run the following command format and change the package that you want to check.
$ grep "installed" /var/log/pacman.log | grep firefox
[2017-08-24 06:43] [ALPM] installedfirefox (55.0.2-1)
Alternatively, we can use the following command as well to get this details.
$ pacman -Qi firefox | grep "Install Date"
Install Date : Thu 24 Aug 2017 06:43:43 AM UTC
To view package removed/erased date, just run the following command format.
$ grep "removed" /var/log/pacman.log | grep nano
[2018-08-09 05:59] [ALPM] removednano (2.8.6-1)
To view package upgraded/updated date, just run the following command format.
$ grep "upgraded" /var/log/pacman.log | grep nano
[2017-08-24 06:02] [ALPM] upgradednano (2.8.6-1 -> 2.8.7-1)

Difference between Docker swarm and Kubernetes

$
0
0
https://kerneltalks.com/virtualization/docker/difference-between-docker-swarm-and-kubernetes

Learn difference between Docker swarm and Kubernetes. Comparison between two container orchestration platforms in tabular manner.

Difference between Docker swarm and Kubernetes
Docker Swarm v/s Kubernetes


When you are on learning curve of application containerization, there will be a stage when you come across orchestration tools for containers. If you have started your learning with Docker then Docker swarm is the first cluster management tool you must have learnt and then Kubernetes. So its time to compare docker swarm and Kubernetes. In this article, we will quickly see what is docker, what is kubernetes and then comparison between the two.

What is Docker swarm?

Docker swarm is native tool to Docker which is aimed at clustering management of Docker containers. Docker swarm enables you to built a cluster of multi node VM of physical machines running Docker engine. In turns you will be running containers on multiple machines to facilitate HA, availability, fault tolerant environment. Its pretty much simple to setup and native to Docker.

What is Kubernetes?

Its a platform to manage containerized applications i.e. containers in cluster environment along with automation. Its does almost similar job swarm mode does but in different and enhanced way. Its developed by Google in first place and later project handed over to CNCF. It works with containers like Docker and rocket. Kubernetes installation is bit complex than Swarm.

Compare Docker and Kubernetes

If someone asks you comparison between Docker and Kubernetes then thats not a valid question in first place. You can not differentiate between Docker and Kubernetes. Docker is a engine which runs containers or itself it refers as container and Kubernetes is orchestration platform which manages Docker containers in cluster environment. So one can not compare Docker and Kubernetes.

Difference between Docker Swarm and Kubernetes

I added comparison of Swarm and Kubernetes in below table for easy readability.

Copying one File Simultaneously to Multiple Locations through Ubuntu Command Line

$
0
0
https://vitux.com/copying-one-file-simultaneously-to-multiple-locations-through-ubuntu-command-line

Copy File Simultaniously on Linux
As a command line newbie, you might feel that the same task you quickly used to perform through the graphical interface might ask for a lot of commands in the command line. However, as you slowly become a command line power user through learning, practice, and experience, you will start to notice that the same tasks can be performed very quickly through some very simple yet useful shortcuts. In this article, we will describe one such case that apparently might need a lot of commands to run but in actual, one simple command can achieve the task for you.
At times, we require copying a single file to multiple locations on our system. So does that mean, we need to use the cp command multiple times? The answer is no! Let us read further to find a solution.
The commands mentioned in this article have been run of an Ubuntu 18.04 LTS system.

How to copy one file simultaneously to multiple locations

We all know how the cp command lets us copy a file to a new location through the following syntax:
$ cp ~[/location/sourcefile] ~[/destinationfolder]
Here I am copying a sample text file from my Downloads folder to the Documents folder:
Copy file to one location
Now if I want to copy the same file to two different locations instead of one, the probable solution seems using the cp command twice.
Here I am using the cp command twice to copy a sample text file from the Downloads folder to the Public and Desktop folders:
copy file twice
Copying the same file to two locations by using the cp command twice still seems logical but let us suppose we have to copy the file to three, five, or even more locations. Here is how a single command can achieve this purpose.
Syntax:
$ echo [destination1] [desctination2] [destiantion3]..... | xargs -n 1 cp [/location/sourcefile]
In the following example, I will use this command to copy a sample text file from my Downloads folder to three different folders simultaneously:
copy file to two locations with one command
We have used the echo command and the xargs command in one line to attain our purpose.

How the command works?

The echo command prints the output to the screen but in our example, we are using it to feed output to the xargs command through the | symbol. The xargs command will take input three times from the echo command and perform the cp operation thrice, copying the sample text to three different locations. The n count tells the cp command to take one argument at a time.
Please note that this command will overwrite an already existing file by the same name in the destination folder. Therefore, it is good practice to always take backup of your important files. The i option that we used for asking before the overwrite operation does not work with the xargs command.
However, there is one use of the command that can help you avoid overwriting a file if it already exists in the destination folder; the n option before the source file.
Syntax:
$ echo [destination1] [desctination2] [destiantion3]..... | xargs -n 1 cp n [/lcoation/sourcefile]
Example:
using xargs command
The n option is very useful while you are copying very large files from one location to another, especially over a network. This way you can avoid the resources wasted on copying and then replacing an already existing file.
After running this tutorial, you have become one step closer to becoming a command line guru. Now you do not need to write multiple commands to perform the simple task of copying one file to different locations. You can merge the echo and xargs command, as we described, in order to have a one-command solution to your problem.

3 open source log aggregation tools

$
0
0
https://opensource.com/article/18/9/open-source-log-aggregation-tools

Log aggregation systems can help with troubleshooting and other tasks. Here are three top options.

Image by : 
opensource.com
x

Get the newsletter

Join the 85,000 open source advocates who receive our giveaway alerts and article roundups.
How is metrics aggregation different from log aggregation? Can’t logs include metrics? Can’t log aggregation systems do the same things as metrics aggregation systems?
These are questions I hear often. I’ve also seen vendors pitching their log aggregation system as the solution to all observability problems. Log aggregation is a valuable tool, but it isn’t normally a good tool for time-series data.
A couple of valuable features in a time-series metrics aggregation system are the regular interval and the storage system customized specifically for time-series data. The regular interval allows a user to derive real mathematical results consistently. If a log aggregation system is collecting metrics in a regular interval, it can potentially work the same way. However, the storage system isn’t optimized for the types of queries that are typical in a metrics aggregation system. These queries will take more resources and time to process using storage systems found in log aggregation tools.
So, we know a log aggregation system is likely not suitable for time-series data, but what is it good for? A log aggregation system is a great place for collecting event data. These are irregular activities that are significant. An example might be access logs for a web service. These are significant because we want to know what is accessing our systems and when. Another example would be an application error condition—because it is not a normal operating condition, it might be valuable during troubleshooting.
A handful of rules for logging:
  • DO include a timestamp
  • DO format in JSON
  • DON’T log insignificant events
  • DO log all application errors
  • MAYBE log warnings
  • DO turn on logging
  • DO write messages in a human-readable form
  • DON’T log informational data in production
  • DON’T log anything a human can’t read or react to

Cloud costs

When investigating log aggregation tools, the cloud might seem like an attractive option. However, it can come with significant costs. Logs represent a lot of data when aggregated across hundreds or thousands of hosts and applications. The ingestion, storage, and retrieval of that data are expensive in cloud-based systems.
As a point of reference from a real system, a collection of around 500 nodes with a few hundred apps results in 200GB of log data per day. There’s probably room for improvement in that system, but even reducing it by half will cost nearly $10,000 per month in many SaaS offerings. This often includes retention of only 30 days, which isn’t very long if you want to look at trending data year-over-year.
This isn’t to discourage the use of these systems, as they can be very valuable—especially for smaller organizations. The purpose is to point out that there could be significant costs, and it can be discouraging when they are realized. The rest of this article will focus on open source and commercial solutions that are self-hosted.

Tool options

ELK

ELK, short for Elasticsearch, Logstash, and Kibana, is the most popular open source log aggregation tool on the market. It’s used by Netflix, Facebook, Microsoft, LinkedIn, and Cisco. The three components are all developed and maintained by Elastic. Elasticsearch is essentially a NoSQL, Lucene search engine implementation. Logstash is a log pipeline system that can ingest data, transform it, and load it into a store like Elasticsearch. Kibana is a visualization layer on top of Elasticsearch.
A few years ago, Beats were introduced. Beats are data collectors. They simplify the process of shipping data to Logstash. Instead of needing to understand the proper syntax of each type of log, a user can install a Beat that will export NGINX logs or Envoy proxy logs properly so they can be used effectively within Elasticsearch.
When installing a production-level ELK stack, a few other pieces might be included, like Kafka, Redis, and NGINX. Also, it is common to replace Logstash with Fluentd, which we’ll discuss later. This system can be complex to operate, which in its early days led to a lot of problems and complaints. These have largely been fixed, but it’s still a complex system, so you might not want to try it if you’re a smaller operation.
That said, there are services available so you don’t have to worry about that. Logz.io will run it for you, but its list pricing is a little steep if you have a lot of data. Of course, you’re probably smaller and may not have a lot of data. If you can’t afford Logz.io, you could look at something like AWS Elasticsearch Service (ES). ES is a service Amazon Web Services (AWS) offers that makes it very easy to get Elasticsearch working quickly. It also has tooling to get all AWS logs into ES using Lambda and S3. This is a much cheaper option, but there is some management required and there are a few limitations.
Elastic, the parent company of the stack, offers a more robust product that uses the open core model, which provides additional options around analytics tools, and reporting. It can also be hosted on Google Cloud Platform or AWS. This might be the best option, as this combination of tools and hosting platforms offers a cheaper solution than most SaaS options and still provides a lot of value. This system could effectively replace or give you the capability of a security information and event management (SIEM) system.
The ELK stack also offers great visualization tools through Kibana, but it lacks an alerting function. Elastic provides alerting functionality within the paid X-Pack add-on, but there is nothing built in for the open source system. Yelp has created a solution to this problem, called ElastAlert, and there are probably others. This additional piece of software is fairly robust, but it increases the complexity of an already complex system.

Graylog

Graylog has recently risen in popularity, but it got its start when Lennart Koopmann created it back in 2010. A company was born with the same name two years later. Despite its increasing use, it still lags far behind the ELK stack. This also means it has fewer community-developed features, but it can use the same Beats that the ELK stack uses. Graylog has gained praise in the Go community with the introduction of the Graylog Collector Sidecar written in Go.
Graylog uses Elasticsearch, MongoDB, and the Graylog Server under the hood. This makes it as complex to run as the ELK stack and maybe a little more. However, Graylog comes with alerting built into the open source version, as well as several other notable features like streaming, message rewriting, and geolocation.
The streaming feature allows for data to be routed to specific Streams in real time while they are being processed. With this feature, a user can see all database errors in a single Stream and web server errors in a different Stream. Alerts can even be based on these Streams as new items are added or when a threshold is exceeded. Latency is probably one of the biggest issues with log aggregation systems, and Streams eliminate that issue in Graylog. As soon as the log comes in, it can be routed to other systems through a Stream without being processed fully.
The message rewriting feature uses the open source rules engine Drools. This allows all incoming messages to be evaluated against a user-defined rules file enabling a message to be dropped (called Blacklisting), a field to be added or removed, or the message to be modified.
The coolest feature might be Graylog’s geolocation capability, which supports plotting IP addresses on a map. This is a fairly common feature and is available in Kibana as well, but it adds a lot of value—especially if you want to use this as your SIEM system. The geolocation functionality is provided in the open source version of the system.
Graylog, the company, charges for support on the open source version if you want it. It also offers an open core model for its Enterprise version that offers archiving, audit logging, and additional support. There aren’t many other options for support or hosting, so you’ll likely be on your own if you don’t use Graylog (the company).

Fluentd

Fluentd was developed at Treasure Data, and the CNCF has adopted it as an Incubating project. It was written in C and Ruby and is recommended by AWS and Google Cloud. Fluentd has become a common replacement for Logstash in many installations. It acts as a local aggregator to collect all node logs and send them off to central storage systems. It is not a log aggregation system.
It uses a robust plugin system to provide quick and easy integrations with different data sources and data outputs. Since there are over 500 plugins available, most of your use cases should be covered. If they aren’t, this sounds like an opportunity to contribute back to the open source community.
Fluentd is a common choice in Kubernetes environments due to its low memory requirements (just tens of megabytes) and its high throughput. In an environment like Kubernetes, where each pod has a Fluentd sidecar, memory consumption will increase linearly with each new pod created. Using Fluentd will drastically reduce your system utilization. This is becoming a common problem with tools developed in Java that are intended to run one per node where the memory overhead hasn’t been a major issue.

Linux namei Command Tutorial for Beginners (5 Examples)

$
0
0
https://www.howtoforge.com/linux-namei-command

On the Linux command line, you work with several types of files, for example, directories, symbolic links, and stuff like that. Sometimes, the requirement is to know more about individual elements in a path - what type of file it is, who is its owner, and more. Thankfully, there's an inbuilt Linux command line utility - dubbed namei - that lets you fetch this information.
In this tutorial, we will discuss the basics of namei using some easy to understand examples. But before we start with that, it's worth mentioning that all examples here have been tested on an Ubuntu 18.04 LTS machine.

Linux namei command

The namei command in Linux follows a pathname until a terminal point is found. Following is its syntax:
namei [options] pathname...
And here's what the man page says about this tool:
namei  interprets  its  arguments as pathnames to any type of Unix file
       (symlinks, files, directories, and so forth).  namei then follows  each
       pathname  until  an  endpoint  is  found (a file, a directory, a device
       node, etc).  If it finds a symbolic link, it shows the link, and starts
       following it, indenting the output to show the context.

       This  program is useful for finding "too many levels of symbolic links"
       problems.
Following are some Q&A-styled examples that should give you a good idea on how the namei command works.

Q1. How to use namei?

Basic usage is fairly simple, all you have to do is to execute 'namei' followed by a command line path.
For example:
namei -v /home/himanshu/Downloads/HTF-review/Nodejs-Docker/1.png
And here's the output this command produced:
f: /home/himanshu/Downloads/HTF-review/Nodejs-Docker/1.png
 d /
 d home
 d himanshu
 d Downloads
 d HTF-review
 d Nodejs-Docker
 - 1.png
The tool's man page describes in detail how to interpret the output.
For each line of output, namei uses the following characters to identify the file type found:

          f: = the pathname currently being resolved
           d = directory
           l = symbolic link (both the link and its contents are output)
           s = socket
           b = block device
           c = character device
           p = FIFO (named pipe)
           - = regular file
           ? = an error of some kind
So you can see the namei command broke down all the elements in the path we supplied to it, informing us about their type.

Q2. How to vertically align namei output?

This you can do by using the -v command line option. For example:
namei -v /home/himanshu/Downloads/HTF-review/Nodejs-Docker/1.png
And here's the output:
f: /home/himanshu/Downloads/HTF-review/Nodejs-Docker/1.png
d /
d home
d himanshu
d Downloads
d HTF-review
d Nodejs-Docker
- 1.png
If you compare this with the output shown in the previous section, you'll see there's a vertical alignment this time around.

Q3. How to make namei show owner and group information?

This can be done using the -o command line option. For example:
namei -o /home/himanshu/Downloads/HTF-review/Nodejs-Docker/1.png
Here's the output:
f: /home/himanshu/Downloads/HTF-review/Nodejs-Docker/1.png
 d root     root     /
 d root     root     home
 d himanshu himanshu himanshu
 d himanshu himanshu Downloads
 d himanshu himanshu HTF-review
 d himanshu himanshu Nodejs-Docker
 - himanshu himanshu 1.png
So you can see that ownership information for each file/directory is displayed in the output.

Q4. How to make namei use long listing output format?

This can be done using the -l command line option.
namei -l /home/himanshu/Downloads/HTF-review/Nodejs-Docker/1.png
Here's the output:
f: /home/himanshu/Downloads/HTF-review/Nodejs-Docker/1.png
drwxr-xr-x root     root     /
drwxr-xr-x root     root     home
drwxr-xr-x himanshu himanshu himanshu
drwxr-xr-x himanshu himanshu Downloads
drwxr-xr-x himanshu himanshu HTF-review
drwxr-xr-x himanshu himanshu Nodejs-Docker
-rw-rw-r-- himanshu himanshu 1.png
So you can see that an ls command like output is produced by the namei command.
As already explained in the beginning, the namei command follows a symbolic link by default. For example, on my system, 'link1' is a symbolic link to a file 'file1', so I passed 'link1' path as input to namei in the following way:
namei /home/himanshu/link1
Then the following output was produced:
f: /home/himanshu/link1
 d /
 d home
 d himanshu
 l link1 -> file1
   - file1
So you can see the namei command clearly showed the kind of file 'file1' is. However, if you want, you can force the tool to not follow symbolic links, something which you can do by using the -n command line option.
namei -n /home/himanshu/link1
Here's the output in this case:
f: /home/himanshu/link1
 d /
 d home
 d himanshu
 l link1 -> file1
So you can see the tool didn't follow symbolic link in this case.

Conclusion

The namei command is particularly useful in case of nested symbolic link elements in path. Here, in this tutorial, we have discussed majority of the command line options this tool offers. Once you're done practicing these, head to the tool's man page to know more about it.

Introduction to python web scraping and the Beautiful Soup library

$
0
0
https://linuxconfig.org/introduction-to-python-web-scraping-and-the-beautiful-soup-library

Objective

Learning how to extract information out of an html page using python and the Beautiful Soup library.

Requirements

  • Understanding of the basics of python and object oriented programming

Difficulty

EASY

Conventions

  • # - requires given linux command to be executed with root privileges either directly as a root user or by use of sudo command
  • $ - given linux command to be executed as a regular non-privileged user

Introduction

Web scraping is a technique which consist in the extraction of data from a web site through the use of dedicated software. In this tutorial we will see how to perform a basic web scraping using python and the Beautiful Soup library. We will use python3 targeting the homepage of Rotten Tomatoes, the famous aggregator of reviews and news for films and tv shows, as a source of information for our exercise.

Installation of the Beautiful Soup library

To perform our scraping we will make use of the Beautiful Soup python library, therefore the first thing we need to do is to install it. The library is available in the repositories of all the major GNU\Linux distributions, therefore we can install it using our favorite package manager, or by using pip, the python native way for installing packages.

If the use of the distribution package manager is preferred and we are using Fedora:
$ sudo dnf install python3-beautifulsoup4
On Debian and its derivatives the package is called beautifulsoup4:
$ sudo apt-get install beautifulsoup4
On Archilinux we can install it via pacman:
$ sudo pacman -S python-beatufilusoup4
If we want to use pip, instead, we can just run:
$ pip3 install --user BeautifulSoup4
By running the command above with the --user flag, we will install the latest version of the Beautiful Soup library only for our user, therefore no root permissions needed. Of course you can decide to use pip to install the package globally, but personally I tend to prefer per-user installations when not using the distribution package manager.

The BeautifulSoup object

Let's begin: the first thing we want to do is to create a BeautifulSoup object. The BeautifulSoup constructor accepts either a string or a file handle as its first argument. The latter is what interests us: we have the url of the page we want to scrape, therefore we will use the urlopen method of the urllib.request library (installed by default): this method returns a file-like object:

from bs4 import BeautifulSoup
from urllib.request import urlopen

with urlopen('http://www.rottentomatoes.com')as homepage:
soup = BeautifulSoup(homepage)
At this point, our soup it's ready: the soup object represents the document in its entirety. We can begin navigating it and extracting the data we want using the built-in methods and properties. For example, say we want to extract all the links contained in the page: we know that links are represented by the a tag in html and the actual link is contained in the href attribute of the tag, so we can use the find_all method of the object we just built to accomplish our task:

for link in soup.find_all('a'):
print(link.get('href'))
By using the find_all method and specifying a as the first argument, which is the name of the tag, we searched for all links in the page. For each link we then retrieved and printed the value of the href attribute. In BeautifulSoup the attributes of an element are stored into a dictionary, therefore retrieving them is very easy. In this case we used the get method, but we could have accessed the value of the href attribute even with the following syntax: link['href']. The complete attributes dictionary itself is contained in the attrs property of the element. The code above will produce the following result:
[...]
https://editorial.rottentomatoes.com/
https://editorial.rottentomatoes.com/24-frames/
https://editorial.rottentomatoes.com/binge-guide/
https://editorial.rottentomatoes.com/box-office-guru/
https://editorial.rottentomatoes.com/critics-consensus/
https://editorial.rottentomatoes.com/five-favorite-films/
https://editorial.rottentomatoes.com/now-streaming/
https://editorial.rottentomatoes.com/parental-guidance/
https://editorial.rottentomatoes.com/red-carpet-roundup/
https://editorial.rottentomatoes.com/rt-on-dvd/
https://editorial.rottentomatoes.com/the-simpsons-decade/
https://editorial.rottentomatoes.com/sub-cult/
https://editorial.rottentomatoes.com/tech-talk/
https://editorial.rottentomatoes.com/total-recall/
[...]
The list is much longer: the above is just an extract of the output, but gives you an idea. The find_all method returns all Tag objects that matches the specified filter. In our case we just specified the name of the tag which should be matched, and no other criteria, so all links are returned: we will see in a moment how to further restrict our search.

A test case: retrieving all "Top box office" titles

Let's perform a more restricted scraping. Say we want to retrieve all the titles of the movies which appear in the "Top Box Office" section of Rotten Tomatoes homepage. The first thing we want to do is to analyze the page html for that section: doing so, we can observe that the element we need are all contained inside a table element with the "Top-Box-Office"id:

Top Box Office
Top Box Office
We can also observe that each row of the table holds information about a movie: the title's scores are contained as text inside a span element with class "tMeterScore" inside the first cell of the row, while the string representing the title of the movie is contained in the second cell, as the text of the a tag. Finally, the last cell contains a link with the text that represents the box office results of the film. With those references, we can easily retrieve all the data we want:

from bs4 import BeautifulSoup
from urllib.request import urlopen

with urlopen('https://www.rottentomatoes.com')as homepage:
soup = BeautifulSoup(homepage.read(),'html.parser')

# first we use the find method to retrieve the table with 'Top-Box-Office' id
top_box_office_table = soup.find('table',{'id':'Top-Box-Office'})

# than we iterate over each row and extract movies information
for row in top_box_office_table.find_all('tr'):
cells = row.find_all('td')
title = cells[1].find('a').get_text()
money = cells[2].find('a').get_text()
score = row.find('span',{'class':'MeterScore'}).get_text()
print('{0} -- {1} (TomatoMeter: {2})'.format(title, money, score))
The code above will produce the following result:
Crazy Rich Asians -- .9M (TomatoMeter: 93%)
The Meg -- .9M (TomatoMeter: 46%)
The Happytime Murders -- .6M (TomatoMeter: 22%)
Mission: Impossible - Fallout -- .2M (TomatoMeter: 97%)
Mile 22 -- .5M (TomatoMeter: 20%)
Christopher Robin -- .4M (TomatoMeter: 70%)
Alpha -- .1M (TomatoMeter: 83%)
BlacKkKlansman -- .2M (TomatoMeter: 95%)
Slender Man -- .9M (TomatoMeter: 7%)
A.X.L. -- .8M (TomatoMeter: 29%)
We introduced few new elements, let's see them. The first thing we have done, is to retrieve the table with 'Top-Box-Office' id, using the find method. This method works similarly to find_all, but while the latter returns a list which contains the matches found, or is empty if there are no correspondence, the former returns always the first result or None if an element with the specified criteria is not found.

The first element provided to the find method is the name of the tag to be considered in the search, in this case table. As a second argument we passed a dictionary in which each key represents an attribute of the tag with its corresponding value. The key-value pairs provided in the dictionary represents the criteria that must be satisfied for our search to produce a match. In this case we searched for the id attribute with "Top-Box-Office" value. Notice that since each id must be unique in an html page, we could just have omitted the tag name and use this alternative syntax:

top_box_office_table = soup.find(id='Top-Box-Office')
Once we retrieved our table Tag object, we used the find_all method to find all the rows, and iterate over them. To retrieve the other elements, we used the same principles. We also used a new method, get_text: it returns just the text part contained in a tag, or if none is specified, in the entire page. For example, knowing that the movie score percentage are represented by the text contained in the span element with the tMeterScore class, we used the get_text method on the element to retrieve it.

In this example we just displayed the retrieved data with a very simple formatting, but in a real-world scenario, we might have wanted to perform further manipulations, or store it in a database.

Conclusions

In this tutorial we just scratched the surface of what we can do using python and Beautiful Soup library to perform web scraping. The library contains a lot of methods you can use for a more refined search or to better navigate the page: for this I strongly recommend to consult the very well written official docs.

How to Setup File Integrity Monitoring (FIM) using osquery on Linux

$
0
0
https://www.howtoforge.com/tutorial/how-to-setup-file-integrity-monitoring-fim-using-osquery-on-linux-server

Osquery is an open source operating system instrumentation, monitoring, and analytics. Created by Facebook, it exposes an operating system as a high-performance relational database that can be queried using SQL-based queries.
Osquery is a multi-platform software, can be installed on Linux, Windows, MacOS, and FreeBSD. It allows us to explore all of those operating systems' profile, performance, security checking etc, using SQL-based queries.
In this tutorial, we will show you how to setup File Integrity Monitoring (FIM) using osquery. We will be using the Linux operating systems Ubuntu 18.04 and CentOS 7.

Prerequisites

  • Linux (Ubuntu or CentOS)
  • Root privileges
  • Completed first osquery guide

What we will do

  1. Install osquery on Linux Server
  2. Enable Syslog Consumption for osquery
  3. Basic osquery Configuration
  4. Configure File Integrity Monitoring osquery
  5. Testing

Step 1 - Install osquery on Linux Server

Osquery provides its own repository for all platform installation, and the first step we are going to do is installing the osquery package FROM the official osquery repository.

On Ubuntu

Add the osquery key to the system.
export OSQUERY_KEY=1484120AC4E9F8A1A577AEEE97A80C63C9D8B80B
sudo apt-key adv --keyserver keyserver.ubuntu.com --recv-keys $OSQUERY_KEY
Add the osquery repository and install the package.
sudo add-apt-repository 'deb [arch=amd64] https://pkg.osquery.io/deb deb main'
sudo apt install osquery -y

On CentOS

Add the osquery key to the system.
curl -L https://pkg.osquery.io/rpm/GPG | sudo tee /etc/pki/rpm-gpg/RPM-GPG-KEY-osquery
Add and enable the osquery repository, and install the package.
sudo yum-config-manager --add-repo https://pkg.osquery.io/rpm/osquery-s3-rpm.repo
sudo yum-config-manager --enable osquery-s3-rpm
sudo yum install osquery -y
Wait for all packages to be installed.
Install osquery
Note:
If you get the error about the yum-config-manager command.
sudo: yum-config-manager: command not found
Install the 'yum-utils' package.
yum -y install yum-utils

Step 2 - Enable Syslog Consumption in osquery

Osquery provides features to read or consume system logs on the Apple MacOS using the Apple System Log (ASL), and for Linux is using the syslog.
In this step, we will enable the syslog consumption for osquery through the rsyslog.

On Ubuntu

Install the rsyslog package using the apt command below.
sudo apt install rsyslog -y

On CentOS

Install the rsyslog package using the yum command below.
sudo yum install rsyslog -y
After the installation is complete, go to the '/etc/rsyslog.d' directory and create a new configuration file osquery.conf.
cd /etc/rsyslog.d/
vim osquery.conf
Paste the following configuration there.
template(
name="OsqueryCsvFormat"
type="string"
string="%timestamp:::date-rfc3339,csv%,%hostname:::csv%,%syslogseverity:::csv%,%syslogfacility-text:::csv%,%syslogtag:::csv%,%msg:::csv%\n"
)
*.* action(type="ompipe" Pipe="/var/osquery/syslog_pipe" template="OsqueryCsvFormat")
Save and exit.
Configure osquery to read the syslog

Step 3 - Basic Configuration osquery

osquery default configuration is 'osquery.conf', usually located in the '/etc/osquery' directory. There are samples of the osquery configuration '/usr/share/osquery/osquery.conf' and sample of osquery packs configuration.
In this step, we will learn about the osquery configuration components, create the custom osquery configuration, and then deploy the osqueryd as a service.
osquery configuration formatted as a JSON file contains osquery configuration specifications described below.
  • Options: part of the osqueryd CLI command and it determines the apps start and initialization.
  • Schedule: Define flow of the scheduled query names to the query details.
  • Decorators: Used to add additional "decorations" to results and snapshot logs.
  • Packs: a group of the schedule queries.
  • More: File Path, YARA, Prometheus, Views, EC2, Chef Configuration.
Go to the '/etc/osquery' directory and create a new custom configuration 'osquery.conf'.
cd /etc/osquery/
vim osquery.conf
Paste the following configurations there.
{
"options": {
"config_plugin": "filesystem",
"logger_plugin": "filesystem",
"logger_path": "/var/log/osquery",
"disable_logging": "false",
"log_result_events": "true",
"schedule_splay_percent": "10",
"pidfile": "/var/osquery/osquery.pidfile",
"events_expiry": "3600",
"database_path": "/var/osquery/osquery.db",
"verbose": "false",
"worker_threads": "2",
"enable_monitor": "true",
"disable_events": "false",
"disable_audit": "false",
"audit_allow_config": "true",
"host_identifier": "hakase-labs",
"enable_syslog": "true",
"syslog_pipe_path": "/var/osquery/syslog_pipe",
"force": "true",
"audit_allow_sockets": "true",
"schedule_default_interval": "3600"
},


"schedule": {
"crontab": {
"query": "SELECT * FROM crontab;",
"interval": 300
},
"system_info": {
"query": "SELECT hostname, cpu_brand, physical_memory FROM system_info;",
"interval": 3600
},
"ssh_login": {
"query": "SELECT username, time, host FROM last WHERE type=7",
"interval": 360
}
},

"decorators": {
"load": [
"SELECT uuid AS host_uuid FROM system_info;",
"SELECT user AS username FROM logged_in_users ORDER BY time DESC LIMIT 1;"
]
},

"packs": {
"osquery-monitoring": "/usr/share/osquery/packs/osquery-monitoring.conf"
}
}
Save and exit.
Note:
  • We're using the 'filesystem' as a config and logger plugins.
  • Define the logger path to the '/var/log/osquery' directory.
  • Enable the syslog pip to the '/var/syslog/syslog_pipe' file.
  • On the scheduler, we define three queries for checking the crontab, system info, and ssh login.
  • Enable the osquery packs named 'osquery-monitoring', and packs files located at the '/usr/share/osquery/packs' directory.
Now start the osqueryd daemon service and enable it to launch every time at system boot.
systemctl start osqueryd
systemctl enable osqueryd
And restart the rsyslog service.
systemctl restart rsyslog
Basic configuration osquery has been completed.

Step 4 - Configure File Integrity Monitoring (FIM) Using osquery

Osquery provides File Integrity Monitoring on Linux and MacOS Darwin using the inotify and FSEvents. Simply, it monitors and detects any changes of files on the defined directory using the 'file_path'and then store all activity to the file_events table.
In this step, we will configure osquery to monitor important directories such as home, ssh directory, etc, tmp, and the www web root directory using custom FIM packs.
Go to the '/usr/share/osquery/packs' directory and create a new packs configuration file 'fim.conf'.
cd /usr/share/osquery/packs
vim fim.conf
Paste configurations below.
{
"queries": {
"file_events": {
"query": "SELECT * FROM file_events;",
"removed": false,
"interval": 300
}
},
"file_paths": {
"homes": [
"/root/.ssh/%%",
"/home/%/.ssh/%%"
],
"etc": [
"/etc/%%"
],
"home": [
"/home/%%"
],
"tmp": [
"/tmp/%%"
],
"www": [
"/var/www/%%"
]
}
}
Save and exit.
Now back to the '/etc/osquery' configuration directory and edit the osquery.conf file.
cd /etc/osquery/
vim osquery.conf
Add the File Integrity Monitoring packs configuration inside the 'packs' section.
"packs": {
"osquery-monitoring": "/usr/share/osquery/packs/osquery-monitoring.conf",
"fim": "/usr/share/osquery/packs/fim.conf"
}
osquery file monitoring
Save and exit, then restart the osqueryd service.
systemctl restart osqueryd
Restart osqueryd
Note:
Keep checking the JSON configuration file using the JSON linter 'http://jsonlint.com/' and make sure there is no error.

Step 5 - Testing

We will test the File Integrity Monitoring packs by creating a new file on the defined directory 'home' and 'www'.
Go to the '/var/www/' directory and create a new file named 'howtoforge.md'.
cd /var/www/
touch howtoforge.md
Go to the '/home/youruser/' directory and create a new file named 'hakase-labs.md'.
cd /home/vagrant/
touch hakase-labs.md
Now we will check all logs monitoring using the real-time interactive mode osqueryi and the logs of the osquery results.
Testing osquery setup

osqueryi

Run the osqueryi command below.
osqueryi --config-path /etc/osquery/osquery.conf
Now check all logs about file changes in the 'file_events' table.
For global changes.
select * from file_events;
For 'home' directory.
select target_path, category, action, atime, ctime, mtime from file_events WHERE category="home";
For the 'www' web root directory.
select target_path, category, action, atime, ctime, mtime from file_events WHERE category="www";
Using osqueryi

osqueryd results log

Go to the '/var/log/osquery' directory and you will get the 'osqueryd.results.log' file.
cd /var/log/osquery/
ls -lah osqueryd.results.log
Filter the osquery logs using the 'grep' command.
grep -rin howtoforge.md osqueryd.results.log
grep -rin hakase-labs.md osqueryd.results.log
You will see info about those file has been created.
osqueryd results log
The installation and configuration of the File Integrity Monitoring (FIM) on Linux Server Ubuntu and CentOS using osquery has been completed successfully.

Reference

Linux manpath Command Tutorial for Beginners (5 Examples)

$
0
0
https://www.howtoforge.com/linux-manpath-command

Man pages in Linux is the go to spot for first-level support when it comes to command line utilities. As most of you would know, you just write 'man [command-name]' and the corresponding man page pops up. But do you know the path where these man pages are searched for?
In this tutorial, we will discuss manpath, a utility that shows you this information. But before we start with the explanation, it's worth mentioning that all examples here have been tested on an Ubuntu 18.04 LTS machine.

Linux manpath tutorial

The manpath command in Linux helps you determine search path for manual pages. Following is its syntax:
manpath [-qgdc?V] [-m system[,...]] [-C file]
And here's how the tool's man page describes it:
       If  $MANPATH is set, manpath will simply display its contents and issue
       a warning.  If not, manpath will determine a suitable manual page hier?
       archy search path and display the results.

       The  colon-delimited  path  is determined using information gained from
       the man-db configuration file - (/etc/manpath.config)  and  the  user's
       environment.
Following are some Q&A-styled examples that should give you a good idea on how the manpath command works.

Q1. How the manpath command works?

Basic usage is pretty straight forward - just execute 'manpath' sans any option.
manpath
For example, here's what the above command produced in output on my system:
/usr/local/man:/usr/local/share/man:/usr/share/man
So you can see, manpath produces a colon separated list of paths for manual pages.
Note that you can use the -g command line option in case you want to produce a manpath consisting of all paths named as 'global' within the man-db configuration file.

Q2. How to have catpath in output instead of manpath?

For this, use the -c command line option.
manpath -c
Here's how the tool's man page explains this operation:
Once the manpath is determined, each path element is converted to its relative catpath.
For example, here's the output produced on my system:
/var/cache/man/oldlocal:/var/cache/man/local:/var/cache/man

Q3. How to make manpath print debugging information?

For this, use the -d command line option.
manpath -d
For example, here's the output this command produced on my system:
How to make manpath print debugging information
Agreed, you may not use this option very frequently, but you should at least be aware of it in case you need to debug the tool's output.

Q4. How to make manpath access other OS' manual hierarchies?

For this, use the -m command line option. Here's how the tool's man page explains this option:
-m system[,...], --systems=system[,...]
             
If  this  system  has access to other operating sys?
              tem's manual hierarchies, this option can be used to
              include  them  in the output of manpath.  To include
              NewOS's manual page hierarchies use  the  option  -m
              NewOS.

              The  system  specified can be a combination of comma
              delimited operating system names.   To  include  the
              native  operating  system's manual page hierarchies,
              the system name man must be included in the argument
              string.  This option will override the $SYSTEM envi?
              ronment variable.

Q5. How to make manpath use a custom config file?

By default, manpath fetches information from the following file:
/etc/manpath.config
However, if you want, you can force manpath to read any other file. This you can do using -C command line option.
manpath -C NEWFILE-PATH

Conclusion

If your Linux command line work involves dealing with man pages, the manpath command is a helpful tool for you. Here, in this tutorial, we have discussed majority of manpath command line options. For more info on the tool, head to its man page.

How to Specify Time Limit for a Sudo Session

$
0
0
https://vitux.com/how-to-specify-time-limit-for-a-sudo-session

How to set a sudo timeout
While working with the sudo command for performing administrative tasks in Linux, you might have noticed that even if you have provided sudo password a while ago, you are asked to provide it again after some time. This happens because of the time limit of your sudo session, which is set to 15 minutes by default. If you enter a sudo command after these 15 minutes even in the same terminal session, you are asked to enter the password again. As a Linux administrator, you might want to lengthen or shorten the time limit for the sudo session than the default fifteen minutes.
This tutorial describes how you can make very simple changes in the /etc/sudoers file to specify a time limit for a sudo session. The commands mentioned in this article have been executed in Ubuntu 18; however, they perform the same in the older versions of Ubuntu as well.

Specify Time X For a Sudo Session

In this example, we will change the time limit of our sudo session to 10 minutes. Please follow these steps to change the time limit for your sudo session, to as long as you want:
Open your Ubuntu Terminal by pressing Ctrl+Alt+T or through the Ubuntu Dash.
Since you need to edit the sudoers file located in the etc folders, enter the following command:
$ sudo visudo
visudo command
You will be asked to enter a password for the sudo user.
You will be wondering why aren’t we opening the sudoers file like we open the other text files. The answer is that unlike other text editors, visudo verifies the syntax of the text you enter in the file. This saves you from making any faulty changes that may cause you serious repercussions. For example, making faulty edits to the sudoers file can cost you the inability to log-in as a privileged user to perform any of the elevated functions.
Type your password and enter. The sudoers file will open in the Nano editor as it is the default text editor for Ubuntu 18.04.
The sudoers file
In the above image, you can see the following line:
Defaults env_reset
This line is responsible for the time limit of your sudo session. You need to make the following changes to this line:
Defaults env_reset, timestamp_timeout=x
Here x is the time, in minutes, that you can specify in order to set your required time limit. Please note the following points while setting this timeout:
If you specify the timeout to be 0, your session will last only 0 minutes. It means that you will be asked to enter passwords for each of your sudo commands.
If you set this time to be less than zero (in negative), the sudo command will not work properly.
In this example, I am shortening the default time of 15 minutes to 10 minutes through the following changes in my sudoers file:
Change sudo timeout from 15 minutes to 10 minutes
Press Ctrl+X to exit the file after making the required changes. You will be asked if you want to save the modified file. Press Y for saving the changes.
Save modification to sudoers file
You will also be asked to specify the file name to be saved. Please press enter as we do not want to change the file name here.
Do not specify filename when saving the file
Your changes will be saved and your sudo session will last till the specified minutes whenever you use the sudo command.

Set Sudo Session Last Till Terminal Closes

Through a simple command, you can let your sudo session last till you close the terminal, no matter how long the terminal stays open. You will not be asked to enter your password for any command that requires sudo permission after running this command:
$ sudo -s

Terminate the sudo session

After you have provided the password for sudo, you can terminate the sudo session even before the time limit specified in the sudoers file, through the following simple command:
$ sudo -k
Please note that this command will not terminate the session if you have used the “sudo -s” during a terminal session.
So, this is how you can shorten or lengthen the time duration for a sudo session by making a one-line change in the /etc/sudoers file. You can also use other commands mentioned in this article to terminate the sudo session or make it last till the terminal session lasts.

Setting up Streaming Replication in PostgreSQL

$
0
0
https://www.percona.com/blog/2018/09/07/setting-up-streaming-replication-postgresql

Configuring replication between two databases is considered to be a best strategy towards achieving high availability during disasters and provides fault tolerance against unexpected failures. PostgreSQL satisfies this requirement through streaming replication. We shall talk about another option called logical replication and logical decoding in our future blog post.
Streaming replication works on log shipping. Every transaction in postgres is written to a transaction log called WAL (write-ahead log) to achieve durability. A slave uses these WAL segments to continuously replicate changes from its master.
There exists three mandatory processes – wal sender , wal receiver and startup process, these play a major role in achieving streaming replication in postgres.
A wal sender process runs on a master, whereas the wal receiver and startup processes runs on its slave. When you start the replication, a wal receiver process sends the LSN (Log Sequence Number) up until when the WAL data has been replayed on a slave, to the master. And then the wal sender process on master sends the WAL data until the latest LSN starting from the LSN sent by the wal receiver, to the slave. Wal receiver writes the WAL data sent by wal sender to WAL segments. It is the startup process on slave that replays the data written to WAL segment. And then the streaming replication begins.
Note: Log Sequence Number, or LSN, is a pointer to a location in the WAL.

Steps to setup streaming replication between a master and one slave

Step 1:
Create the user in master using whichever slave should connect for streaming the WALs. This user must have REPLICATION ROLE.
Step 2:
The following parameters on the master are considered as mandatory when setting up streaming replication.
  • archive_mode : Must be set to ON to enable archiving of WALs.
  • wal_level : Must be at least set to hot_standby  until version 9.5 or replica  in the later versions.
  • max_wal_senders : Must be set to 3 if you are starting with one slave. For every slave, you may add 2 wal senders.
  • wal_keep_segments : Set the WAL retention in pg_xlog (until PostgreSQL 9.x) and pg_wal (from PostgreSQL 10). Every WAL requires 16MB of space unless you have explicitly modified the WAL segment size. You may start with 100 or more depending on the space and the amount of WAL that could be generated during a backup.
  • archive_command : This parameter takes a shell command or external programs. It can be a simple copy command to copy the WAL segments to another location or a script that has the logic to archive the WALs to S3 or a remote backup server.
  • listen_addresses : Set it to * or the range of IP Addresses that need to be whitelisted to connect to your master PostgreSQL server. Your slave IP should be whitelisted too, else, the slave cannot connect to the master to replicate/replay WALs.
  • hot_standby : Must be set to ON on standby/replica and has no effect on the master. However, when you setup your replication, parameters set on the master are automatically copied. This parameter is important to enable READS on slave. Otherwise, you cannot run your SELECT queries against slave.
The above parameters can be set on the master using these commands followed by a restart:
Step 3:
Add an entry to pg_hba.conf of the master to allow replication connections from the slave. The default location of pg_hba.conf is the data directory. However, you may modify the location of this file in the file  postgresql.conf. In Ubuntu/Debian, pg_hba.conf may be located in the same directory as the postgresql.conf file by default. You can get the location of postgresql.conf in Ubuntu/Debian by calling an OS command => pg_lsclusters.
The IP address mentioned in this line must match the IP address of your slave server. Please change the IP accordingly.
In order to get the changes into effect, issue a SIGHUP:
Step 4:
pg_basebackup helps us to stream the data through the  wal sender process from the master to a slave to set up replication. You can also take a tar format backup from master and copy that to the slave server. You can read more about tar format pg_basebackup here
The following step can be used to stream data directory from master to slave. This step can be performed on a slave.
Please replace the IP address with your master’s IP address.
In the above command, you see an optional argument -R. When you pass -R, it automatically creates a recovery.conf  file that contains the role of the DB instance and the details of its master. It is mandatory to create the recovery.conf file on the slave in order to set up a streaming replication. If you are not using the backup type mentioned above, and choose to take a tar format backup on master that can be copied to slave, you must create this recovery.conf file manually. Here are the contents of the recovery.conf file:
In the above file, the role of the server is defined by standby_mode. standby_mode  must be set to ON for slaves in postgres.
And to stream WAL data, details of the master server are configured using the parameter primary_conninfo .
The two parameters standby_mode  and primary_conninfo are automatically created when you use the optional argument -R while taking a pg_basebackup. This recovery.conf file must exist in the data directory($PGDATA) of Slave.
Step 5:
Start your slave once the backup and restore are completed.
If you have configured a backup (remotely) using the streaming method mentioned in Step 4, it just copies all the files and directories to the data directory of the slave. Which means it is both a back up of the master data directory and also provides for restore in a single step.
If you have taken a tar back up from the master and shipped it to the slave, you must unzip/untar the back up to the slave data directory, followed by creating a recovery.conf as mentioned in the previous step. Once done, you may proceed to start your PostgreSQL instance on the slave using the following command.
Step 6:
In a production environment, it is always advisable to have the parameter restore_command set appropriately. This parameter takes a shell command (or a script) that can be used to fetch the WAL needed by a slave, if the WAL is not available on the master.
For example:
If a network issue has caused a slave to lag behind the master for a substantial time, it is less likely to have those WALs required by the slave available on the master’s pg_xlog or pg_wal location. Hence, it is sensible to archive the WALs to a safe location, and to have the commands that are needed to restore the WAL set to restore_command parameter in the recovery.conf file of your slave. To achieve that, you have to add a line similar to the next example to your recovery.conf file in slave. You may substitute the cp command with a shell command/script or a copy command that helps the slave get the appropriate WALs from the archive location.
Setting the above parameter requires a restart and cannot be done online.
Final step: validate that replication is setup
As discussed earlier, a wal sender  and a wal receiver  process are started on the master and the slave after setting up replication. Check for these processes on both master and slave using the following commands.
You must see those all three processes running on master and slave as you see in the following example log.
You can see more details by querying the master’s pg_stat_replication view.
Reference : https://www.postgresql.org/docs/10/static/warm-standby.html#STANDBY-SERVER-SETUP
If you found this post interesting…
Did you know that Percona now provides PostgreSQL support services? If you’d like to read more about this, here’s some more information. We’re here to help.

How to Reset the Root Password in Linux

$
0
0
https://www.maketecheasier.com/reset-root-password-linux


In Linux, regular users and superusers are allowed to access services via password authentication. In the case a regular user can’t remember his/her password, a superuser can reset the password of a regular user right from the terminal. However, what if the superuser (or root user) loses his/her password?
To recover the lost password of a superuser (or root user),  it is done quite differently. Nonetheless, this method of recovering a lost password allows any malicious user with physical access to your Linux host to gain complete ownership.
In this article we will  look at how to recover a lost root password in Linux two different ways.
Note: the method of resetting a root password is similar for most distros. In this article we are using Ubuntu. Also, we will be using “root password” throughout the tutorial, but it can refer to a superuser’s password, too.</>
1. First and foremost, to recover a lost root password, we need to restart the Linux host, assuming you can’t remember the password for root (or superuser).
2 . Once the GRUB page appears, quickly select the “*Advanced options for GNU/Linux” option by pressing the down arrow key and Enter button.
grub-advanced-options
3. Now press e to edit the commands.
You need to modify it or change it from “read-only” mode to “read-write” mode. Find the line beginning with “Linux.” After, look for “ro,” and change it “rw.” Add init=/bin/bash at the end of the line.
grub-edit-kernel-loading-menu
4. Press F10. This will display a screen with a prompt.
grub-boot-bash-screen
5. Mount your root filesystem in read-write mode:
6. You can now reset your lost root password by using the following command:
Alternatively, you can change the password of the super user with the command:
grub-bash-screen-reset-password
Once you are done, type:
to exit the prompt and reboot the computer.
If you have a Linux Live CD (or USB), then you can boot into it and use it to reset the root password, too. In our example we will use a Ubuntu Live CD.
1. Download the latest version of Ubuntu, and create a bootable Live CD/USB from it. Boot your system from it.
2. On the display screen select “Try Ubuntu.” This will bring you to the Live CD desktop.
ubuntu-live-cd-try-ubuntu
3. Open the terminal, and type the following command to become root:
4. Next, we need to find out the location of the hard disk partition. Use the following command:
In most cases it will be “/dev/sda1,” though it can differ depending on how your hard disk is partitioned.
5. Mount the hard disk partition of the system to be recovered using the following command:
ubuntu-livecd-mount-partition
6. At this point we need to jail ourselves in the “mnt/recovery” directory. What this means is that we are pretending to be on the regular Linux filesystem. This is simply known as chrooting.
7. Use the following command to reset your root password:
or us:
to reset the password of a superuser.
8. Once completed, exit from the chroot shell:
9. Unmount the root partition:
and exit your root:
10. Lastly, remove the Live CD and reboot into your Linux system.
Changing the root password in Linux is easy, though it requires you to venture into the dark realm of the command line. Do note that anyone who has access to your computer can use this method to reset your superuser or root password. One precaution you can take is to encrypt the whole hard disk so it can’t be booted or mounted so easily.

4 Ansible playbooks you should try

$
0
0
https://opensource.com/article/18/8/ansible-playbooks-you-should-try

Streamline and tighten automation processes in complex IT environments with these Ansible playbooks.

Image by : 
opensource.com
x

Get the newsletter

Join the 85,000 open source advocates who receive our giveaway alerts and article roundups.
In a complex IT environment, even the smallest tasks can seem to take forever. Sprawling systems are hard to develop, deploy, and maintain. Business demands only increase complexity, and IT teams struggle with management, availability, and cost.
How do you address this complexity and while meeting today's business demands? There is no doubt that Ansible can improve your current processes, migrate applications for better optimization, and provide a single language for DevOps practices across your organization. More importantly, you can declare configurations through Ansible playbooks, but they orchestrate steps of any manual ordered process, even as different steps must bounce back and forth between sets of machines in particular orders. They can launch tasks synchronously or asynchronously.
While you might run the main /usr/bin/ansible program for ad-hoc tasks, playbooks are more likely to be kept in source control and used to push out your configuration or ensure the configurations of your remote systems are in spec. Because the Ansible playbooks are configuration, deployment, and orchestration language, they can describe a policy you want your remote systems to enforce or a set of steps in a general IT process.
Here are four Ansible playbooks that you should try to further customize and configure how your automation works.

Managing Kubernetes objects

When you perform CRUD operations on Kubernetes objects, Ansible playbooks enable you to quickly and easily access the full range of Kubernetes APIs through the OpenShift Python client. The following playbook snippets show you how to create specific Kubernetes namespace and service objects:


- name: Create a k8s namespace

  k8s:

    name: mynamespace

    api_version: v1

    kind: Namespace

    state: present


- name: Create a Service object from an inline definition

  k8s:

    state: present

    definition:

      apiVersion: v1

      kind: Service

      metadata:

        name: web

        namespace: mynamespace

        labels:

          app: galaxy

          service: web

      spec:

        selector:

          app: galaxy

          service: web

        ports:

        - protocol: TCP

          targetPort: 8000

          name: port-8000-tcp

          port: 8000


- name: Create a Service object by reading the definition from a file

  k8s:

    state: present

    src: /mynamespace/service.yml


# Passing the object definition from a file

- name: Create a Deployment by reading the definition from a local file

  k8s:

    state: present

    src: /mynamespace/deployment.yml


Mitigate critical security concerns like Meltdown and Spectre

In the first week of January, two flaws were announced: Meltdown and Spectre. Both involved the hardware at the heart of more or less every computing device on the planet: the processor. There is a great in-depth review of the two flaws here. While Meltdown and Spectre are not completely mitigated, the following playbook snippets show how to easily deploy the patches for Windows:


- name: Patch Windows systems against Meltdown and Spectre

  hosts: "{{ target_hosts | default('all') }}"


  vars:

    reboot_after_update: no

    registry_keys:

      - path: HKLM:\SYSTEM\CurrentControlSet\Control\Session Manager\Memory Management

        name: FeatureSettingsOverride

        data: 0

        type: dword


      - path: HKLM:\SYSTEM\CurrentControlSet\Control\Session Manager\Memory Management

        name: FeatureSettingsOverrideMask

        data: 3

        type: dword


      # https://support.microsoft.com/en-us/help/4072699

      - path: HKLM:\SOFTWARE\Microsoft\Windows\CurrentVersion\QualityCompat

        name: cadca5fe-87d3-4b96-b7fb-a231484277cc

        type: dword

        data: '0x00000000'


  tasks:

    - name: Install security updates

      win_updates:

        category_names:

          - SecurityUpdates

      notify: reboot windows system


    - name: Enable kernel protections

      win_regedit:

        path: "{{ item.path }}"

        name: "{{ item.name }}"

        data: "{{ item.data }}"

        type: "{{ item.type }}"

      with_items: "{{ registry_keys }}"


  handlers:

    - name: reboot windows system

      win_reboot:

        shutdown_timeout: 3600

        reboot_timeout: 3600

      when: reboot_after_update


You can also find other playbooks for Linux.

Integrating a CI/CD process with Jenkins

Jenkins is a well-known tool for implementing CI/CD. Shell scripts are commonly used for provisioning environments or to deploy apps during the pipeline flow. Although this could work, it is cumbersome to maintain and reuse scripts in the long run. The following playbook snippets show how to provision infrastructure in a Continuous Integration/Continuous Delivery (CI/CD) process using a Jenkins Pipeline.


---

- name: Deploy Jenkins CI

hosts: jenkins_server

remote_user: vagrant

become: yes


roles:

  - geerlingguy.repo-epel

  - geerlingguy.jenkins

  - geerlingguy.git

  - tecris.maven

  - geerlingguy.ansible


- name: Deploy Nexus Server

hosts: nexus_server

remote_user: vagrant

become: yes


roles:

  - geerlingguy.java

  - savoirfairelinux.nexus3-oss


- name: Deploy Sonar Server

hosts: sonar_server

remote_user: vagrant

become: yes


roles:

  - wtanaka.unzip

  - zanini.sonar


- name: On Premises CentOS

hosts: app_server

remote_user: vagrant

become: yes


roles:

  - jenkins-keys-config


Starting a service mesh with Istio

With a cloud platform, developers must use microservices to architect for portability. Meanwhile, operators are managing extremely large hybrid and multi-cloud deployments. The service mesh with Istio lets you connect, secure, control, and observe services instead of developers through a dedicated infrastructure such as an Envoy sidecar container. The following playbook snippets show how to install Istio locally on your machine:


---


# Whether the cluster is an Openshift (ocp) or upstream Kubernetes (k8s) cluster

cluster_flavour: ocp


istio:

  # Install istio with or without istio-auth module

  auth: false


  # A set of add-ons to install, for example kiali

  addon: []


  # The names of the samples that should be installed as well.

  # The available samples are in the istio_simple_samples variable

  # In addition to the values in istio_simple_samples, 'bookinfo' can also be specified

  samples: []


  # Whether or not to open apps in the browser

  open_apps: false


  # Whether to delete resources that might exist from previous Istio installations

  delete_resources: false


Conclusion

You can find full sets of playbooks that illustrate many of these techniques in the ansible-examples repository. I recommend looking at these in another tab as you go along.
Hopefully, these tips and snippets of Ansible playbooks have provided some interesting ways to use and extend your automation journey.

Linux tricks that can save you time and trouble

$
0
0
https://www.networkworld.com/article/3305811/linux/linux-tricks-that-even-you-can-love.html

Some command line tricks can make you even more productive on the Linux command line.

Good Linux command line tricks don’t only save you time and trouble. They also help you remember and reuse complex commands, making it easier for you to focus on what you need to do, not how you should go about doing it. In this post, we’ll look at some handy command line tricks that you might come to appreciate.

Editing your commands

When making changes to a command that you're about to run on the command line, you can move your cursor to the beginning or the end of the command line to facilitate your changes using the ^a (control key plus “a”) and ^e (control key plus “e”) sequences.
You can also fix and rerun a previously entered command with an easy text substitution by putting your before and after strings between ^ characters -- as in ^before^after^.
$ eho hello world <== oops!

Command 'eho' not found, did you mean:

command 'echo' from deb coreutils
command 'who' from deb coreutils

Try: sudo apt install

$ ^e^ec^ <== replace text
echo hello world
hello world

Logging into a remote system with just its name

If you log into other systems from the command line (I do this all the time), you might consider adding some aliases to your system to supply the details. Your alias can provide the username you want to use (which may or may not be the same as your username on your local system) and the identity of the remote server. Use an alias server_name=’ssh -v -l username IP-address' type of command like this:
$ alias butterfly=”ssh -v -l jdoe 192.168.0.11”
You can use the system name in place of the IP address if it’s listed in your /etc/hosts file or available through your DNS server.
And remember you can list your aliases with the alias command.
$ alias
alias butterfly='ssh -v -l jdoe 192.168.0.11'
alias c='clear'
alias egrep='egrep --color=auto'
alias fgrep='fgrep --color=auto'
alias grep='grep --color=auto'
alias l='ls -CF'
alias la='ls -A'
alias list_repos='grep ^[^#] /etc/apt/sources.list /etc/apt/sources.list.d/*'
alias ll='ls -alF'
alias ls='ls --color=auto'
alias show_dimensions='xdpyinfo | grep '\''dimensions:'\'''
It's good practice to test new aliases and then add them to your ~/.bashrc or similar file to be sure they will be available any time you log in.

Freezing and thawing out your terminal window

The ^s (control key plus “s”) sequence will stop a terminal from providing output by running an XOFF (transmit off) flow control. This affects PuTTY sessions, as well as terminal windows on your desktop. Sometimes typed by mistake, however, the way to make the terminal window responsive again is to enter ^q (control key plus “q”). The only real trick here is remembering ^q since you aren't very likely run into this situation very often.

Repeating commands

Linux provides many ways to reuse commands. The key to command reuse is your history buffer and the commands it collects for you. The easiest way to repeat a command is to type an ! followed by the beginning letters of a recently used command. Another is to press the up-arrow on your keyboard until you see the command you want to reuse and then press enter. You can also display previously entered commands and then type ! followed by the number shown next to the command you want to reuse in the displayed command history entries.
!!     <== repeat previous command
!ec <== repeat last command that started with "ec"
!76 <== repeat command #76 from command history

Watching a log file for updates

Commands such as tail -f /var/log/syslog will show you lines as they are being added to the specified log file — very useful if you are waiting for some particular activity or want to track what’s happening right now. The command will show the end of the file and then additional lines as they are added.
$ tail -f /var/log/auth.log
Sep 17 09:41:01 fly CRON[8071]: pam_unix(cron:session): session closed for user smmsp
Sep 17 09:45:01 fly CRON[8115]: pam_unix(cron:session): session opened for user root
Sep 17 09:45:01 fly CRON[8115]: pam_unix(cron:session): session closed for user root
Sep 17 09:47:00 fly sshd[8124]: Accepted password for shs from 192.168.0.22 port 47792
Sep 17 09:47:00 fly sshd[8124]: pam_unix(sshd:session): session opened for user shs by
Sep 17 09:47:00 fly systemd-logind[776]: New session 215 of user shs.
Sep 17 09:55:01 fly CRON[8208]: pam_unix(cron:session): session opened for user root
Sep 17 09:55:01 fly CRON[8208]: pam_unix(cron:session): session closed for user root
<== waits for additional lines to be added

Asking for help

For most Linux commands, you can enter the name of the command followed by the option --help to get some fairly succinct information on what the command does and how to use it. Less extensive than the man command, the --help option often tells you just what you need to know without expanding on all of the options available.
$ mkdir --help
Usage: mkdir [OPTION]... DIRECTORY...
Create the DIRECTORY(ies), if they do not already exist.

Mandatory arguments to long options are mandatory for short options too.
-m, --mode=MODE set file mode (as in chmod), not a=rwx - umask
-p, --parents no error if existing, make parent directories as needed
-v, --verbose print a message for each created directory
-Z set SELinux security context of each created directory
to the default type
--context[=CTX] like -Z, or if CTX is specified then set the SELinux
or SMACK security context to CTX
--help display this help and exit
--version output version information and exit

GNU coreutils online help:
Full documentation at:
or available locally via: info '(coreutils) mkdir invocation'

Removing files with care

To add a little caution to your use of the rm command, you can set it up with an alias that asks you to confirm your request to delete files before it goes ahead and deletes them. Some sysadmins make this the default. In that case, you might like the next option even more.
$ rm -i   <== prompt for confirmation

Turning off aliases

You can always disable an alias interactively by using the unalias command. It doesn’t change the configuration of the alias in question; it just disables it until the next time you log in or source the file in which the alias is set up.
$ unalias rm
If the rm -i alias is set up as the default and you prefer to never have to provide confirmation before deleting files, you can put your unalias command in one of your startup files (e.g., ~/.bashrc).

Remembering to use sudo

If you often forget to precede commands that only root can run with “sudo”, there are two things you can do. You can take advantage of your command history by using the “sudo !!” (use sudo to run your most recent command with sudo prepended to it), or you can turn some of these commands into aliases with the required "sudo" attached.
$ alias update=’sudo apt update’

More complex tricks

Some useful command line tricks require a little more than a clever alias. An alias, after all, replaces a command, often inserting options so you don't have to enter them and allowing you to tack on additional information. If you want something more complex than an alias can manage, you can write a simple script or add a function to your .bashrc or other start-up file. The function below, for example, creates a directory and moves you into it. Once it's been set up, source your .bashrc or other file and you can use commands such as "md temp" to set up a directory and cd into it.
md () { mkdir -p "$@"&& cd "$1"; }

Wrap-up

Working on the Linux command line remains one of the most productive and enjoyable ways to get work done on my Linux systems, but a group of command line tricks and clever aliases can make that experience even better.
Join the Network World communities on Facebook and LinkedIn to comment on topics that are top of mind.
Viewing all 1413 articles
Browse latest View live


<script src="https://jsc.adskeeper.com/r/s/rssing.com.1596347.js" async> </script>